I wanted to monitor the traffic of my home network directly inside my Grafana dashboards, but there was one annoying limitation: the standard OpenWrt Prometheus exporter can expose interfaces, NAT traffic and system metrics, but they don’t give me a simple per-device view, with the actual DHCP names of my devices.
In practice, I could see traffic on interfaces such as pppoe-wan, br-lan, bond0, VLANs, even IP addresses, but not a clean list like the traffic from: MacBook, Archive server, Grafana server, iPad kiosk, HomePod, etc…
That is the kind of view I wanted in Grafana: not just bytes per interface, but traffic per device, with the device’s name instead of the IP.
OpenWrt already has a very good package for this: nlbwmon

nlbwmon keeps track of traffic accounting per local device. It can show IP address, MAC address, protocol, port, Layer 7 protocol and the amount of received and transmitted traffic. It also has a LuCI interface, so it is already useful by itself.
The problem is that I wanted those same data inside Grafana.
So I created a small Lua collector for prometheus-node-exporter-lua
The idea is simple:
nlbwmon > Lua collector > prometheus-node-exporter-lua > Prometheus/Mimir > 📊 Grafana
The collector reads the output of nlbwmon, enriches it with hostnames from OpenWrt DHCP data and exposes everything as Prometheus metrics.
GitHub repository
The project and files are available here:
Explanation
The collector exports three Prometheus metrics:
nlbwmon_rx_bytes
nlbwmon_tx_bytes
nlbwmon_connections
Each metric includes labels:
family
proto
port
mac
ip
hostname
layer7
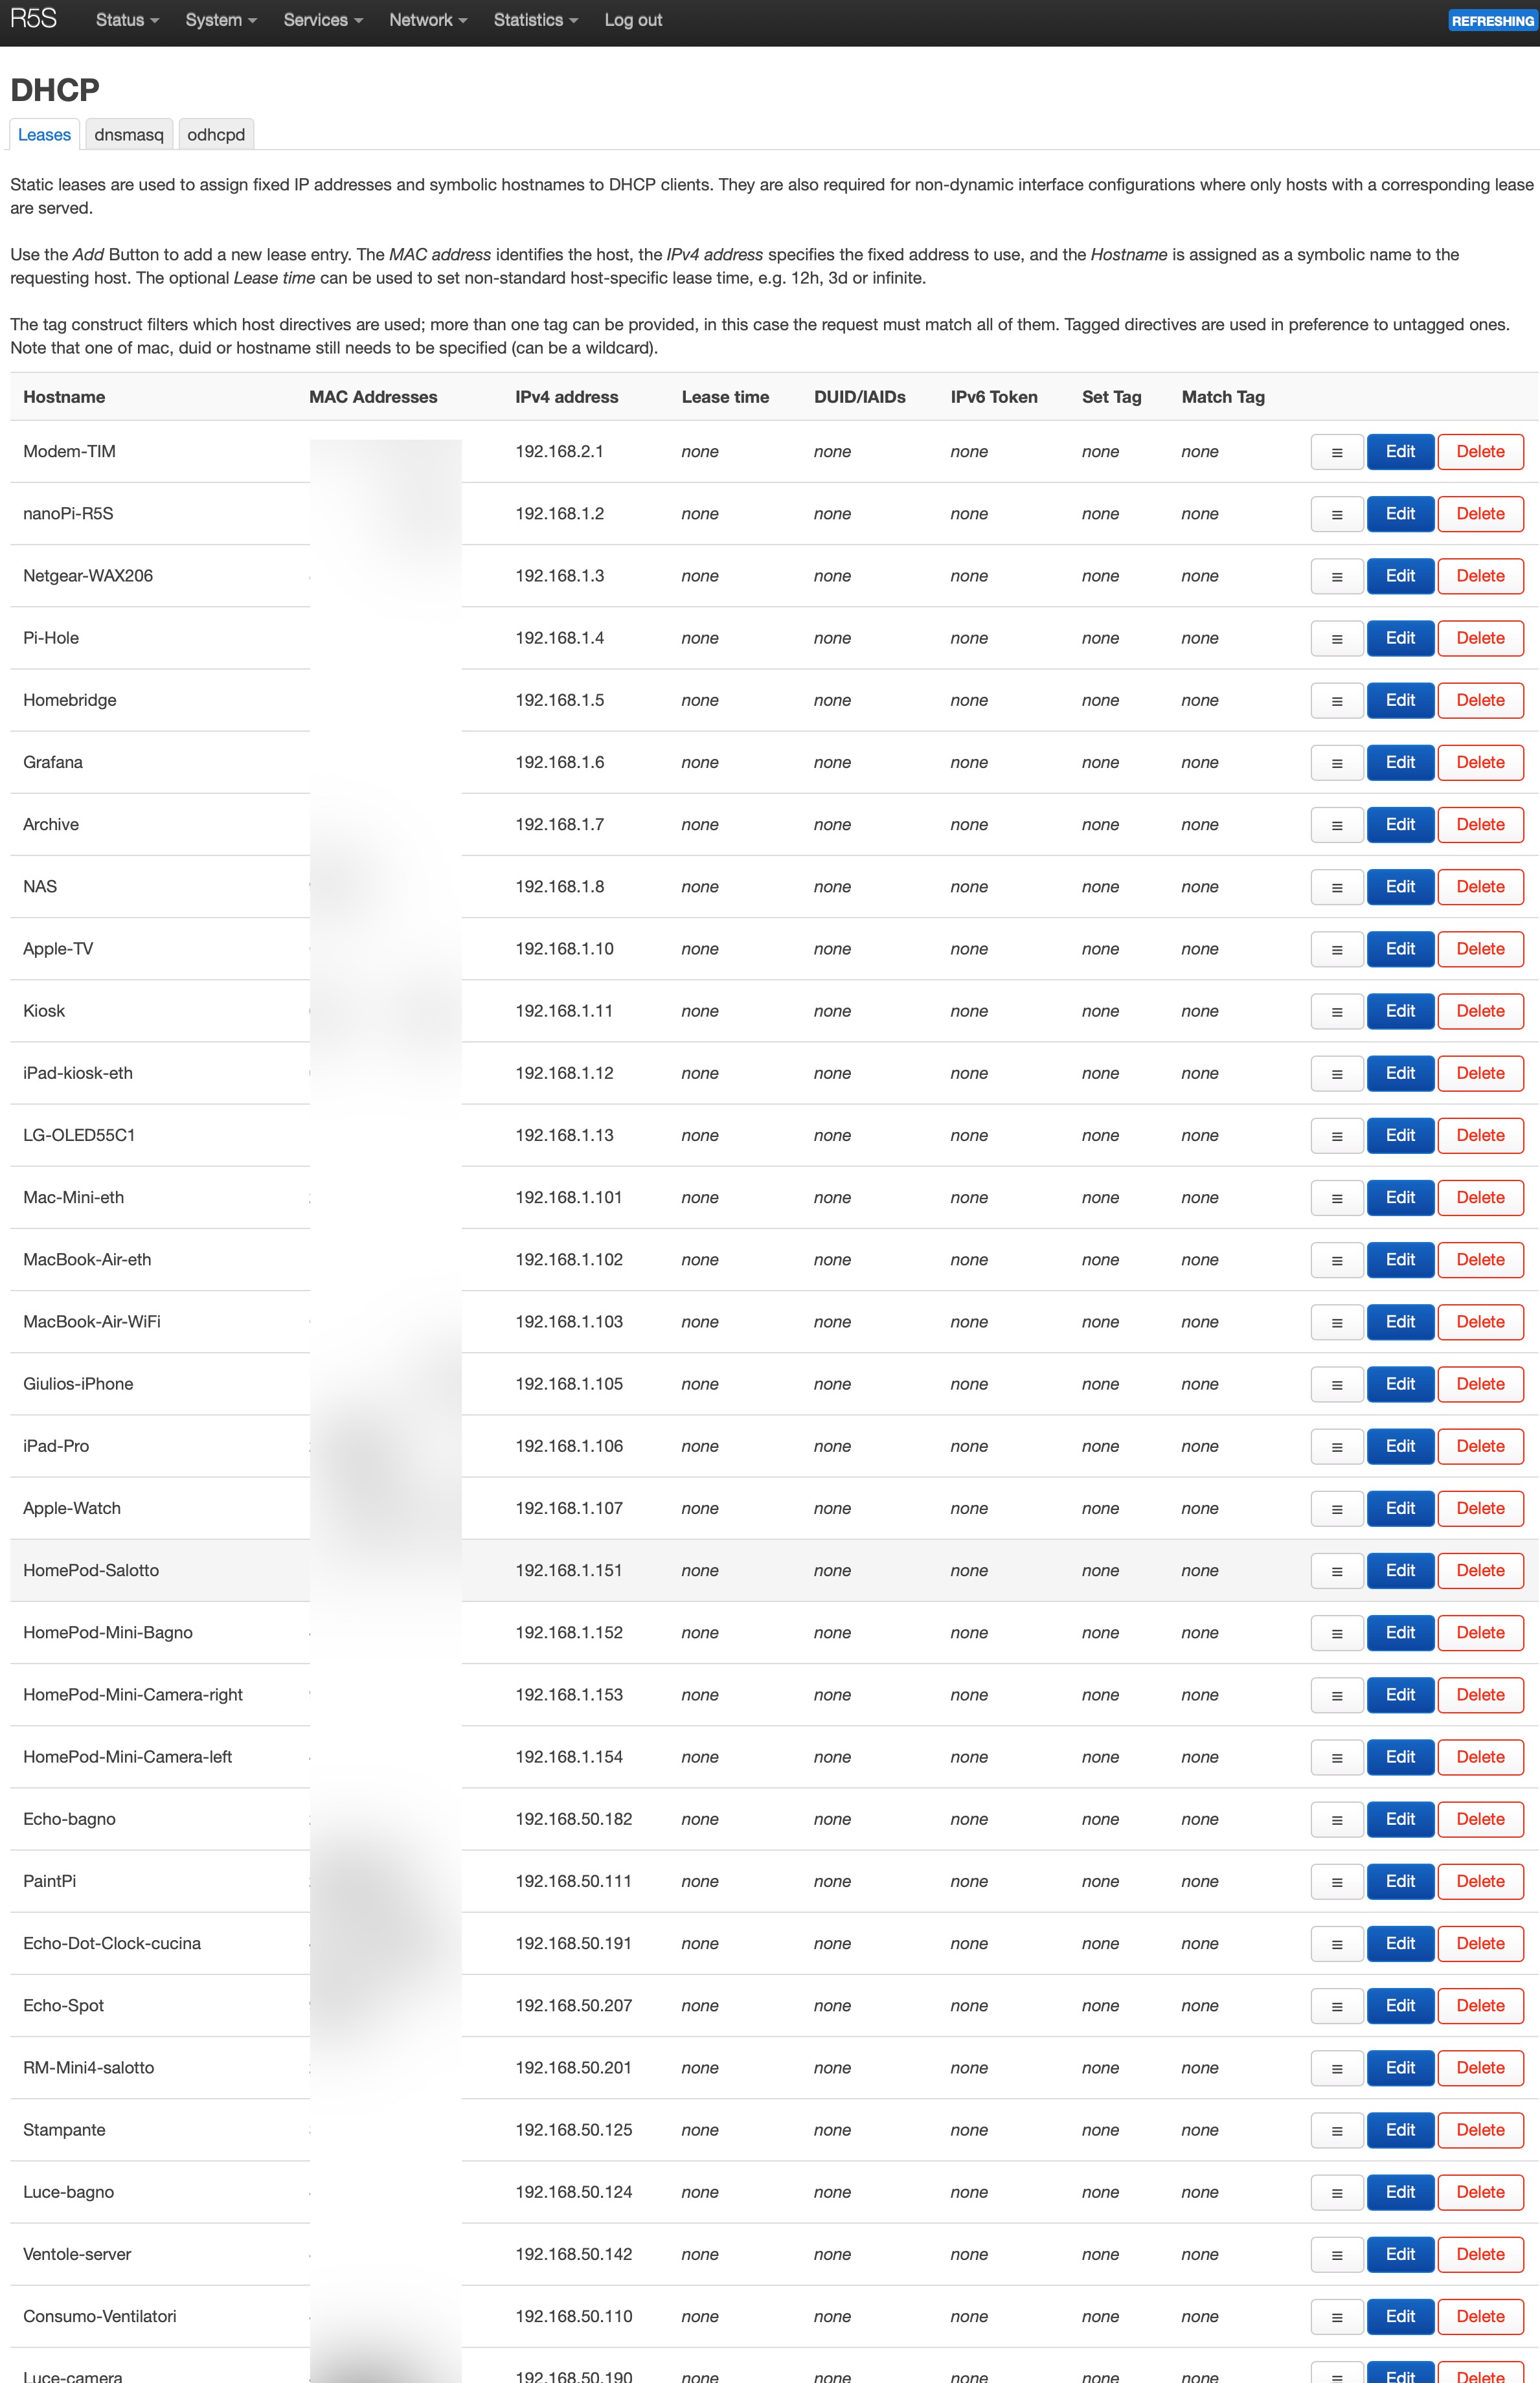
The core label for me is hostname. Without it, Grafana would only show the IPs. With the collector, Grafana can show instead the name of the static DHCP leases assigned to each IP from (LuCi) Network > DHCP > Leases
The hostname is resolved using:
- OpenWrt static DHCP host entries from
uci show dhcp, matched by IP address or MAC address - Active DHCP leases from
/tmp/dhcp.leases, matched by IP address or MAC address - The IP address itself as fallback
So, if a device has a static DHCP lease in OpenWrt, that name is used. If not, the collector tries to use the active DHCP lease, otherwise it falls back to the IP.
Installation
The technical details are in the GitHub README, but the basic installation is very simple.
First, install the required OpenWrt packages:
apk -U add nlbwmon prometheus-node-exporter-lua
Then, from your OpenWrt device, copy the Lua collector into the prometheus-node-exporter-lua collectors directory and restart the node-exporter:
wget -O /usr/lib/lua/prometheus-collectors/nlbwmon.lua https://raw.githubusercontent.com/giuliomagnifico/openwrt-nlbwmon-prometheus-collector/main/nlbwmon.lua && /etc/init.d/prometheus-node-exporter-lua restart
Test it locally on the router:
wget -qO- 'http://127.0.0.1:9100/metrics?collect[]=nlbwmon' | grep nlbwmon | head -n5
If it works correctly, you should see some queries like thesee:
root@R5S:~# wget -qO- 'http://127.0.0.1:9100/metrics?collect[]=nlbwmon' | grep nlbwmon | head -n 5
# TYPE nlbwmon_rx_bytes gauge
# TYPE nlbwmon_tx_bytes gauge
# TYPE nlbwmon_connections gauge
nlbwmon_rx_bytes{mac="9c:c8:e9:e7:bf:b8",proto="TCP",hostname="Echo-Spot",family="4",layer7="HTTPS",port="443",ip="192.168.50.207"} 112034145844
nlbwmon_rx_bytes{mac="f8:e4:3b:a3:5f:54",proto="TCP",hostname="MacBook-Air-eth",family="4",layer7="HTTPS",port="443",ip="192.168.1.102"} 17296542771
At this point, Prometheus can scrape the metrics from the same OpenWrt exporter endpoint you normally use:
- job_name: "nanopi-r5s"
  static_configs:
    - targets: ["192.168.1.2:9100"]
      labels:
        name: "nanoPi R5S"
(This means that if you already scrape prometheus-node-exporter-lua, there is nothing else to add)
Using it in Grafana
For a simple “traffic by device” panel, I use a PromQL query like this:
topk(20, sum by(hostname, ip) (
  increase(nlbwmon_rx_bytes{hostname=~".+"}[$__range])
  +
  increase(nlbwmon_tx_bytes{hostname=~".+"}[$__range])
))
This gives the total traffic per device over the selected Grafana time range, with the unit set to bytes(IEC).
Download and upload separately
The previous query adds received and transmitted traffic together.
For download only:
topk(20, sum by(hostname, ip) (
  increase(nlbwmon_rx_bytes{hostname=~".+"}[$__range])
))
For upload:
topk(20, sum by(hostname, ip) (
  increase(nlbwmon_tx_bytes{hostname=~".+"}[$__range])
))
For real-time bandwidth usage, instead of increase() I use rate():
topk(20, sum by(hostname, ip) (
  rate(nlbwmon_rx_bytes{hostname=~".+"}[$__rate_interval])
  +
  rate(nlbwmon_tx_bytes{hostname=~".+"}[$__rate_interval])
) * 8)
(In that case, the Grafana unit should be: bits/sec )
Using Grafana time ranges
Instead of hardcoding a range such as [24h] inside every PromQL query, I prefer to use Grafana’s built-in variable, so it can be displayed near the panel title
$__range
This means the same query can work for, example: Last 1 hour or Last 24 hours or Last 7 days etc…
For example:
increase(nlbwmon_rx_bytes[$__range])
will automatically follow the dashboard time range or the panel Relative time option.
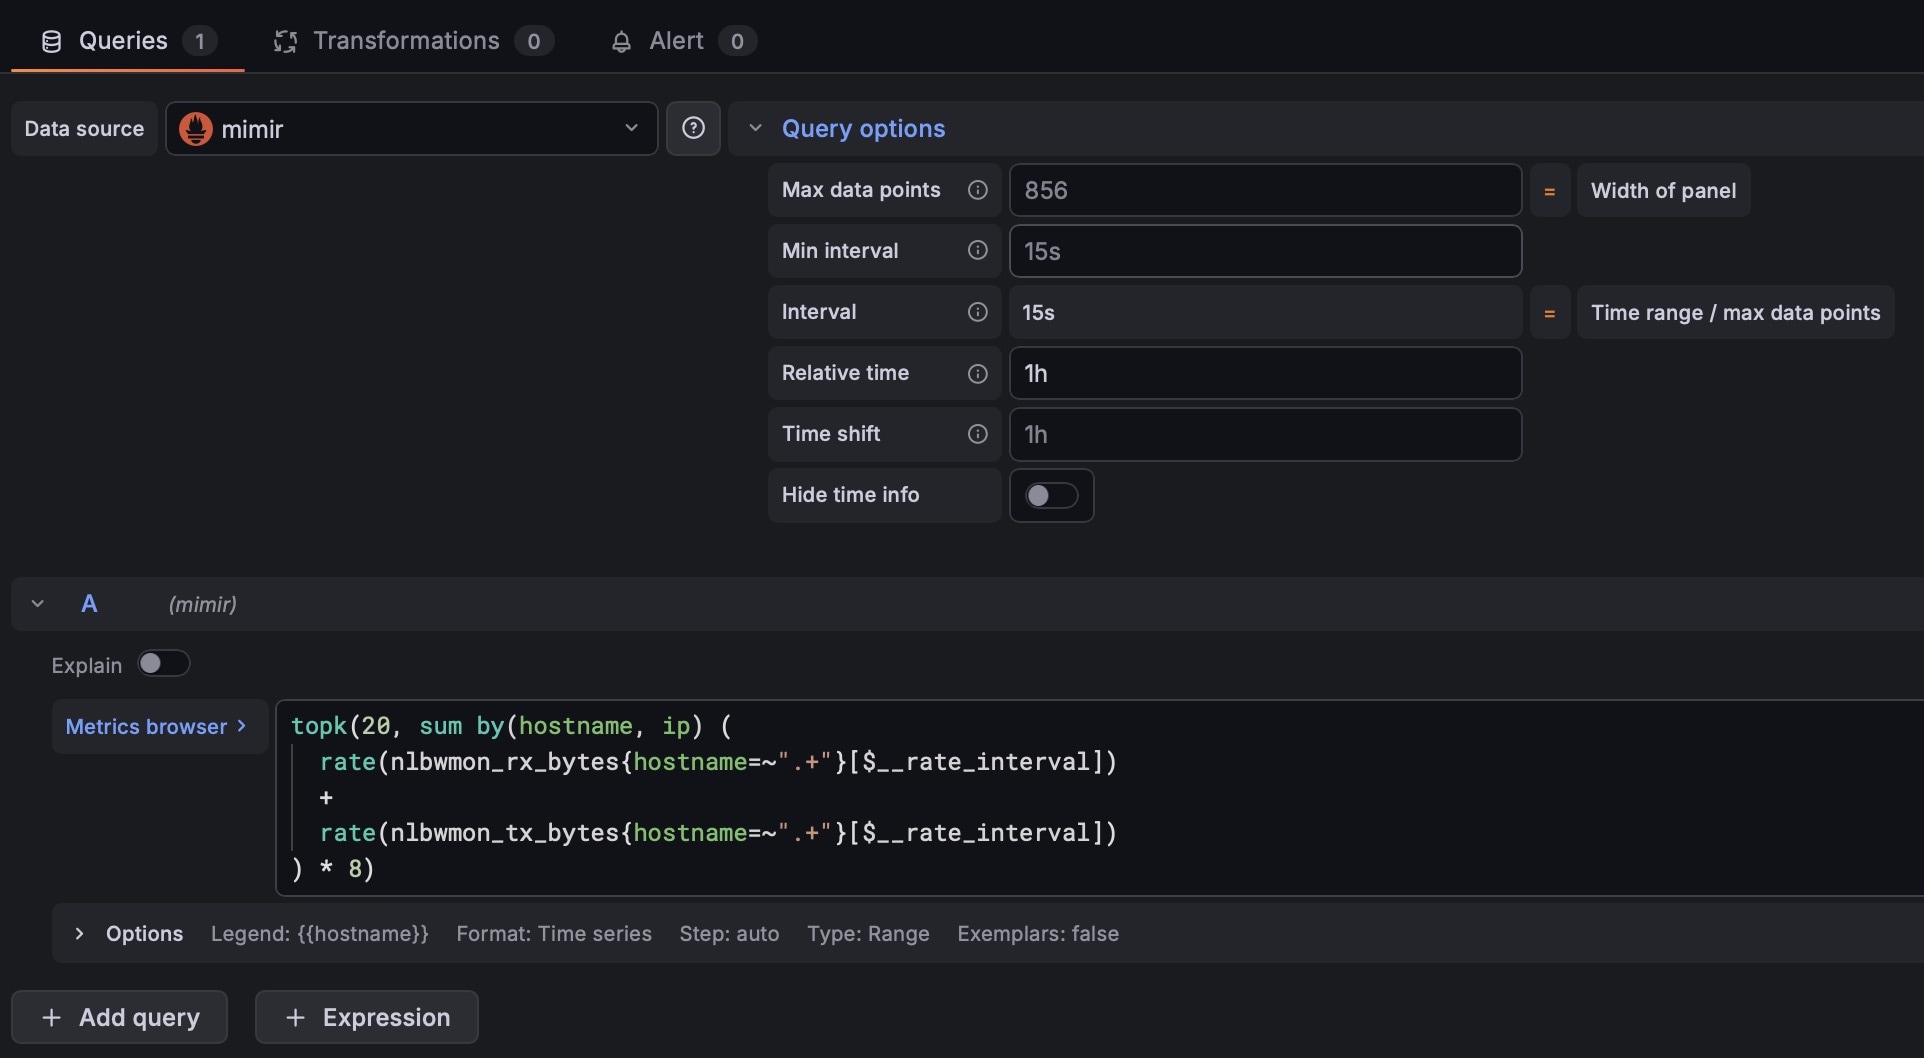
If I want a panel that always shows the last 24 hours, regardless of the dashboard range, I can set this in the panel query options:
Query options > Relative time: 24h
For “from the beginning of the current month”, Grafana can use:
From: now/M
To: now
nlbwmon resets
nlbwmon has its own accounting period, and in my case, it’s configured to restart every first day of the month. This means the cumulative values exported by the collector also reset monthly but you can use your Mimir/Prometheus database to retrieve older data now that this exporter has written the data to the database.
For example, for 12 months data, use this query and in Grafana set Time range: Last 12 months
sum(
  increase(nlbwmon_rx_bytes{hostname=~".+"}[1d])
  +
  increase(nlbwmon_tx_bytes{hostname=~".+"}[1d])
)
Conclusions
OpenWrt exporters already expose interface traffic, for example with node_network_receive_bytes_total and node_network_transmit_bytes_total, it’s easy to monitor the WAN interface:
rate(node_network_receive_bytes_total{device="pppoe-wan"}[5m]) * 8
That is useful for total WAN bandwidth but it does not answer my question:
Which device (name) used the most traffic?
For that, I needed per-host accounting, and nlbwmon already had the right data.
This collector only makes that data available to Prometheus and Grafana and is nicely visualizable.
Notes
If a device still appears as an IP address, it usually means OpenWrt doesnt have a name for it in static DHCP or in the active DHCP leases.
In that case, adding a static DHCP lease in OpenWrt is usually enough (from the OpenWrt LuCi Network > DHCP > Leases )