In this post I won’t go into extensive technical steps, it would become too long and complex. Instead, I’ll focus on describing the current state of my setup, including hardware and software updates. For those interested in the more in-depth technical details I’ve included links throughout the post to previously published articles related to a specific detail/hardware.
The updates in this post are:
- Cabinet new layout
- Network scheme
- MikroTik CSS318-16G-2S+IN switch
- miniPC for the Grafana monitoring stack
- Kiosk miniPC with a new 4K 13,4” touch display
- Archive miniPC for Paperless, Immich, n8n and Linkding
- UPS APC SMT-750I monitored via SNMP
- piArtFrame(s) digital paints
- iPad Pro M2
- HomePod(s)
- Grafana improvments
- Conclusions
These are the links to the previous versions of my setup, useful to understand how I evolved it over time and how I got to the current configuration:
- Jan 14, 2022 > My hardware and software setup for a new house
- Jun 02, 2022 > My network home setup - v2.0
- Aug 14, 2022 > My network home setup - v3.0
- Dec 12, 2022 > Some custom push notifications that improved my life
- Dec 19, 2022 > Retrieve a scheduled report of your Grafana dashboards via mail
- Jan 5, 2023 > My network home setup - v4.0
- Sep 14, 2023 > My network home setup - v4.5
- Aug 20, 2024 > My network home setup - v5.0
- Jul 8, 2024 > My network home setup - v5.5
- Sep 13, 2024 - cPiArtFrame - The PiArtFrame in C++ with Julia fractal
- Now > the details of this last update.
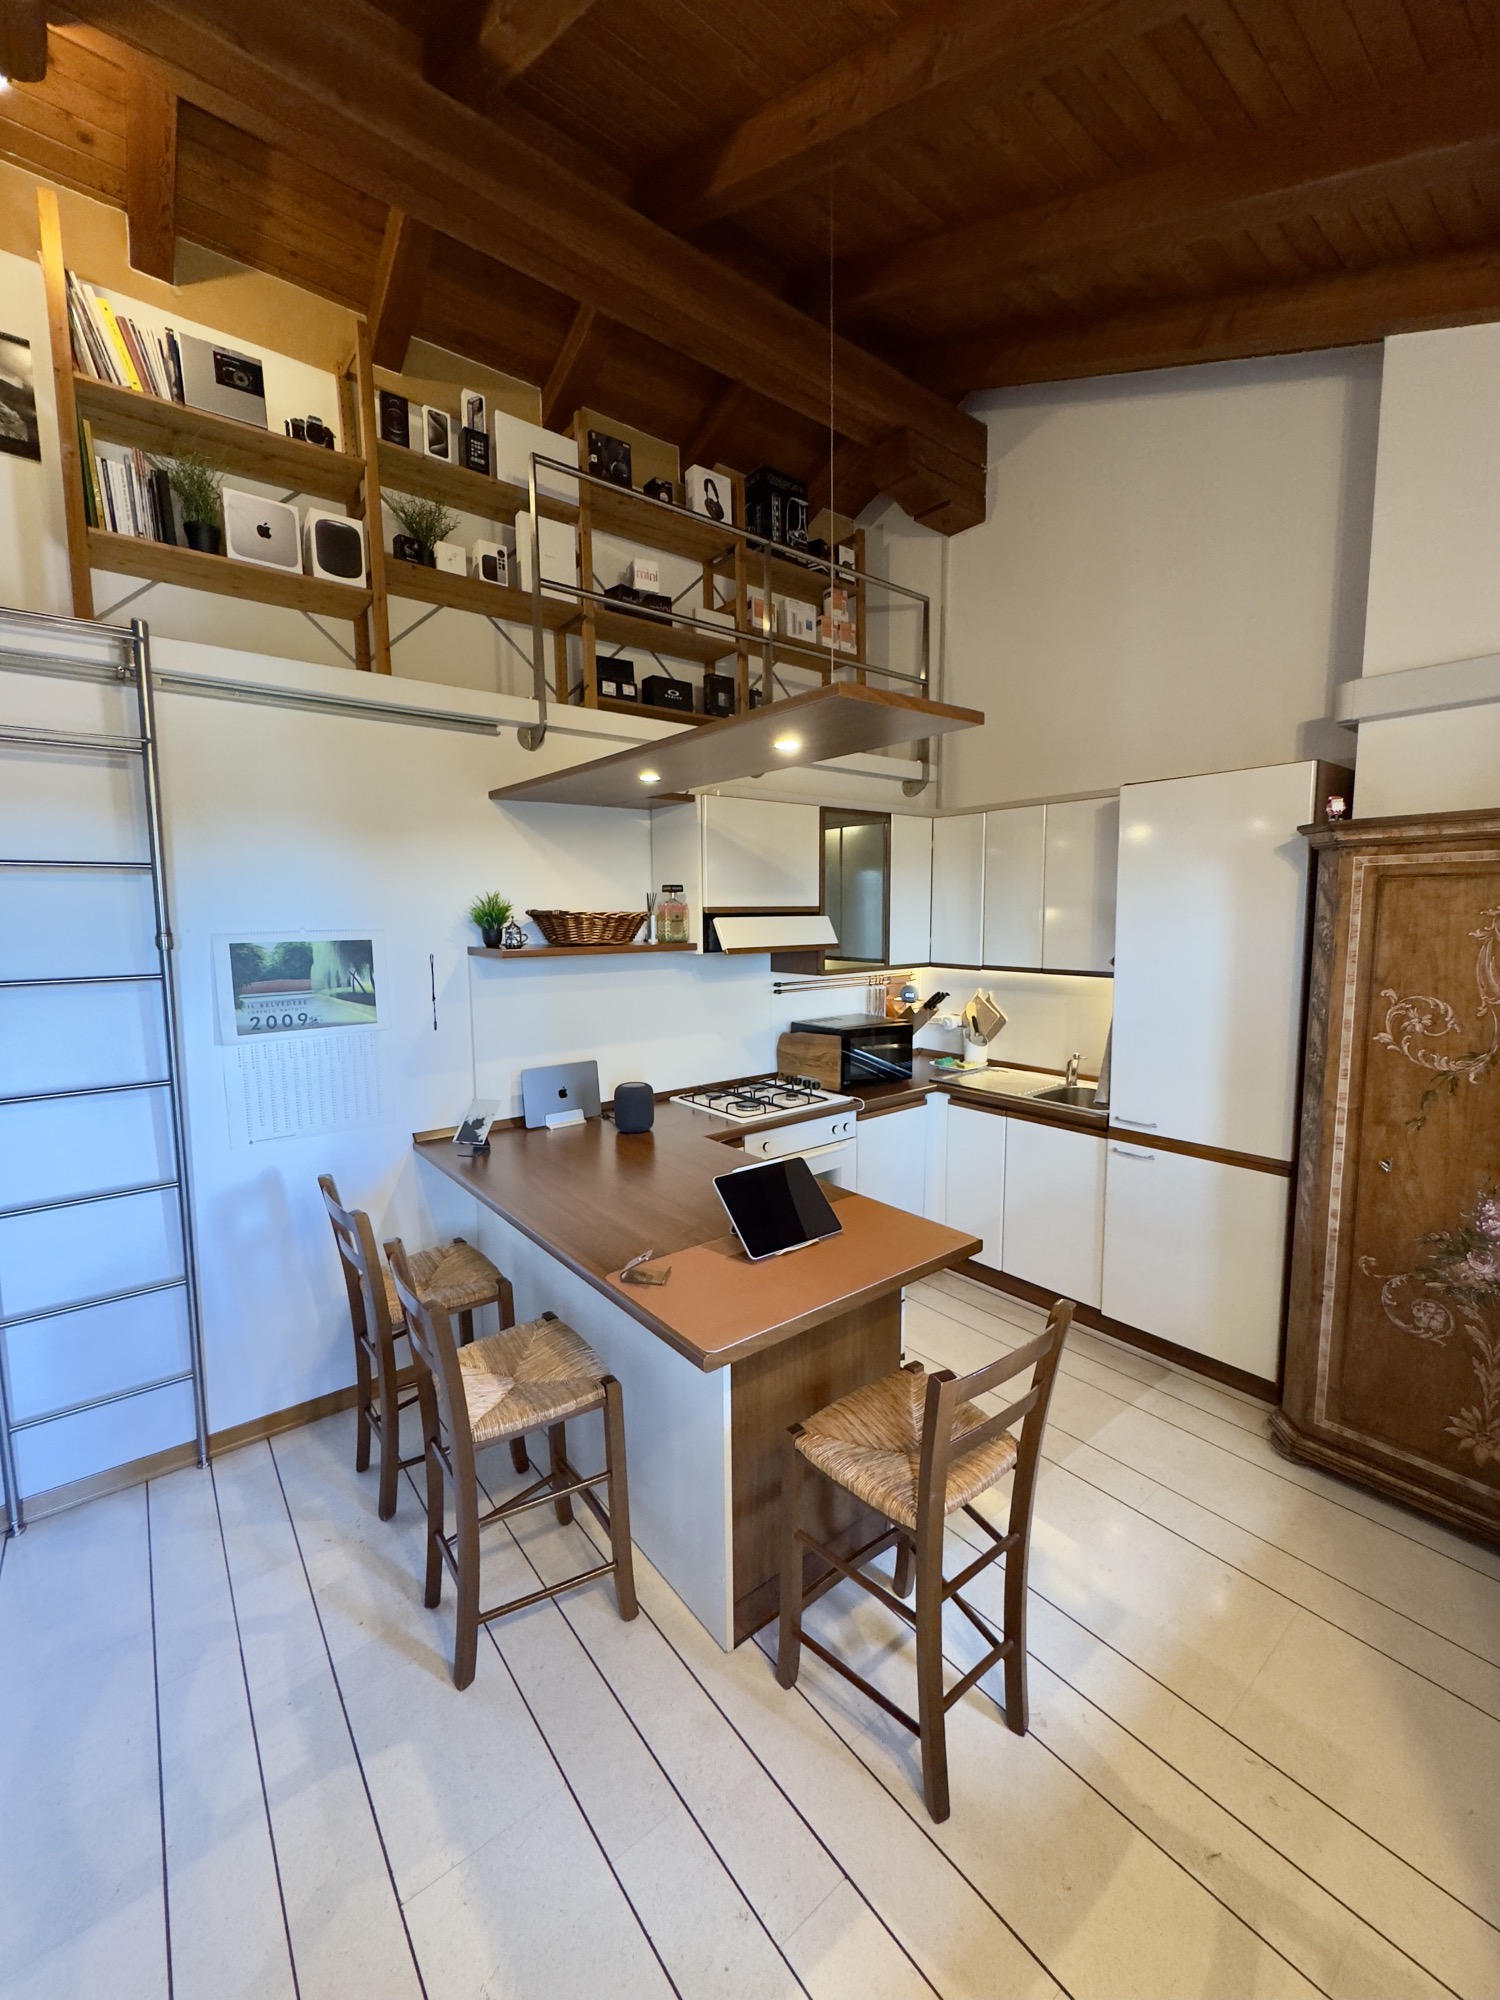
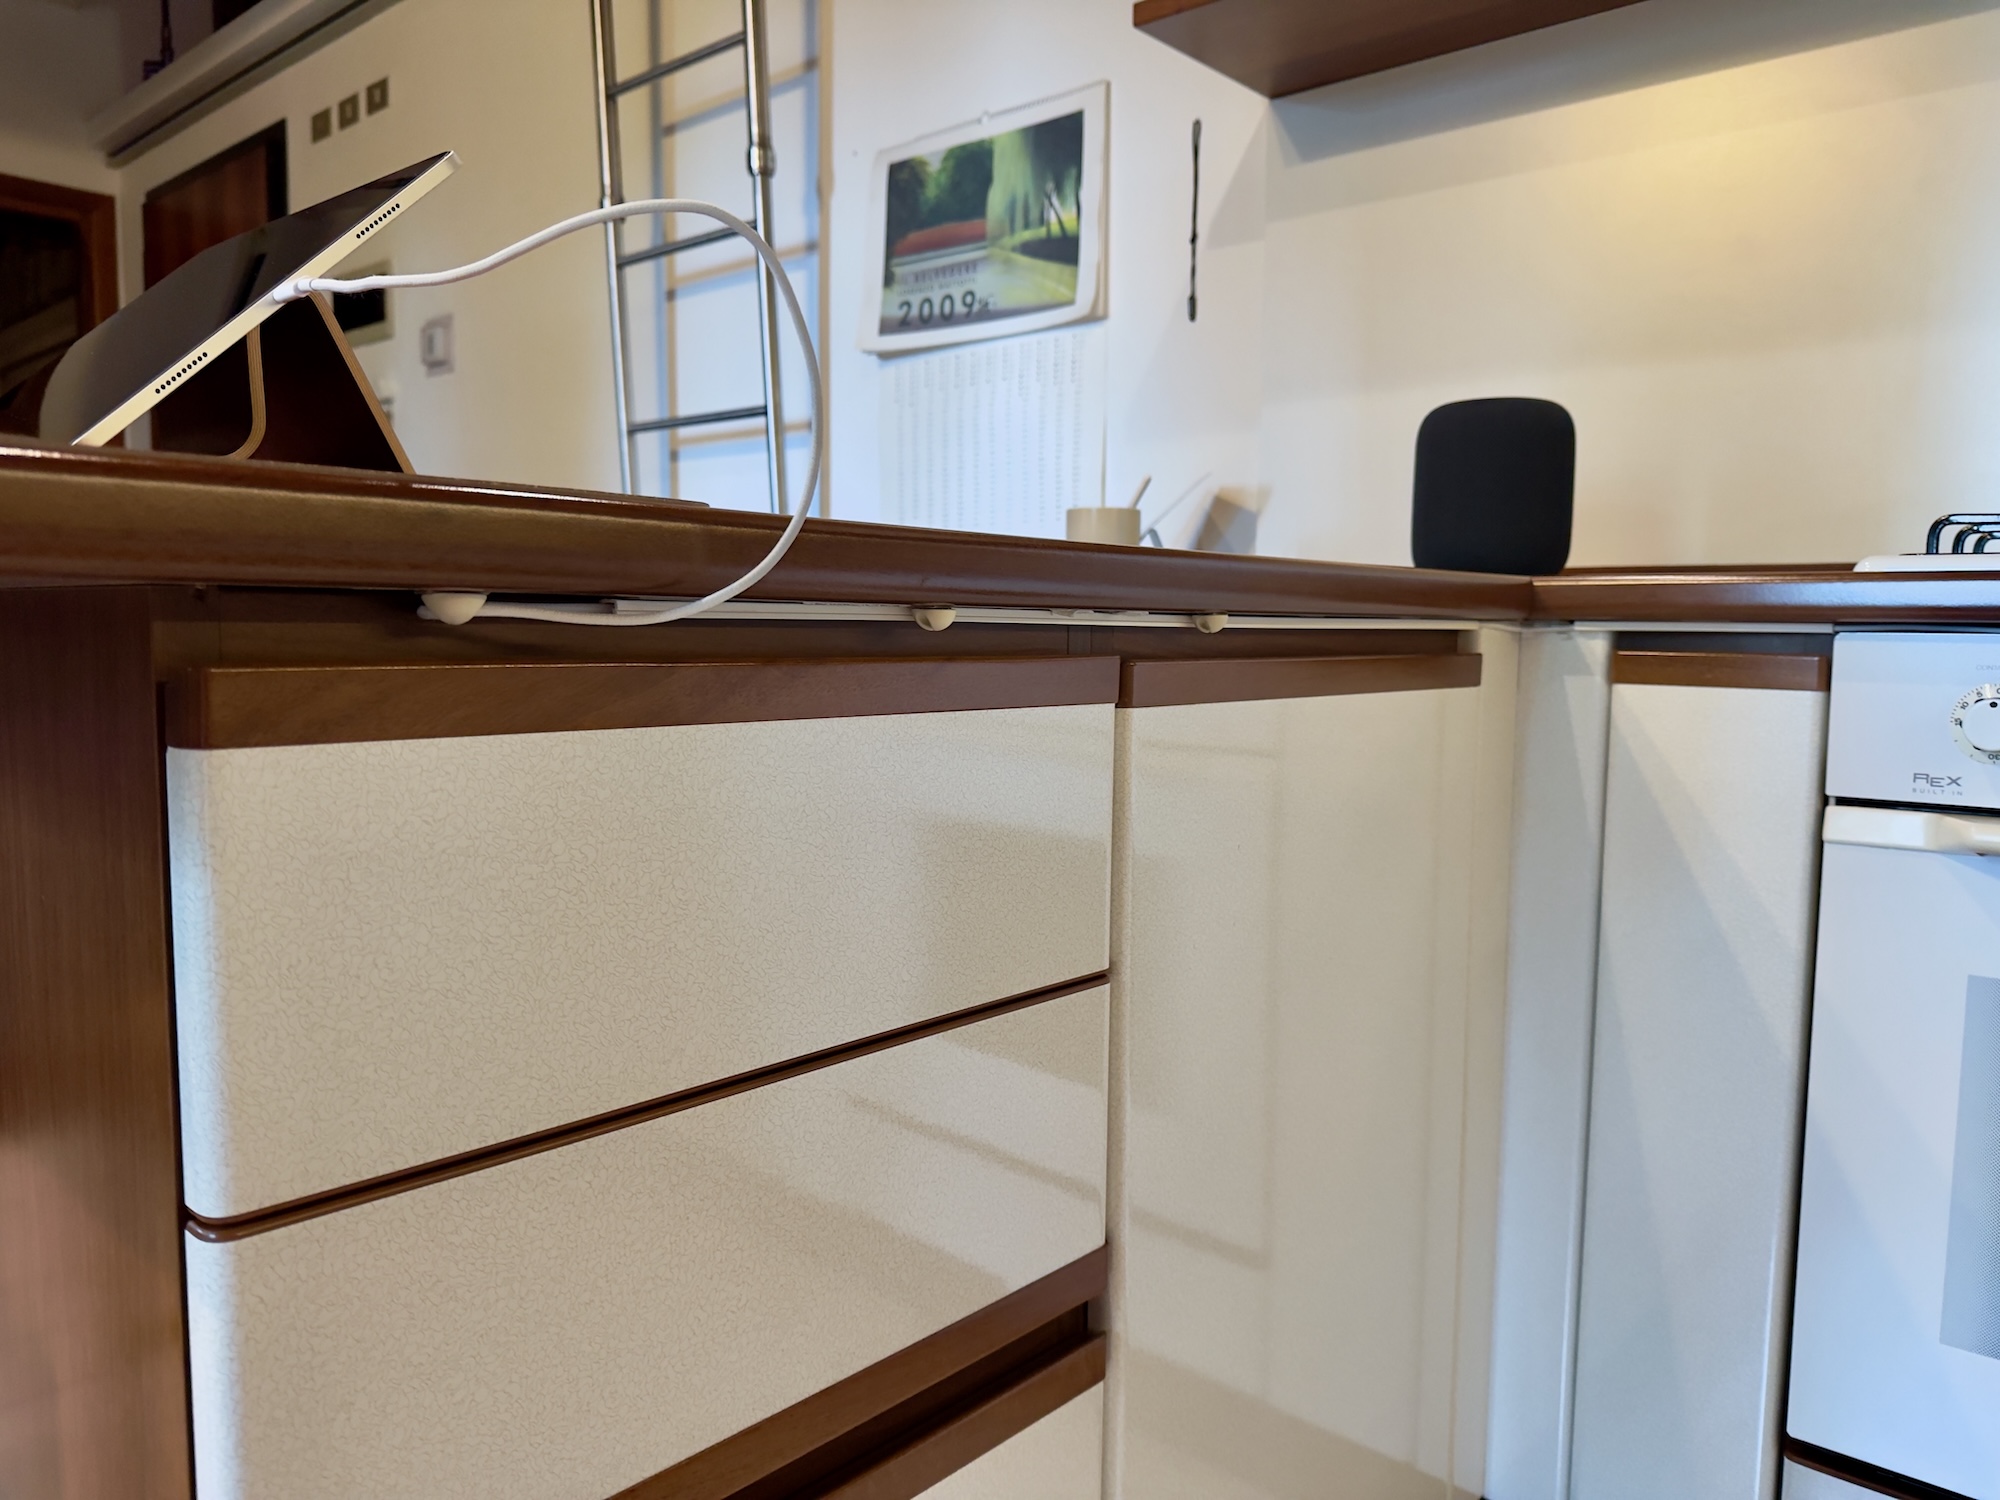
Cabinet new layout
I’ve slightly modified the cabinet layout for the new hardware.
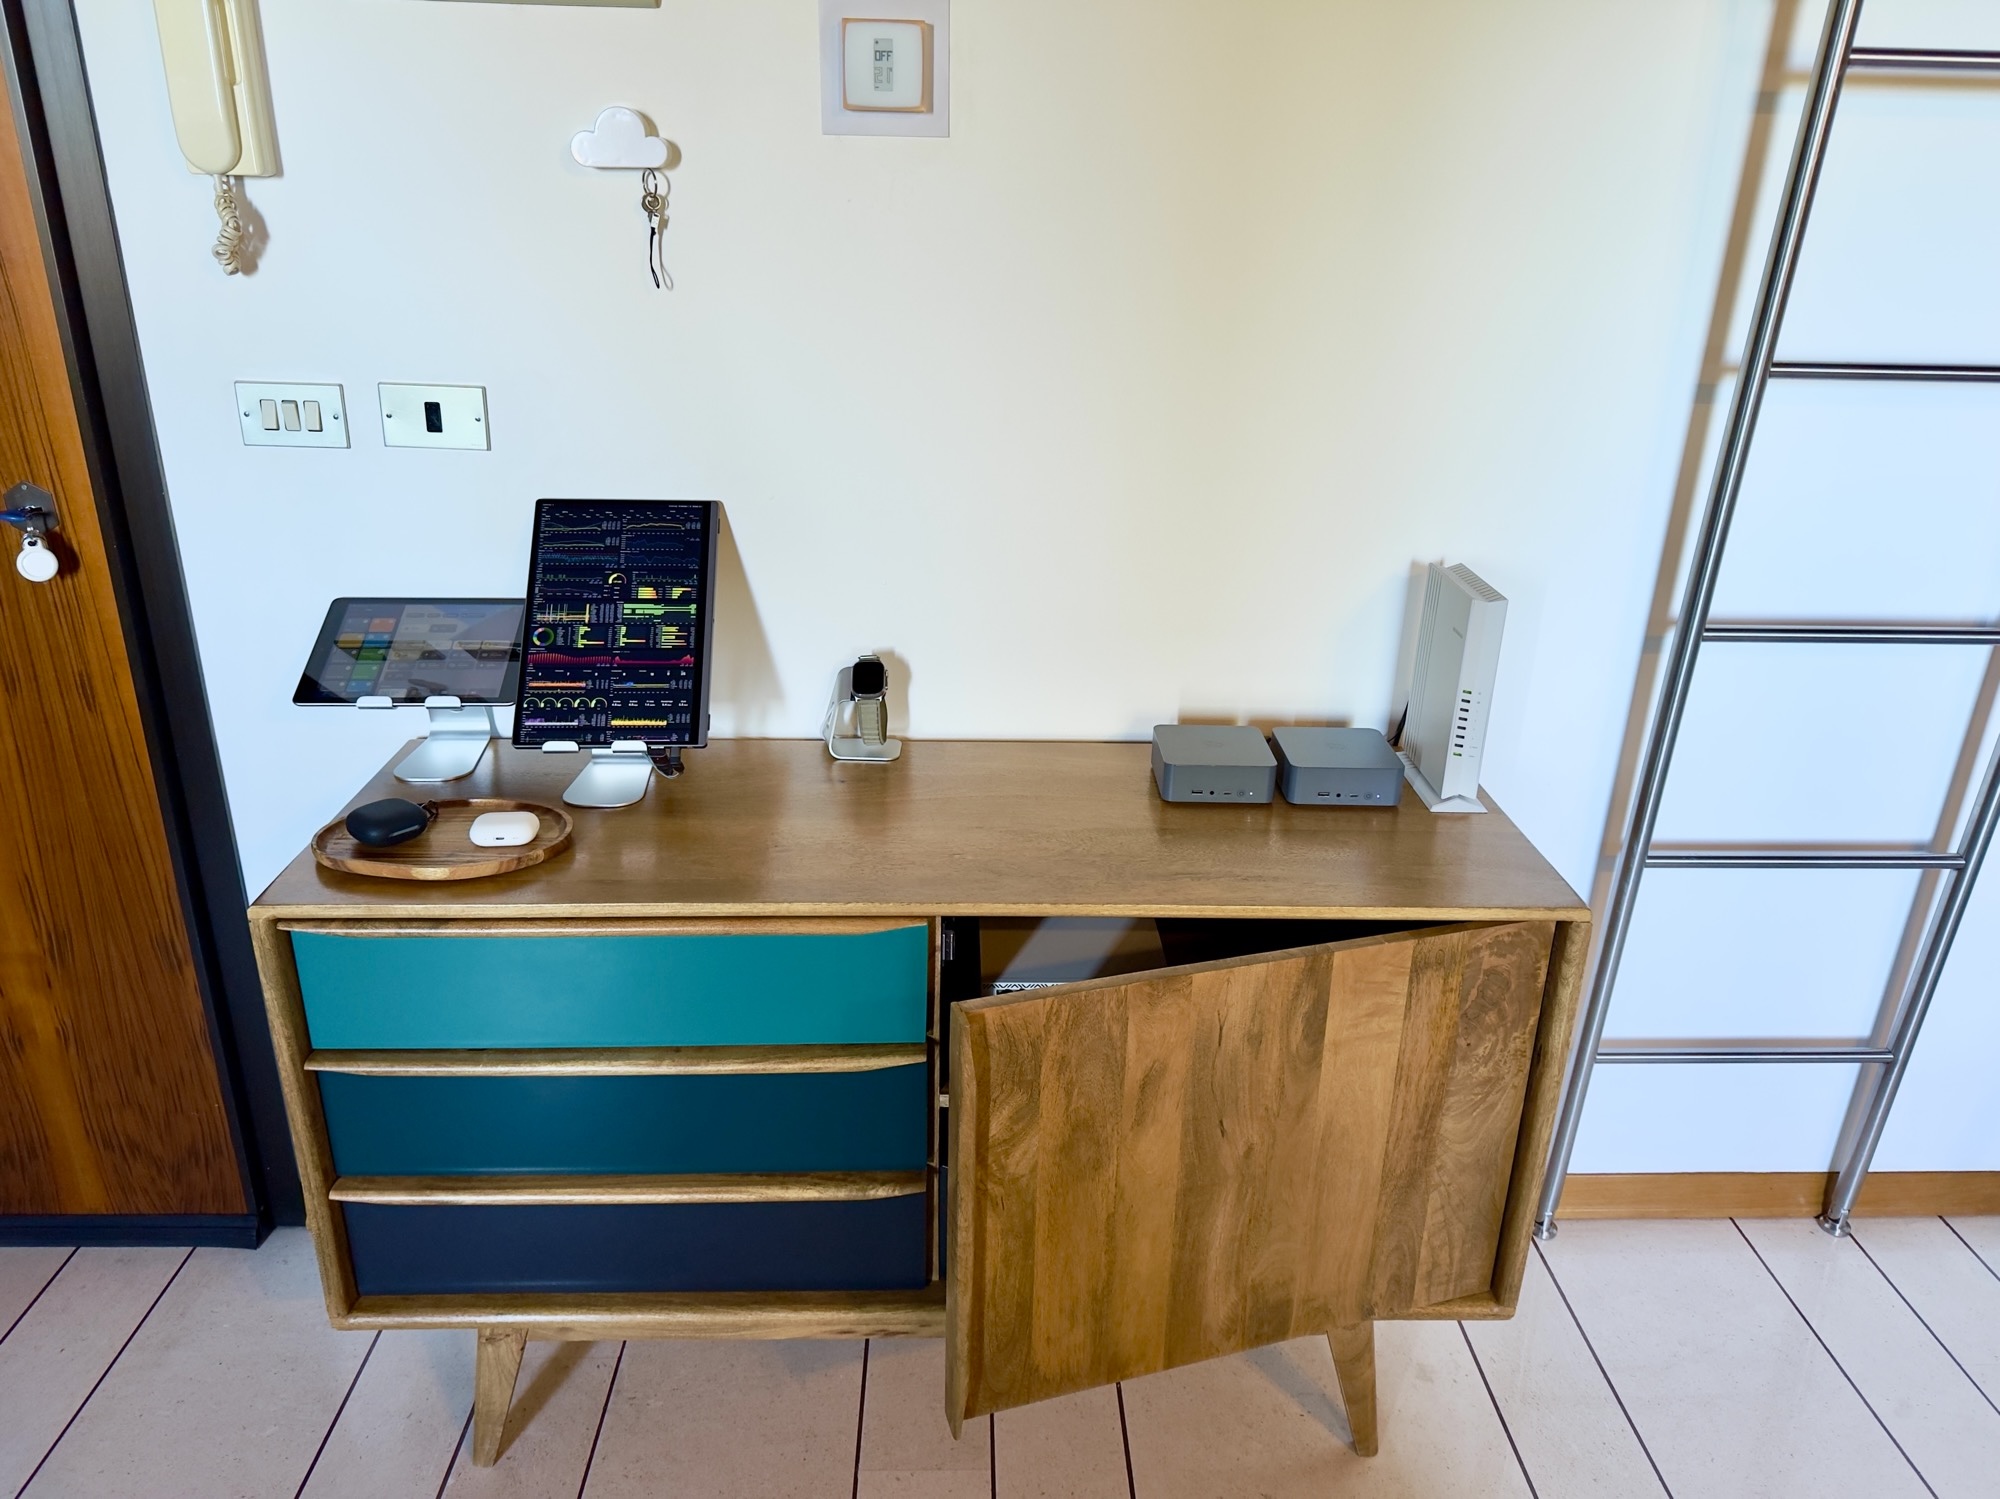
At the top, I’ve left only the access point, the Grafana server, the alArchive server, the iPad (which I use to control the house via HomeKit), and the touch display used to view Grafana main dashboard.
Inside the forniture, I reorganized the devices to make room for the new switch, which takes up quite a bit of space, so I placed the modem vertically.
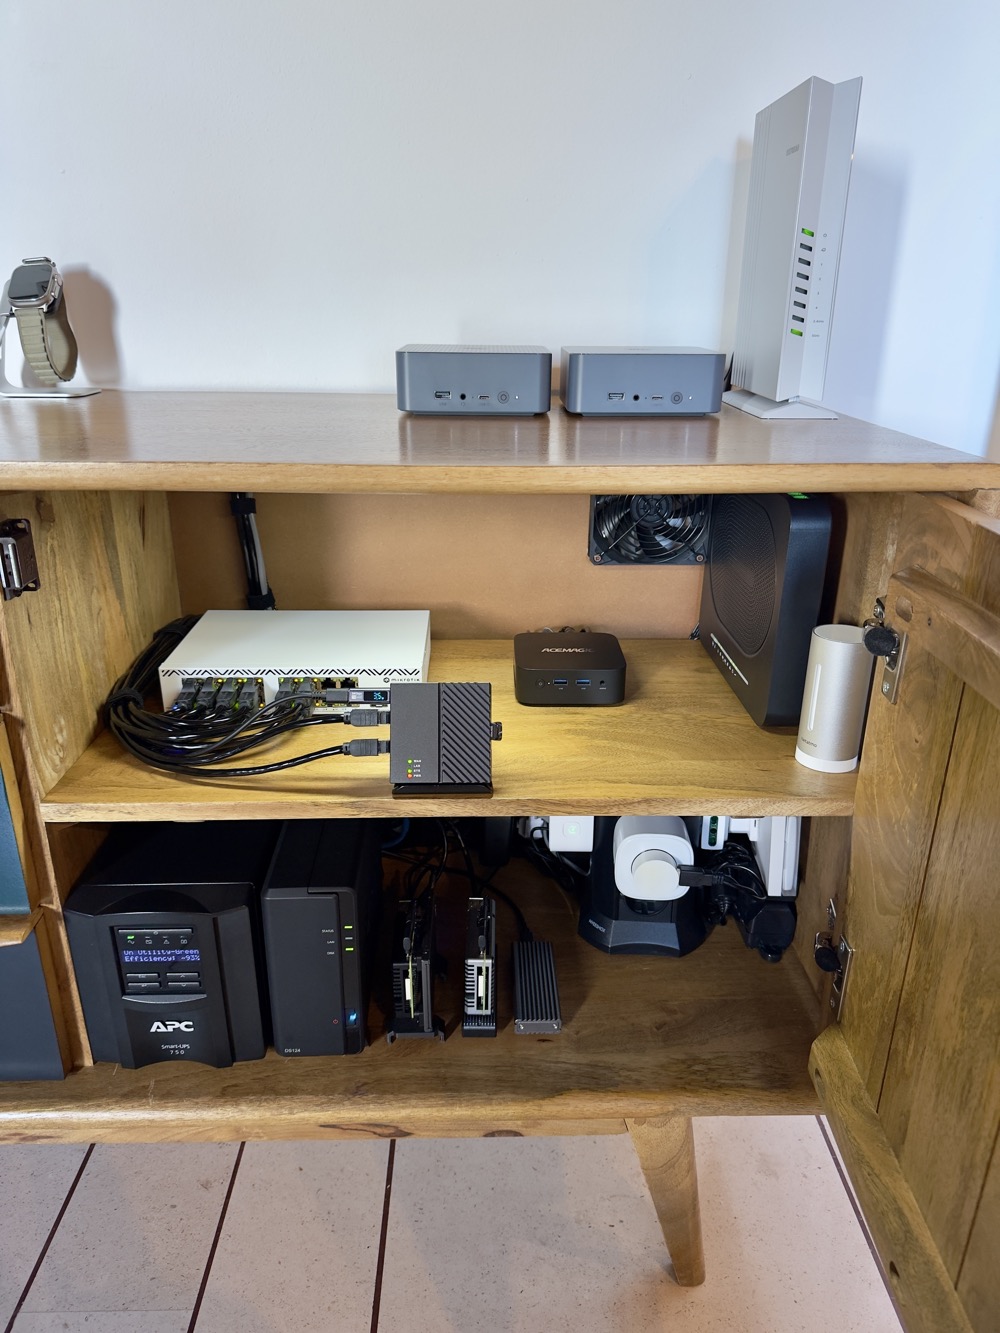
Below I added the new UPS and the two Raspberry Pi 4, which are running the Homebridge and Pi-hole servers (yes, I’ve removed the screen with PADD as I monitor all the relevant Pi-Hole data in Grafana)
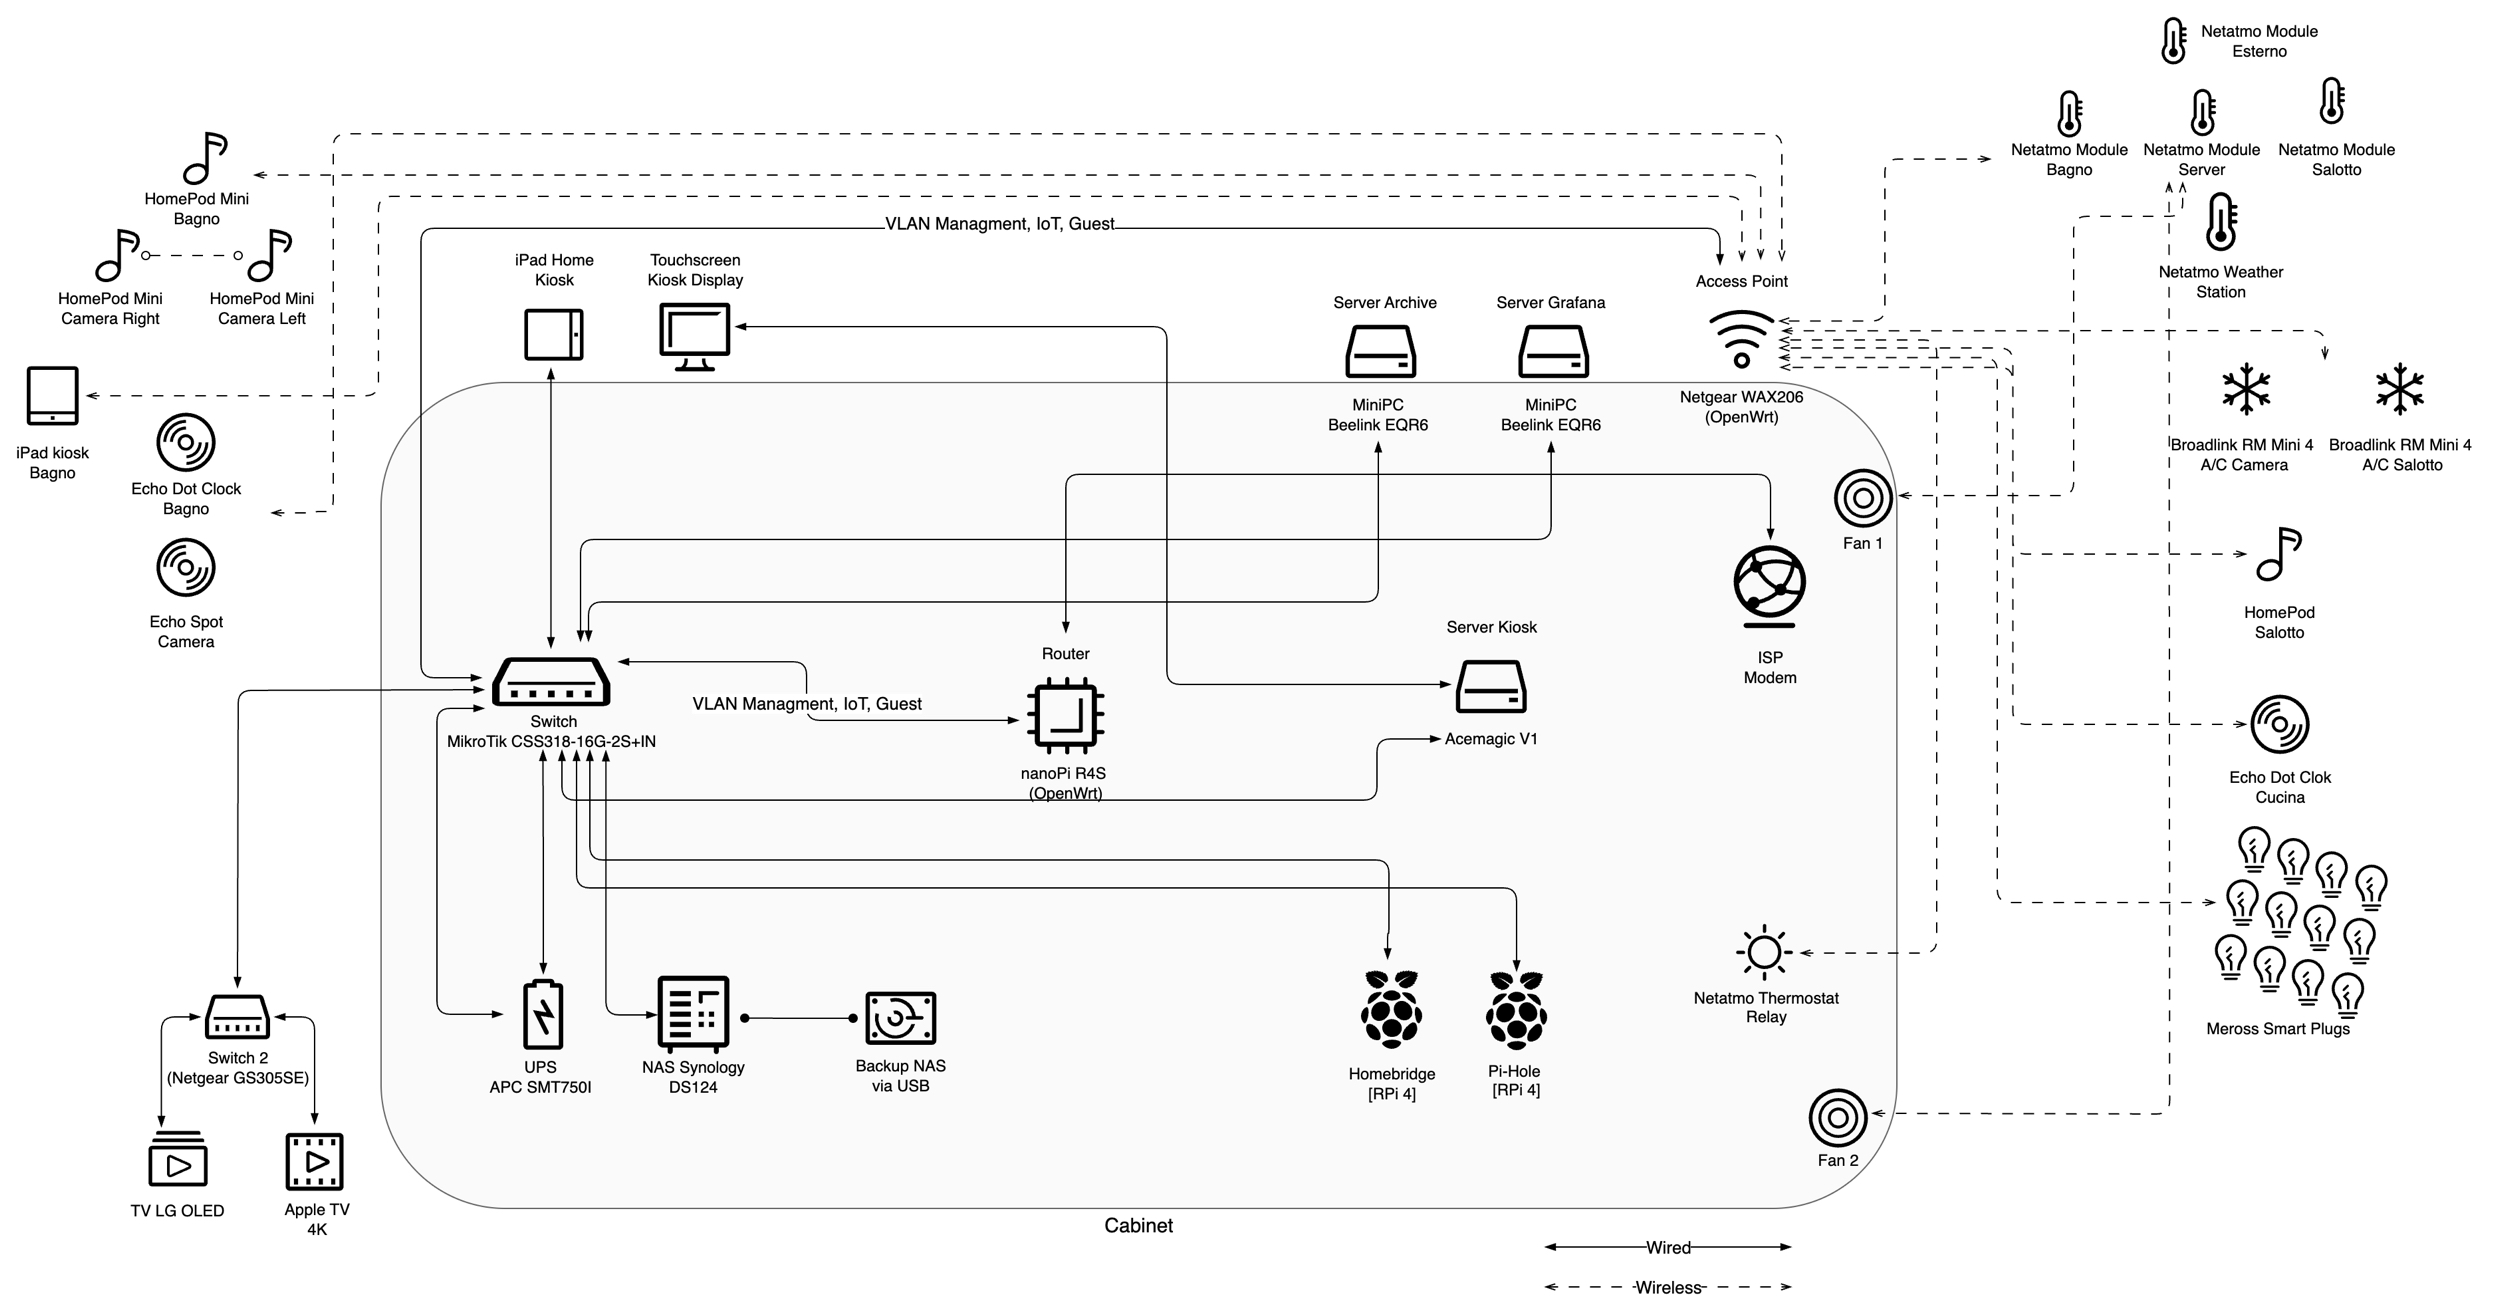
Network scheme
Here’s the network scheme to better understand everything in it:
MikroTik CSS318-16G-2S+IN switch
After nearly maxing out all the ports on the two 8 ports Netgear switches (with only one port left free, also because two ports were used for the trunk) I realized it was time for a new switch.
While looking for a model that wasn’t in the standard 19” rack format (too bulky for my cabinet, and I dislike wasting space with only 16 or 24 ports in a full-size chassis), I found the MikroTik CSS318-16G-2S+IN, which turned out to be perfect for my needs.
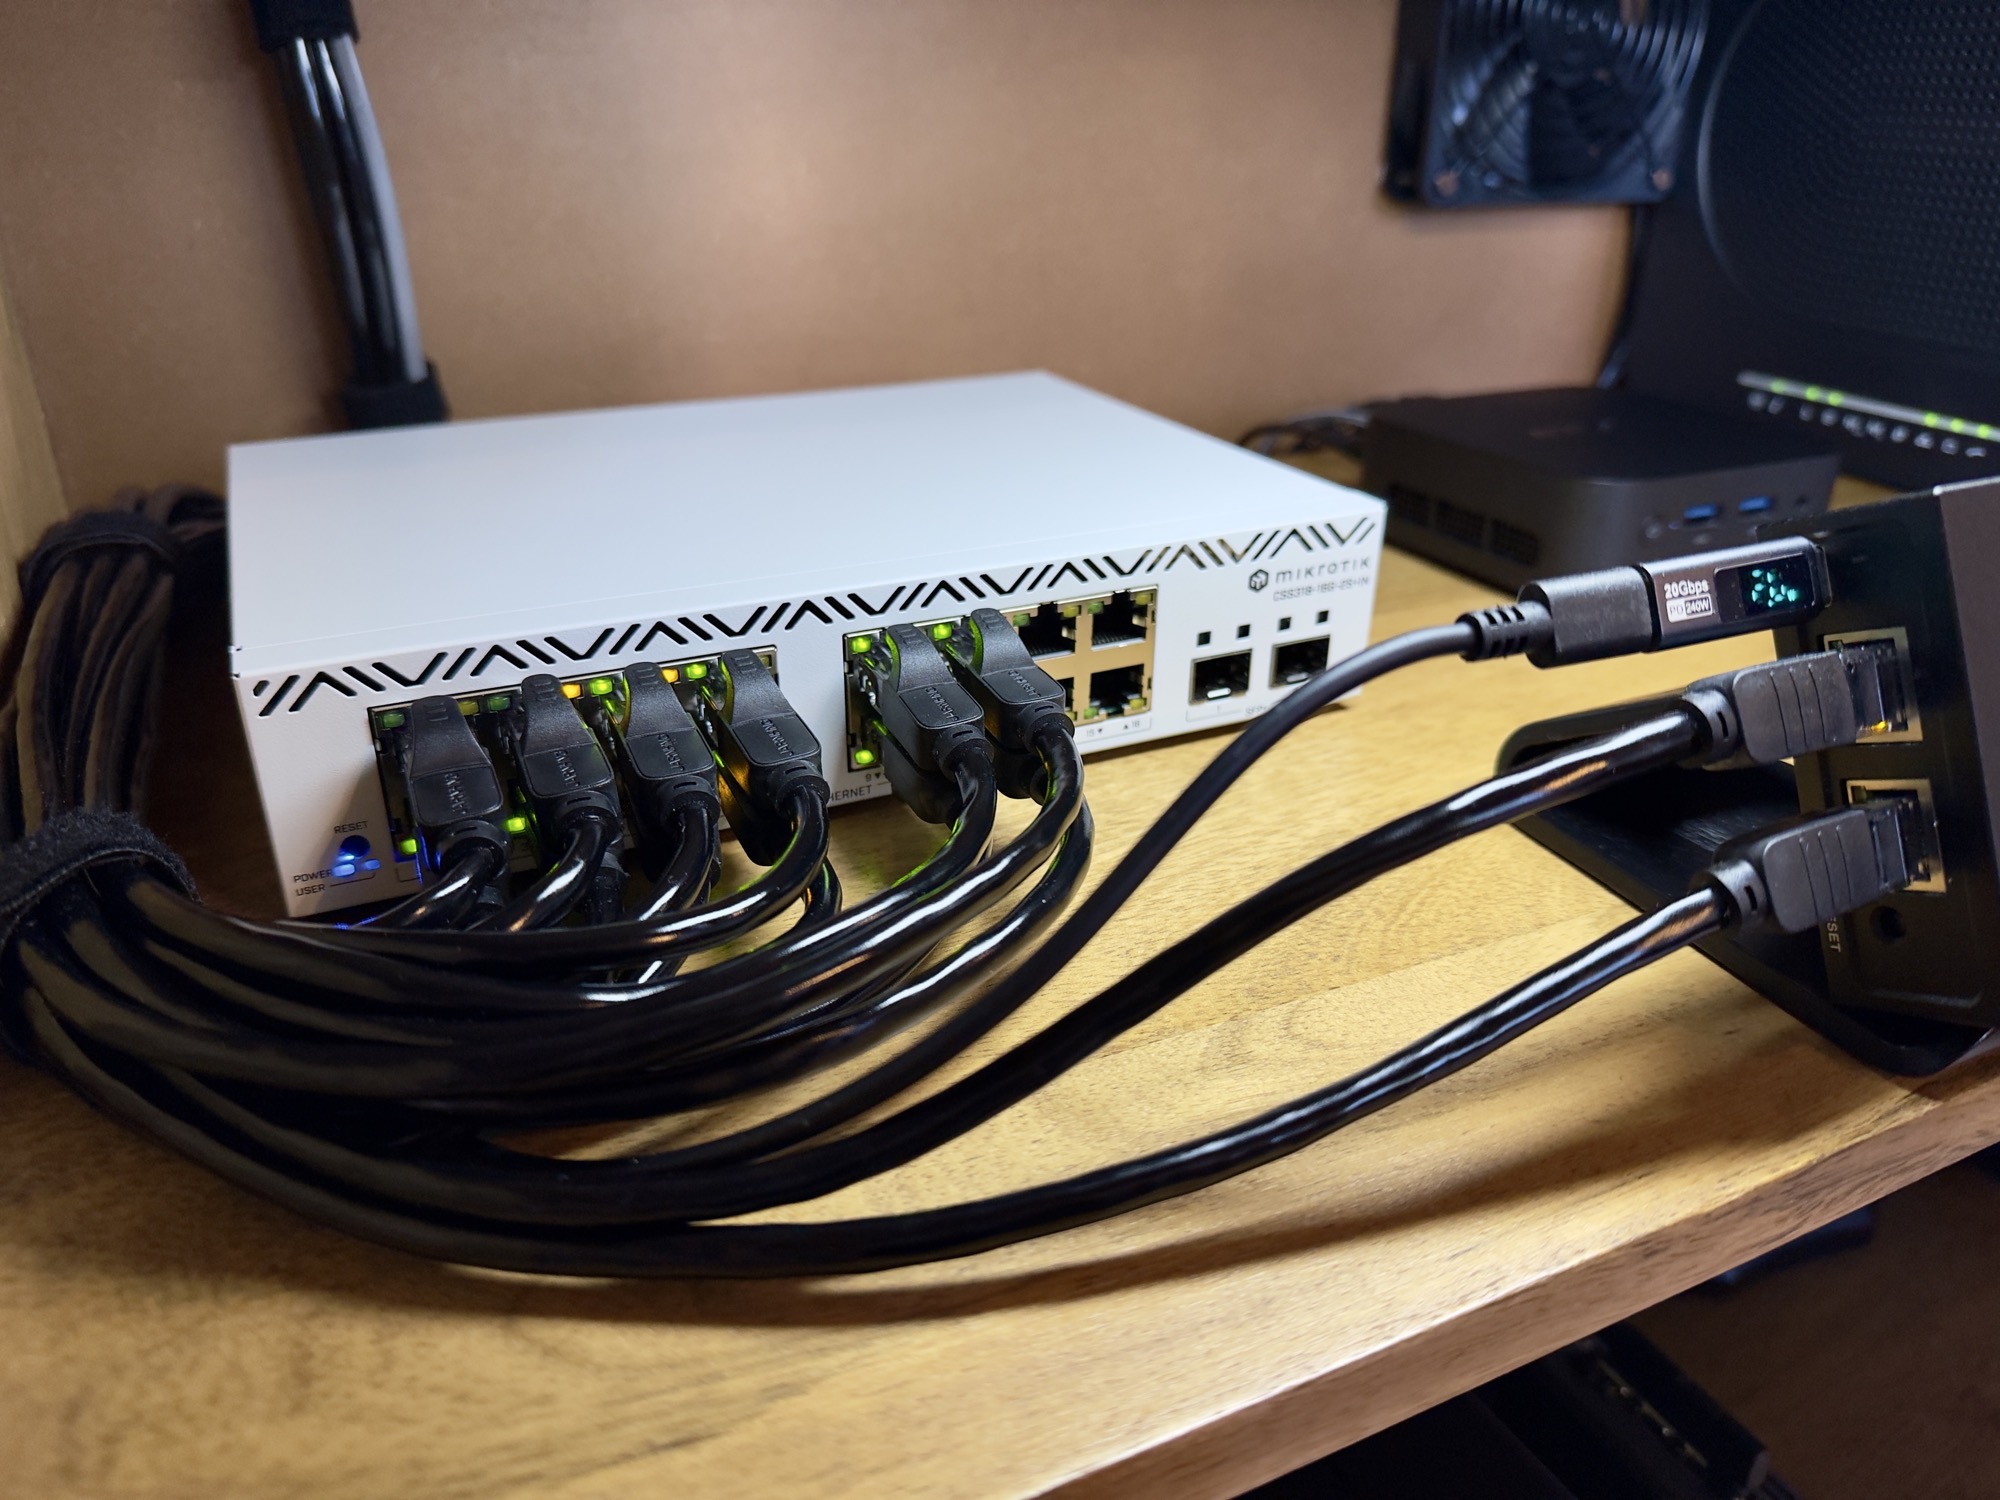
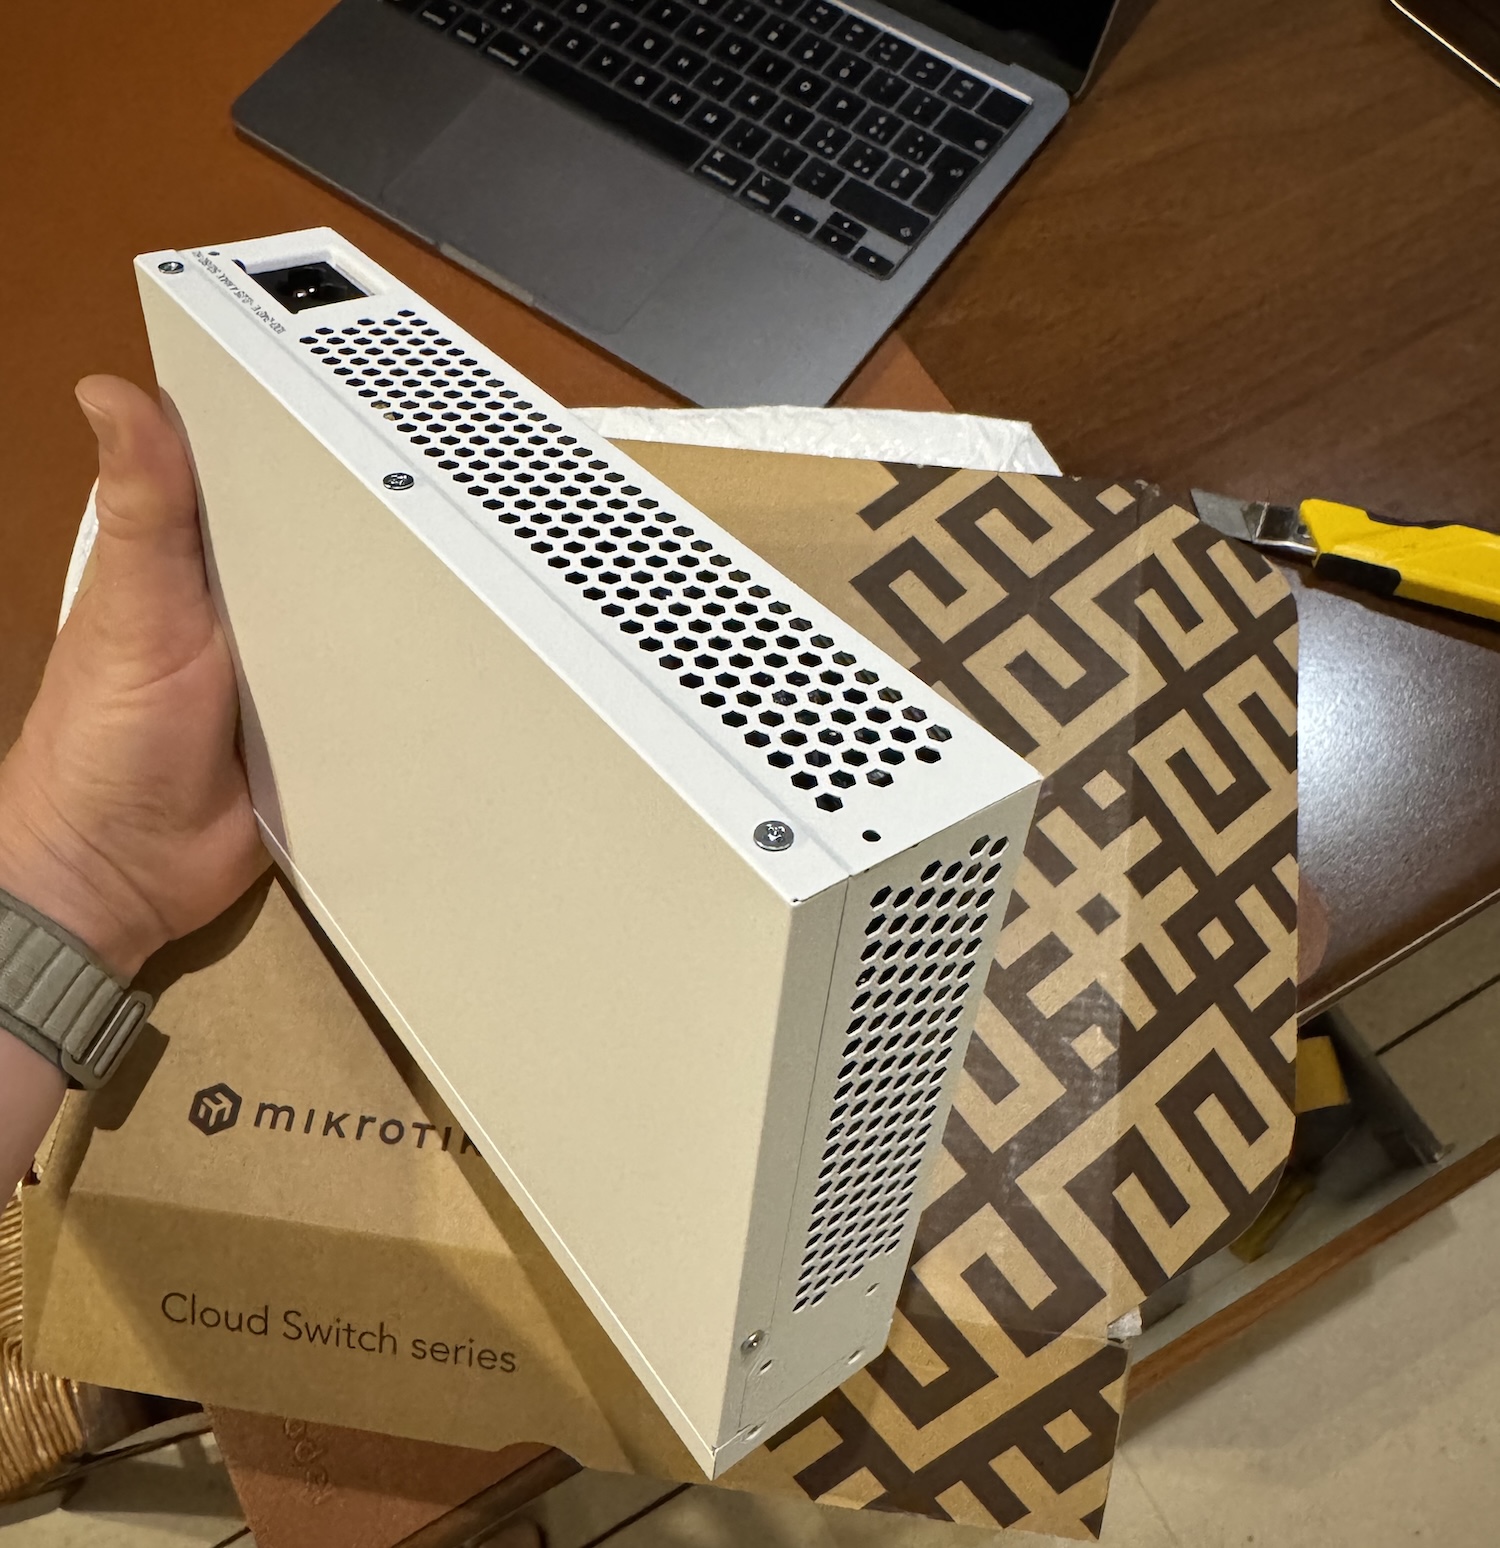
I usually don’t like MikroTik switches, I find their design aesthetically weird (honestly? Ugly), they’re fine in a 19” rack, but not really suitable for home environments like mine. That said, the MikroTik CSS318-16G-2S+IN is actually quite decent-looking in my opinion, even if I would have preferred it in black… white is acceptable and looks “different”.
This switch differs from the typical units based on Realtek MIPS SoCs, instead it uses a more performant Marvell Prestera 98DX2518 ASICS SoC. The downside is that is not compatible with OpenWrt and relies on SwOS, MikroTik’s operating system for Layer 2 switches.
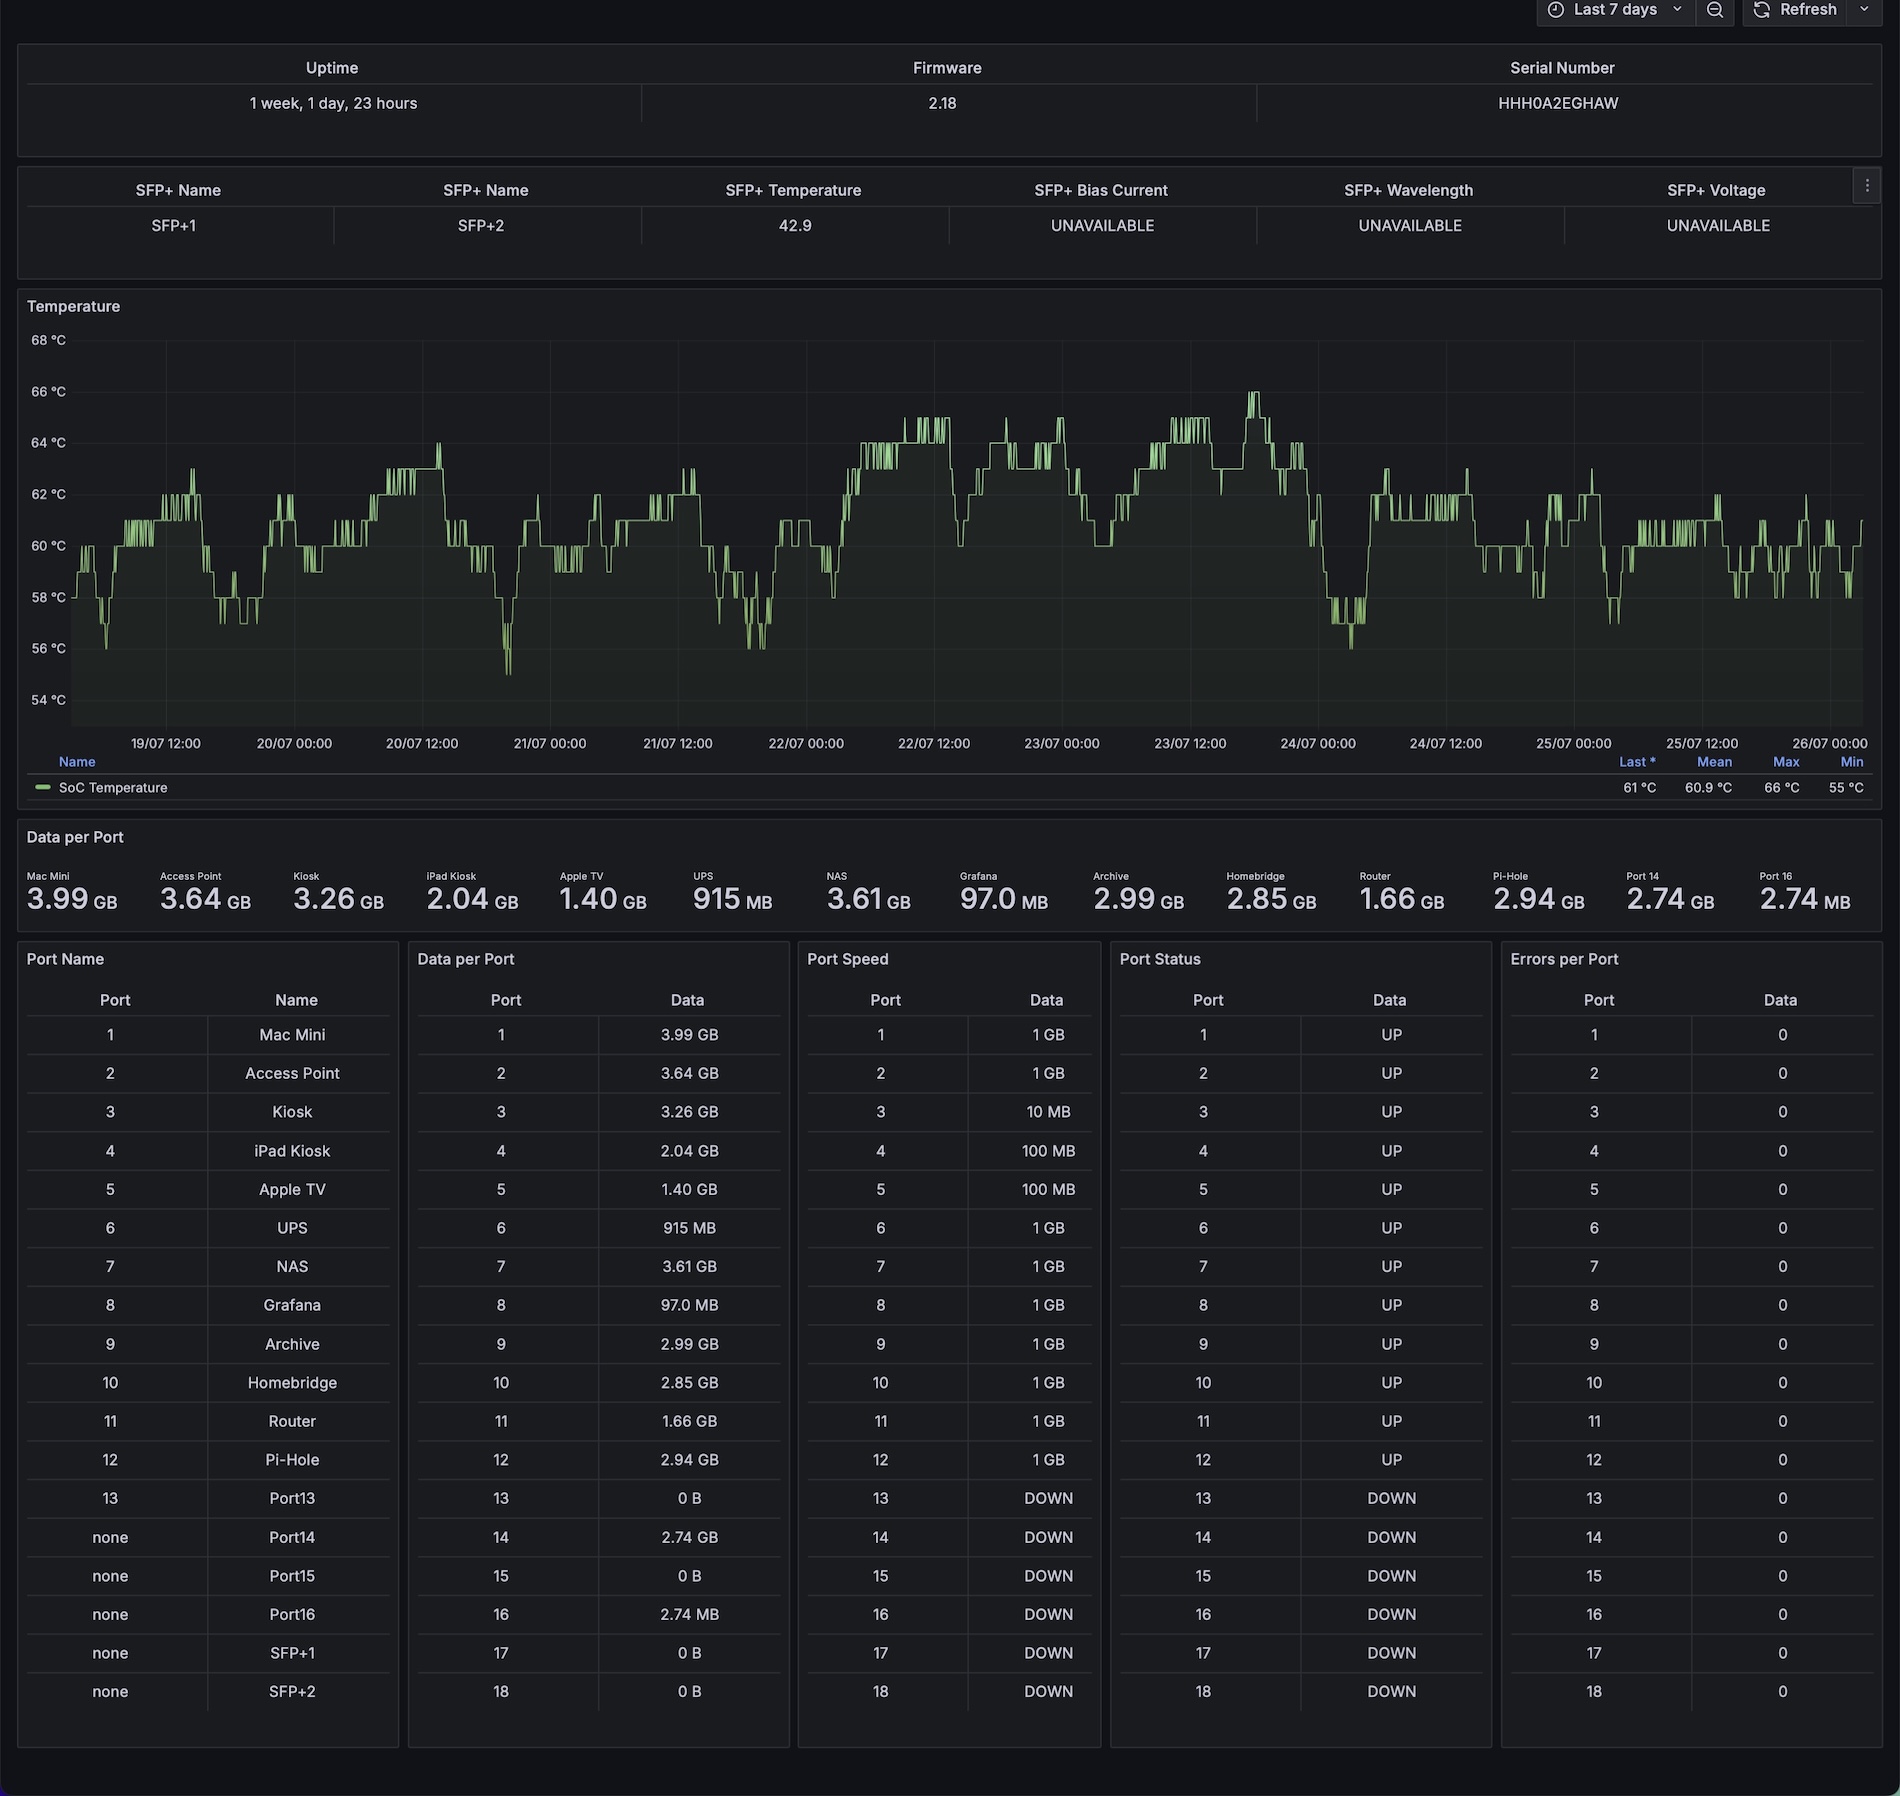
Using SwOS I configured everything: VLANs, port names, IGMP, and SNMP for Prometheus monitoring. Then I built a dedicated dashboard in Grafana to visualize the data.
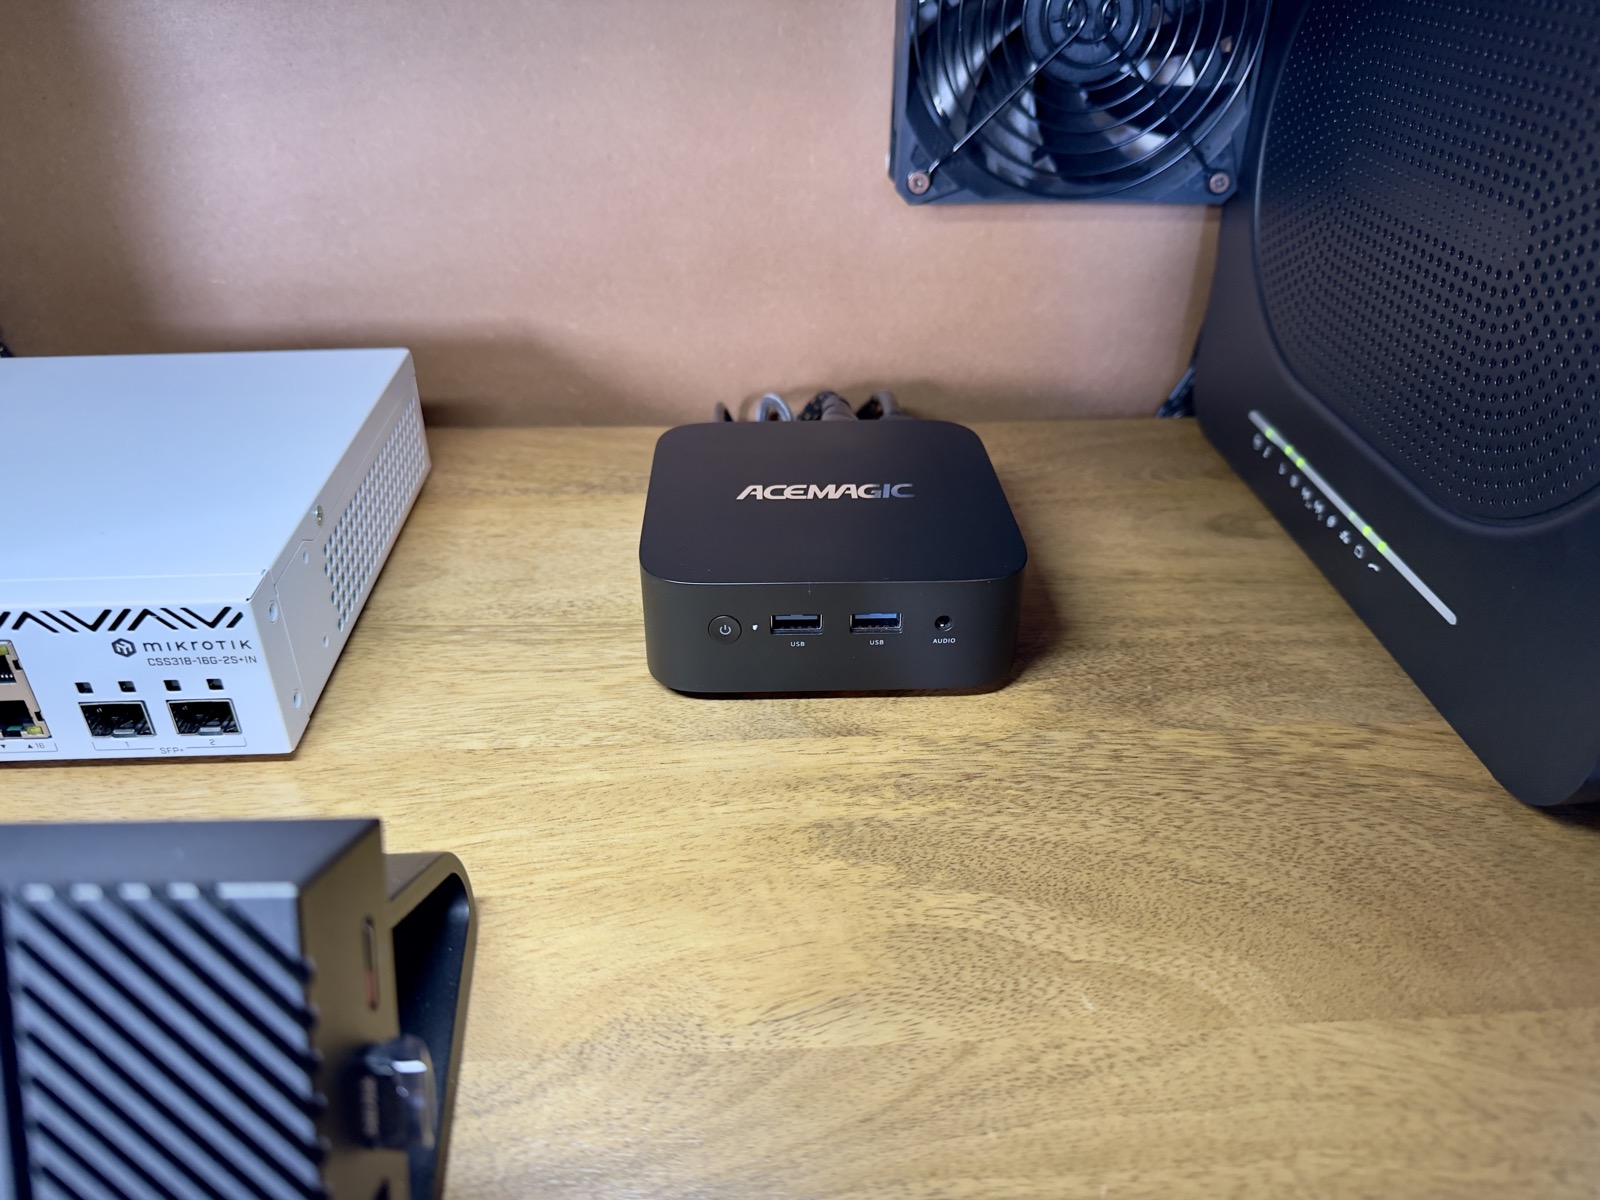
miniPC for the Grafana monitoring stack
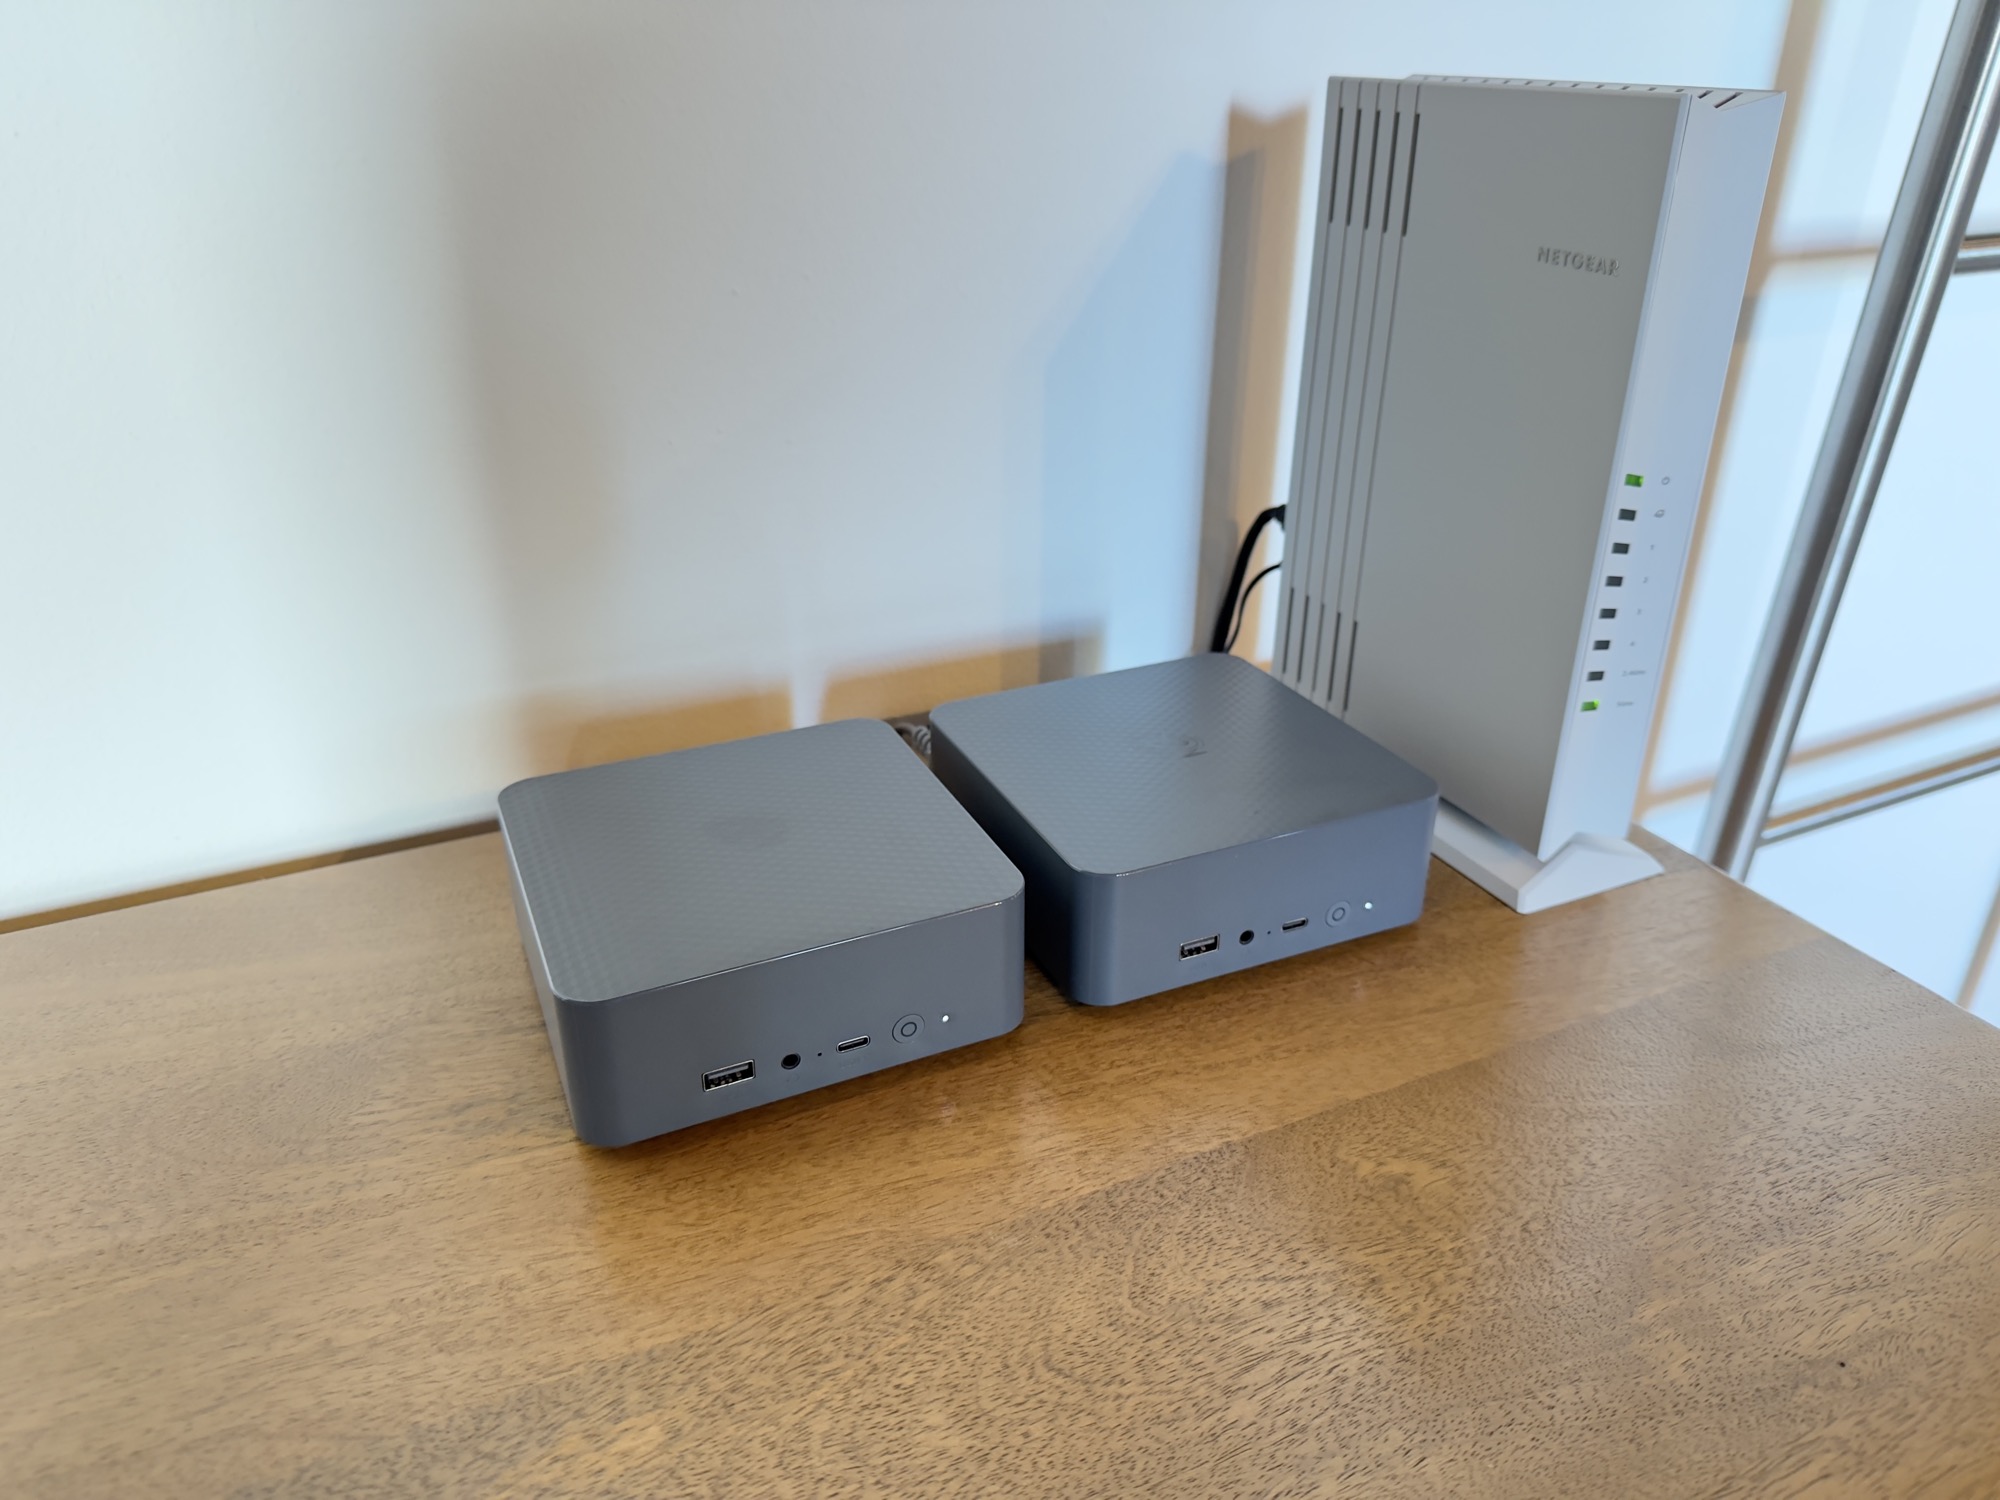
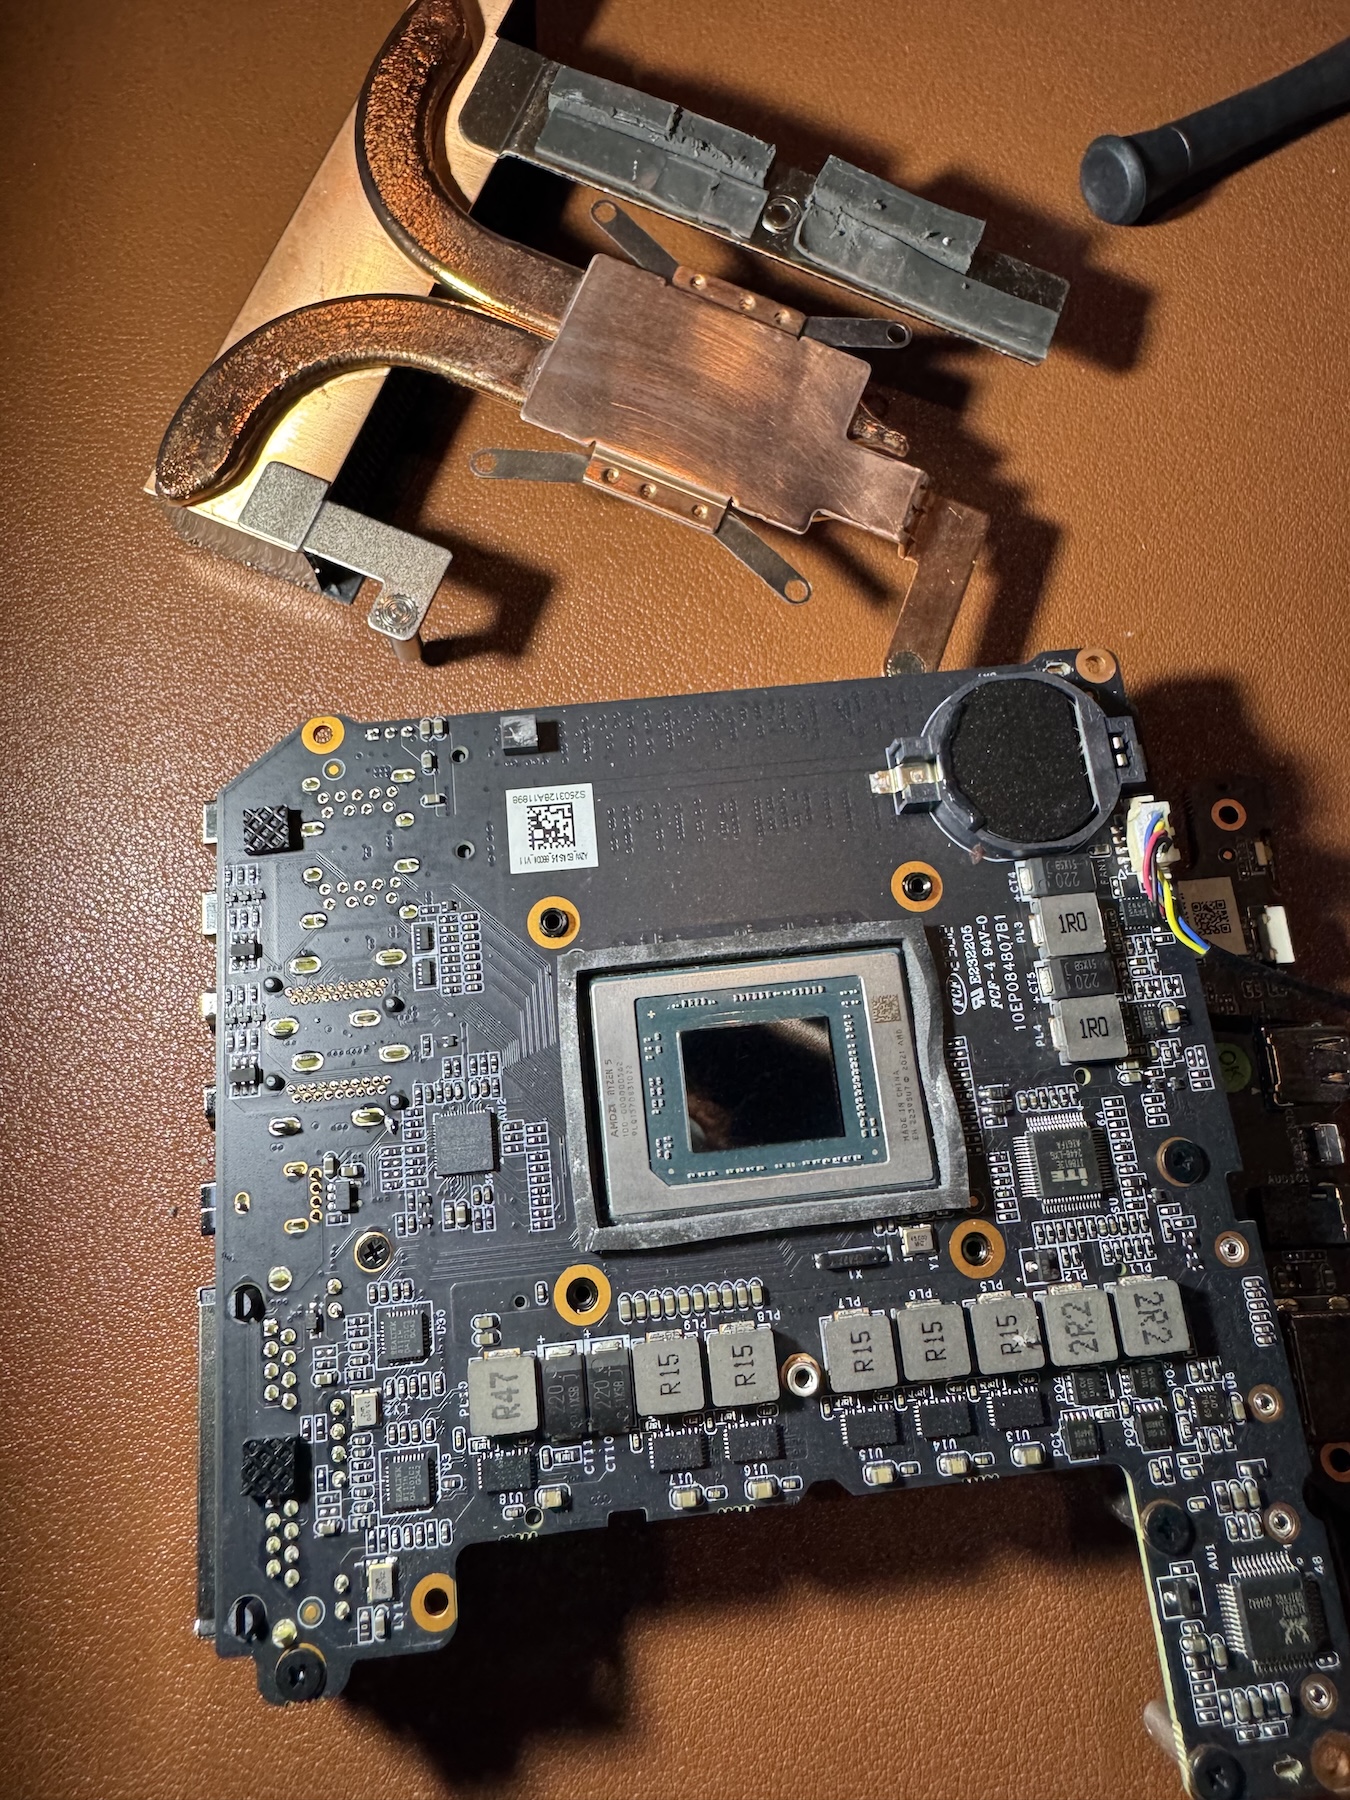
I switched from the Raspberry Pi 5 (8GB) to a Beelink EQR6 mini PC, equipped with an AMD Ryzen 6600H CPU (6 cores/12 threads) and 16GB of DDR5 RAM in dual channel
I’ve been using it for a couple of months, and it works great, even though it’s way more powerful than necessary for my monitoring stack, which includes Grafana, Prometheus, Mimir, Loki, Promtail, and several Prometheus exporters. Especially when running a very efficient OS like Alpine Linux. But since I enjoy optimizing things, I’m definitely satisfied.
As soon as it arrived, I replaced the thermal paste, lapped the heat sink, tweaked the BIOS, and disabled unused features like GPU, audio, Wi-Fi, Bluetooth, etc.. Now it runs at around 9/10W of consumption, which I consider a very good result.
For all the details, check out the post I wrote with every technical detail about the switch from the Raspberry Pi 5 to this Alpine Linux mini PC: Grafana on a new miniPC
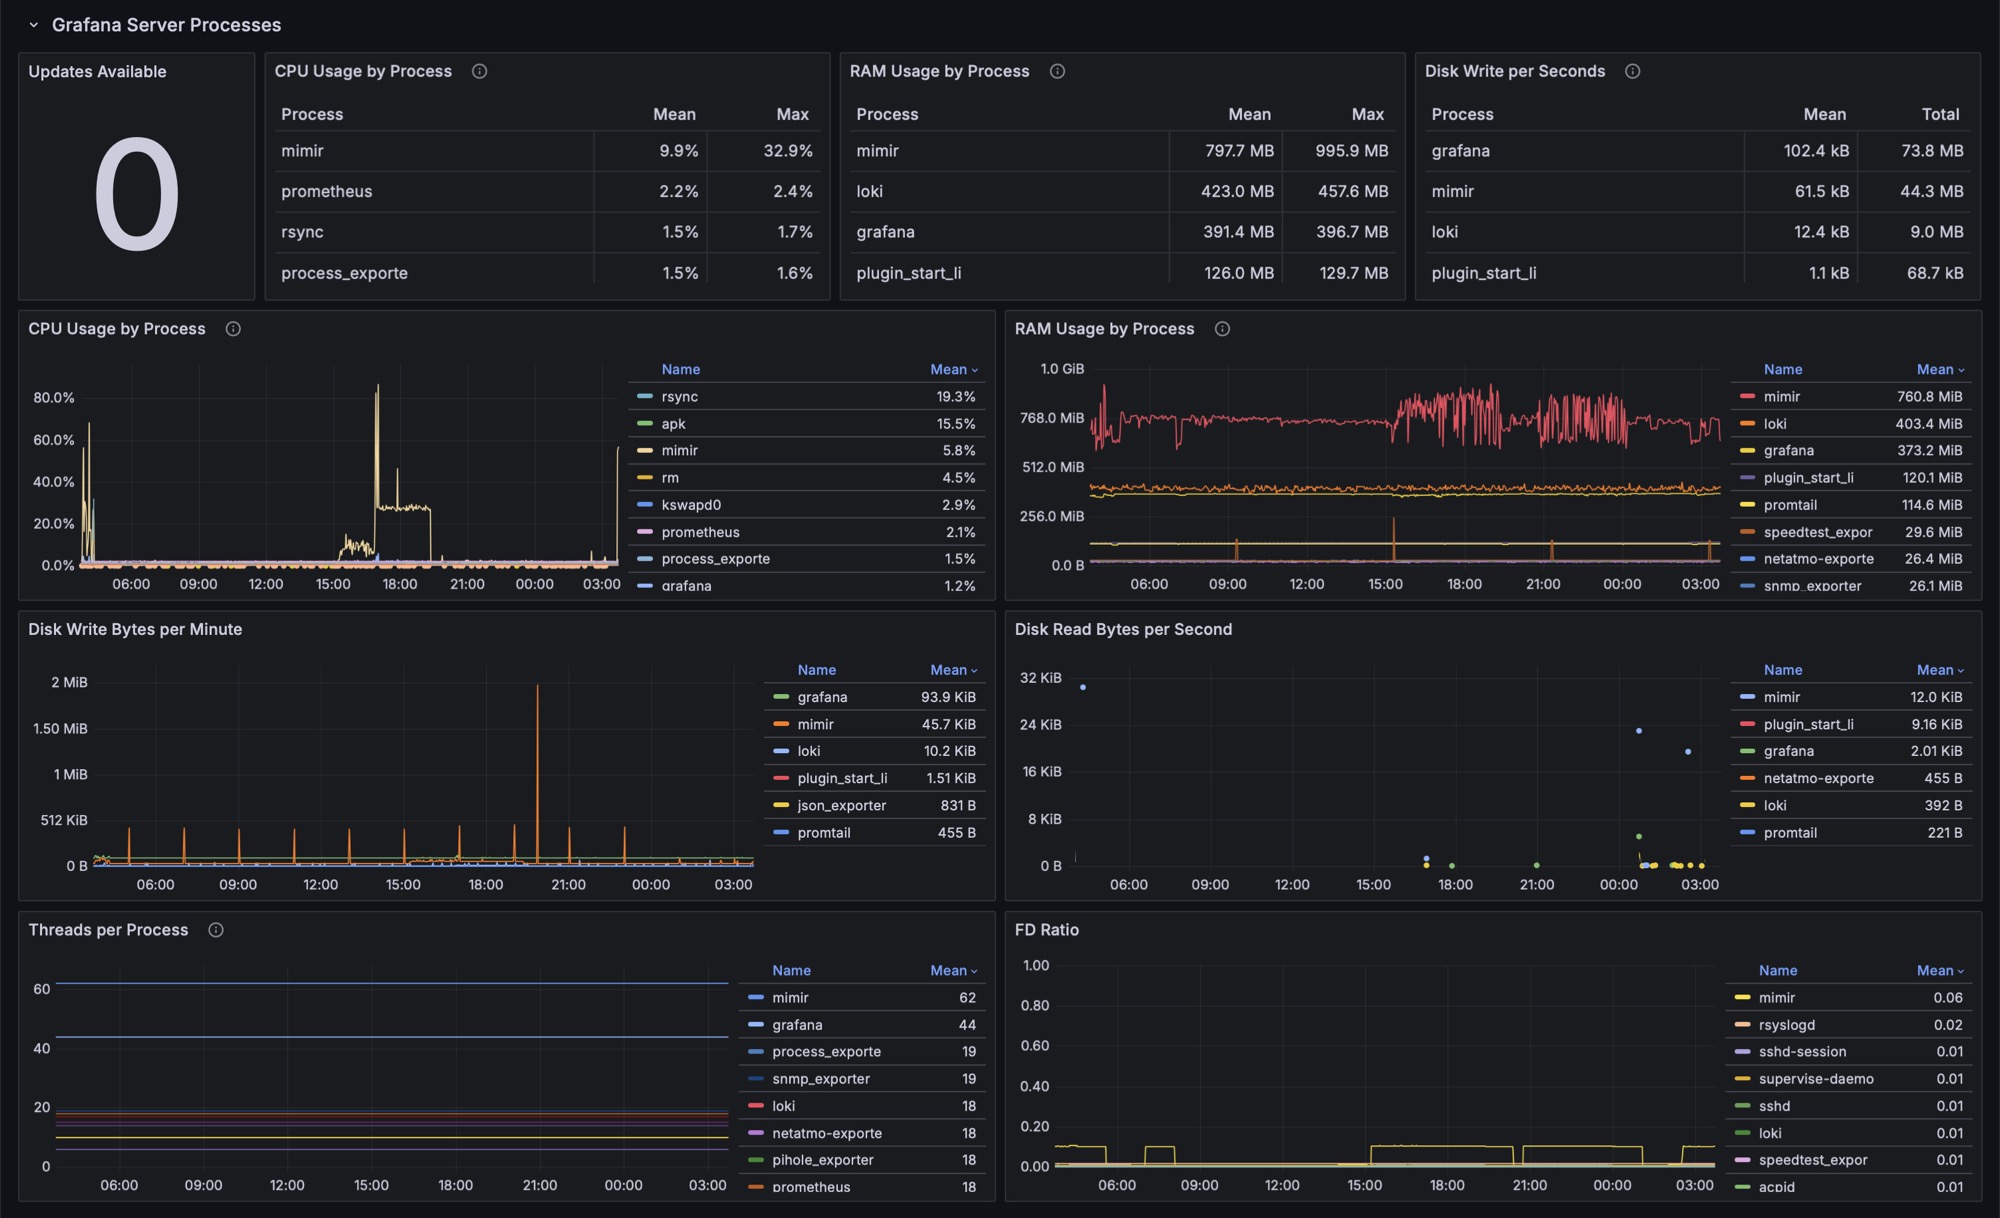
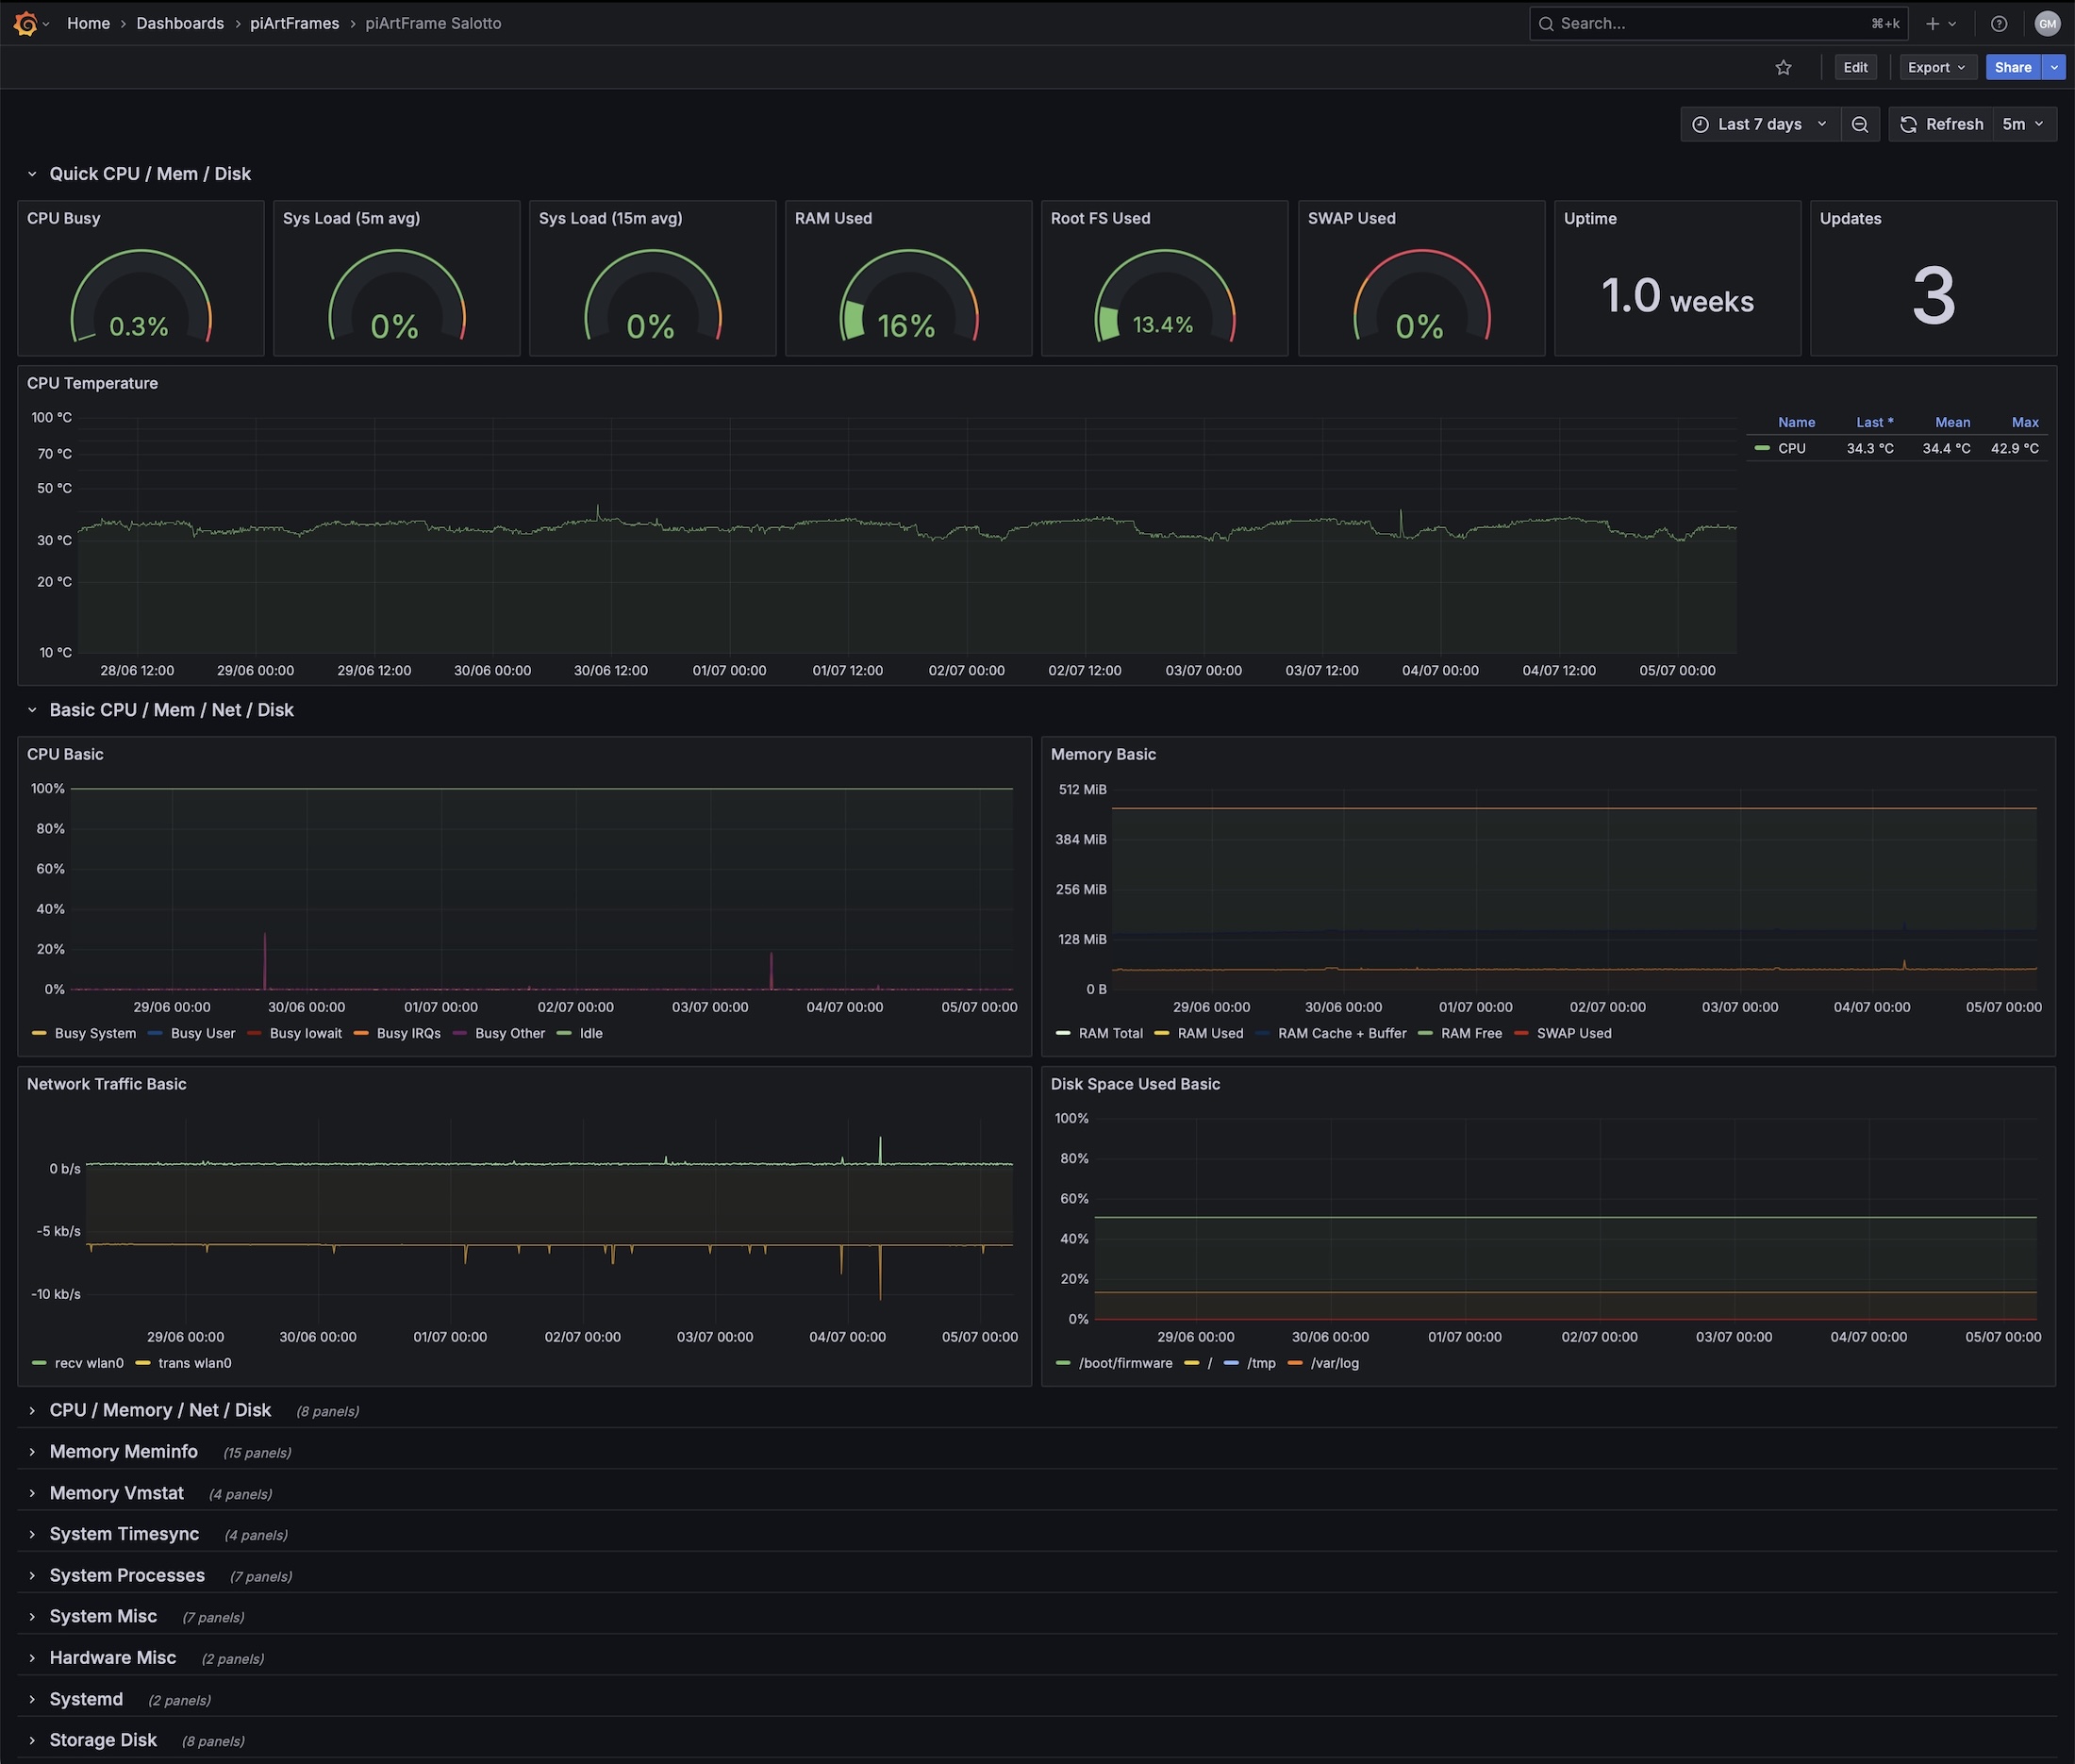
And a 24h process dashbord for the Grafana server:
Kiosk miniPC with a new 4K 13,4” touch display
I replaced the Raspberry Pi 4, which I was using as a kiosk to display and navigate Grafana dashboard, with an Intel N150 mini PC, as the Pi had become too slow, especially when scrolling with the touchscreen.
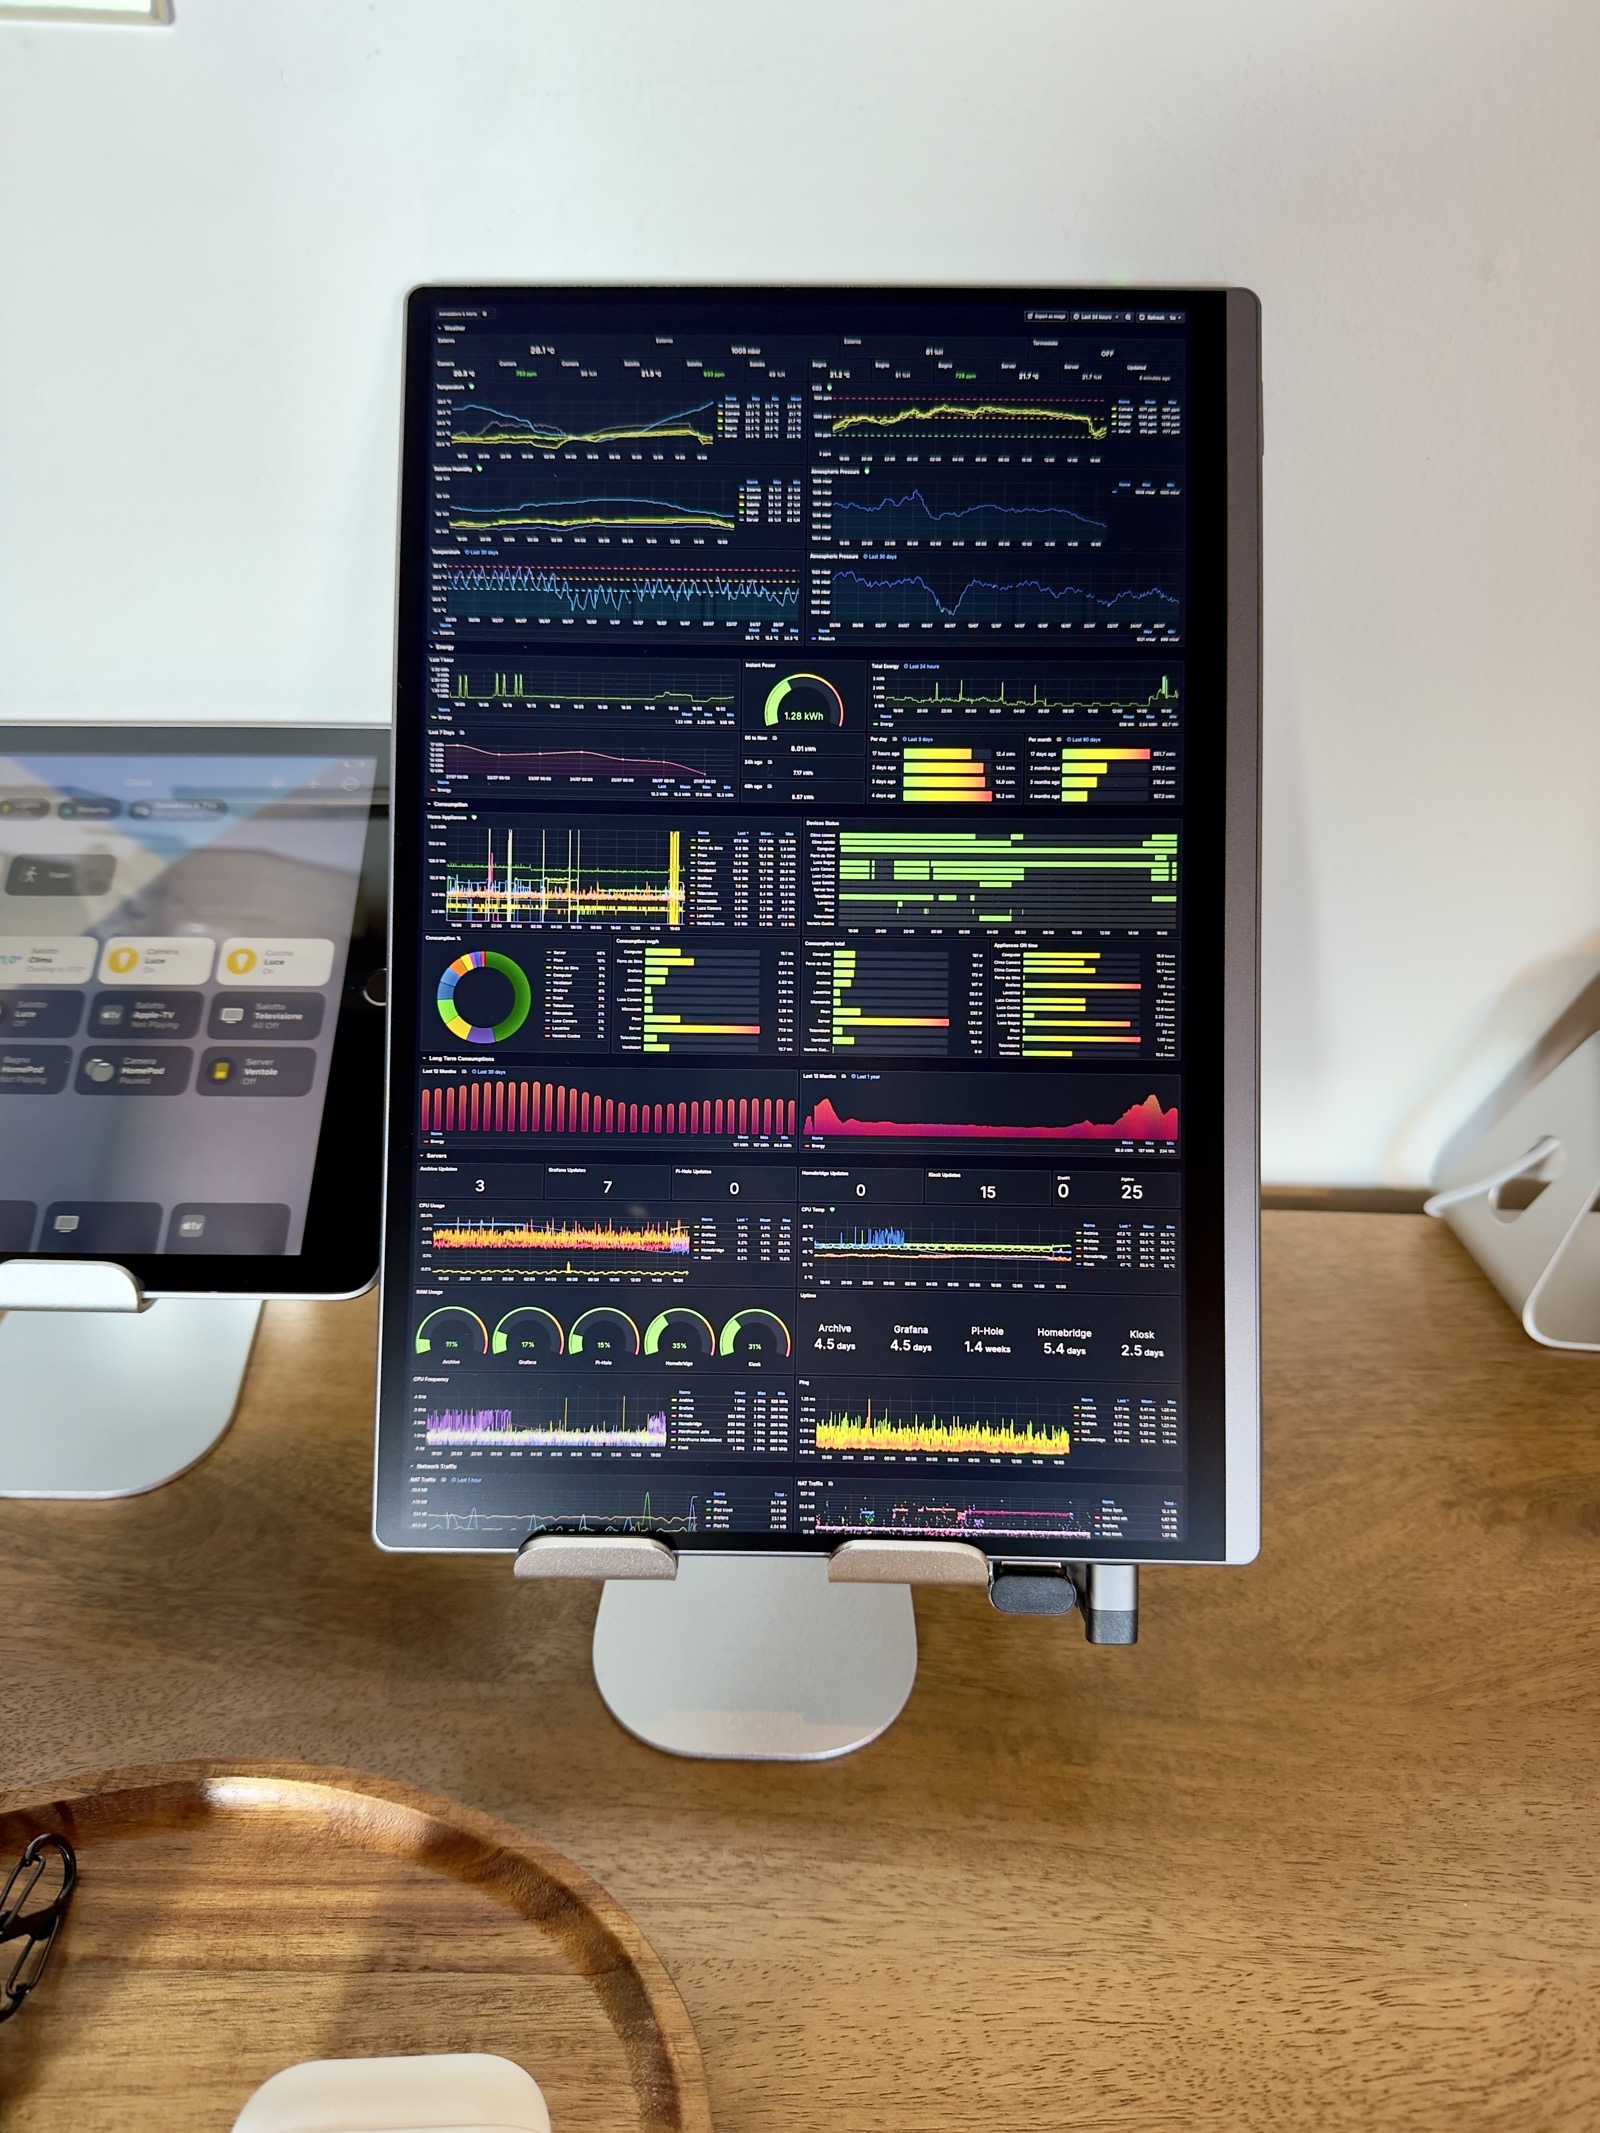
I also bought a 13,4” 4K touchscreen display (for 170€) to show the main Grafana dashboard… and it turned out to be excellent
I wrote a dedicated post with all the details which you can read here: New kiosk miniPC.
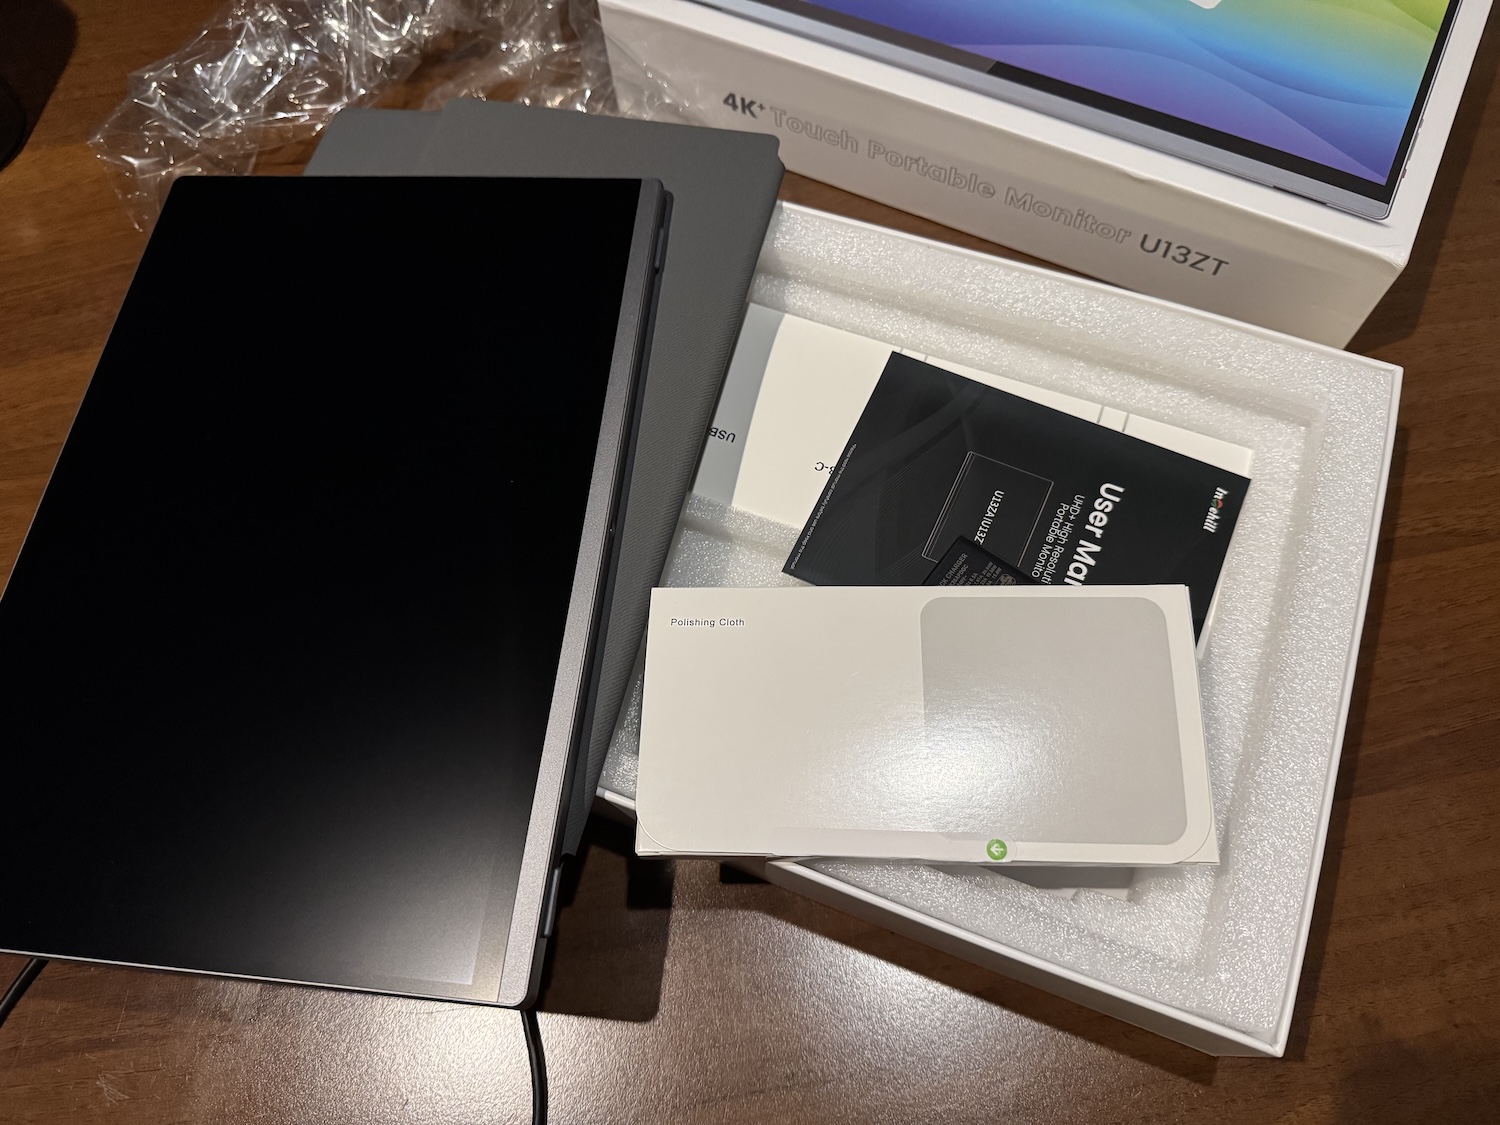
4K 13,4” touch display
The Amazon link is: Intehill 4K Monitor Touchscreen 13.4 Inches. I was genuinely surprised by the quality of the display and its accessories (for 170€).
The box includes a foldable case similar to the iPad “Folio” cover, 4–5 different cables, and even a polishing cloth (basically an Apple-style unboxing experience). The display itself is entirely made of aluminum and offers excellent color accuracy and sharpness, thanks to its 338 PPI resolution.

To install it properly in Sway I used the following parameters:
output HDMI-A-1 transform 90

input "10182:1321:WingCool_Inc._TouchScreen" {
    map_to_output HDMI-A-1
    calibration_matrix 1 0 0 0 -1 1
    natural_scroll enabled
}
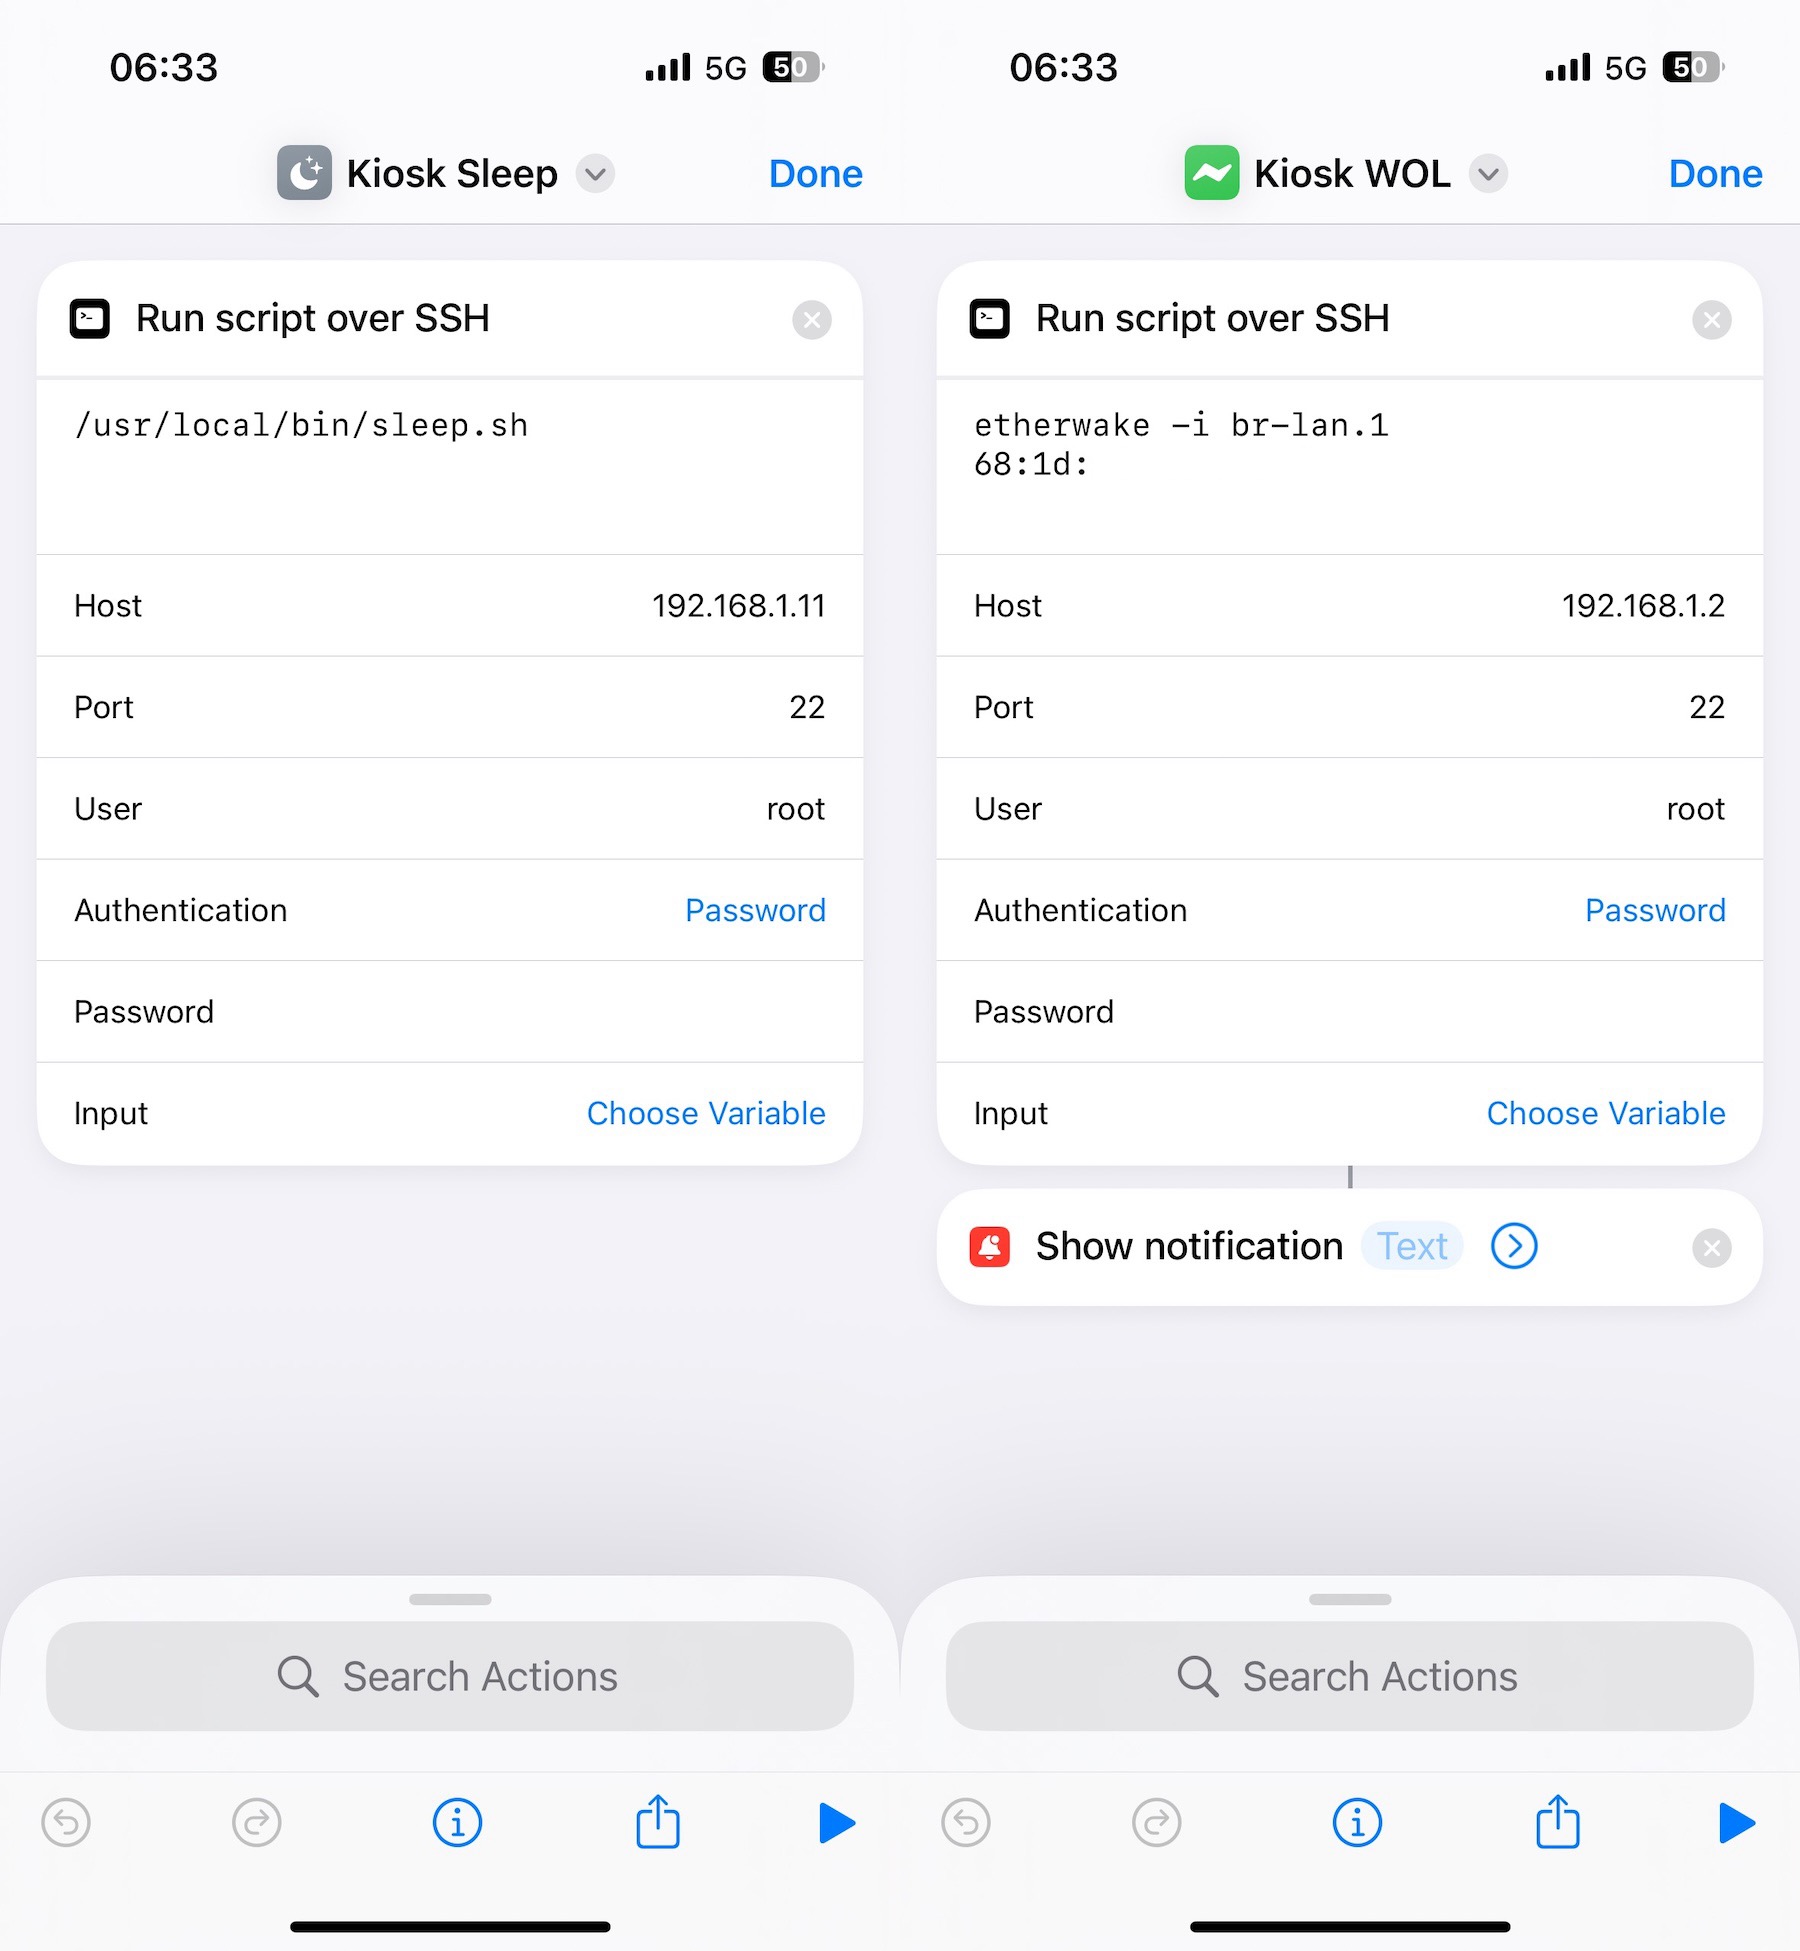
Wake On Lan it
At some point, I thought: “Why not use Wake on LAN?” It would be much more convenient: no need to power it off completely. So I configured it to go to sleep using this shortcut:
#!/bin/sh
ethtool -s eth0 wol g
echo enabled > /sys/class/net/eth0/device/power/wakeup
nohup sh -c 'sleep 2 && echo mem > /sys/power/state' >/dev/null 2>&1 &
To wake it up, I use etherwake on the NanoPi R4S that works also over WireGuard:
Archive miniPC for Paperless, Immich, n8n and Linkding
After using two Raspberry Pi 5 (8GB) as servers for a few months, one running Immich and the other hosting Paperless and Linkding, I decided to consolidate everything into a single machine. So I started looking for a low-power mini PC that was also affordable.
After some research… I ended up buying the almost the same Beelink mini PC I’m already using as Grafana server.
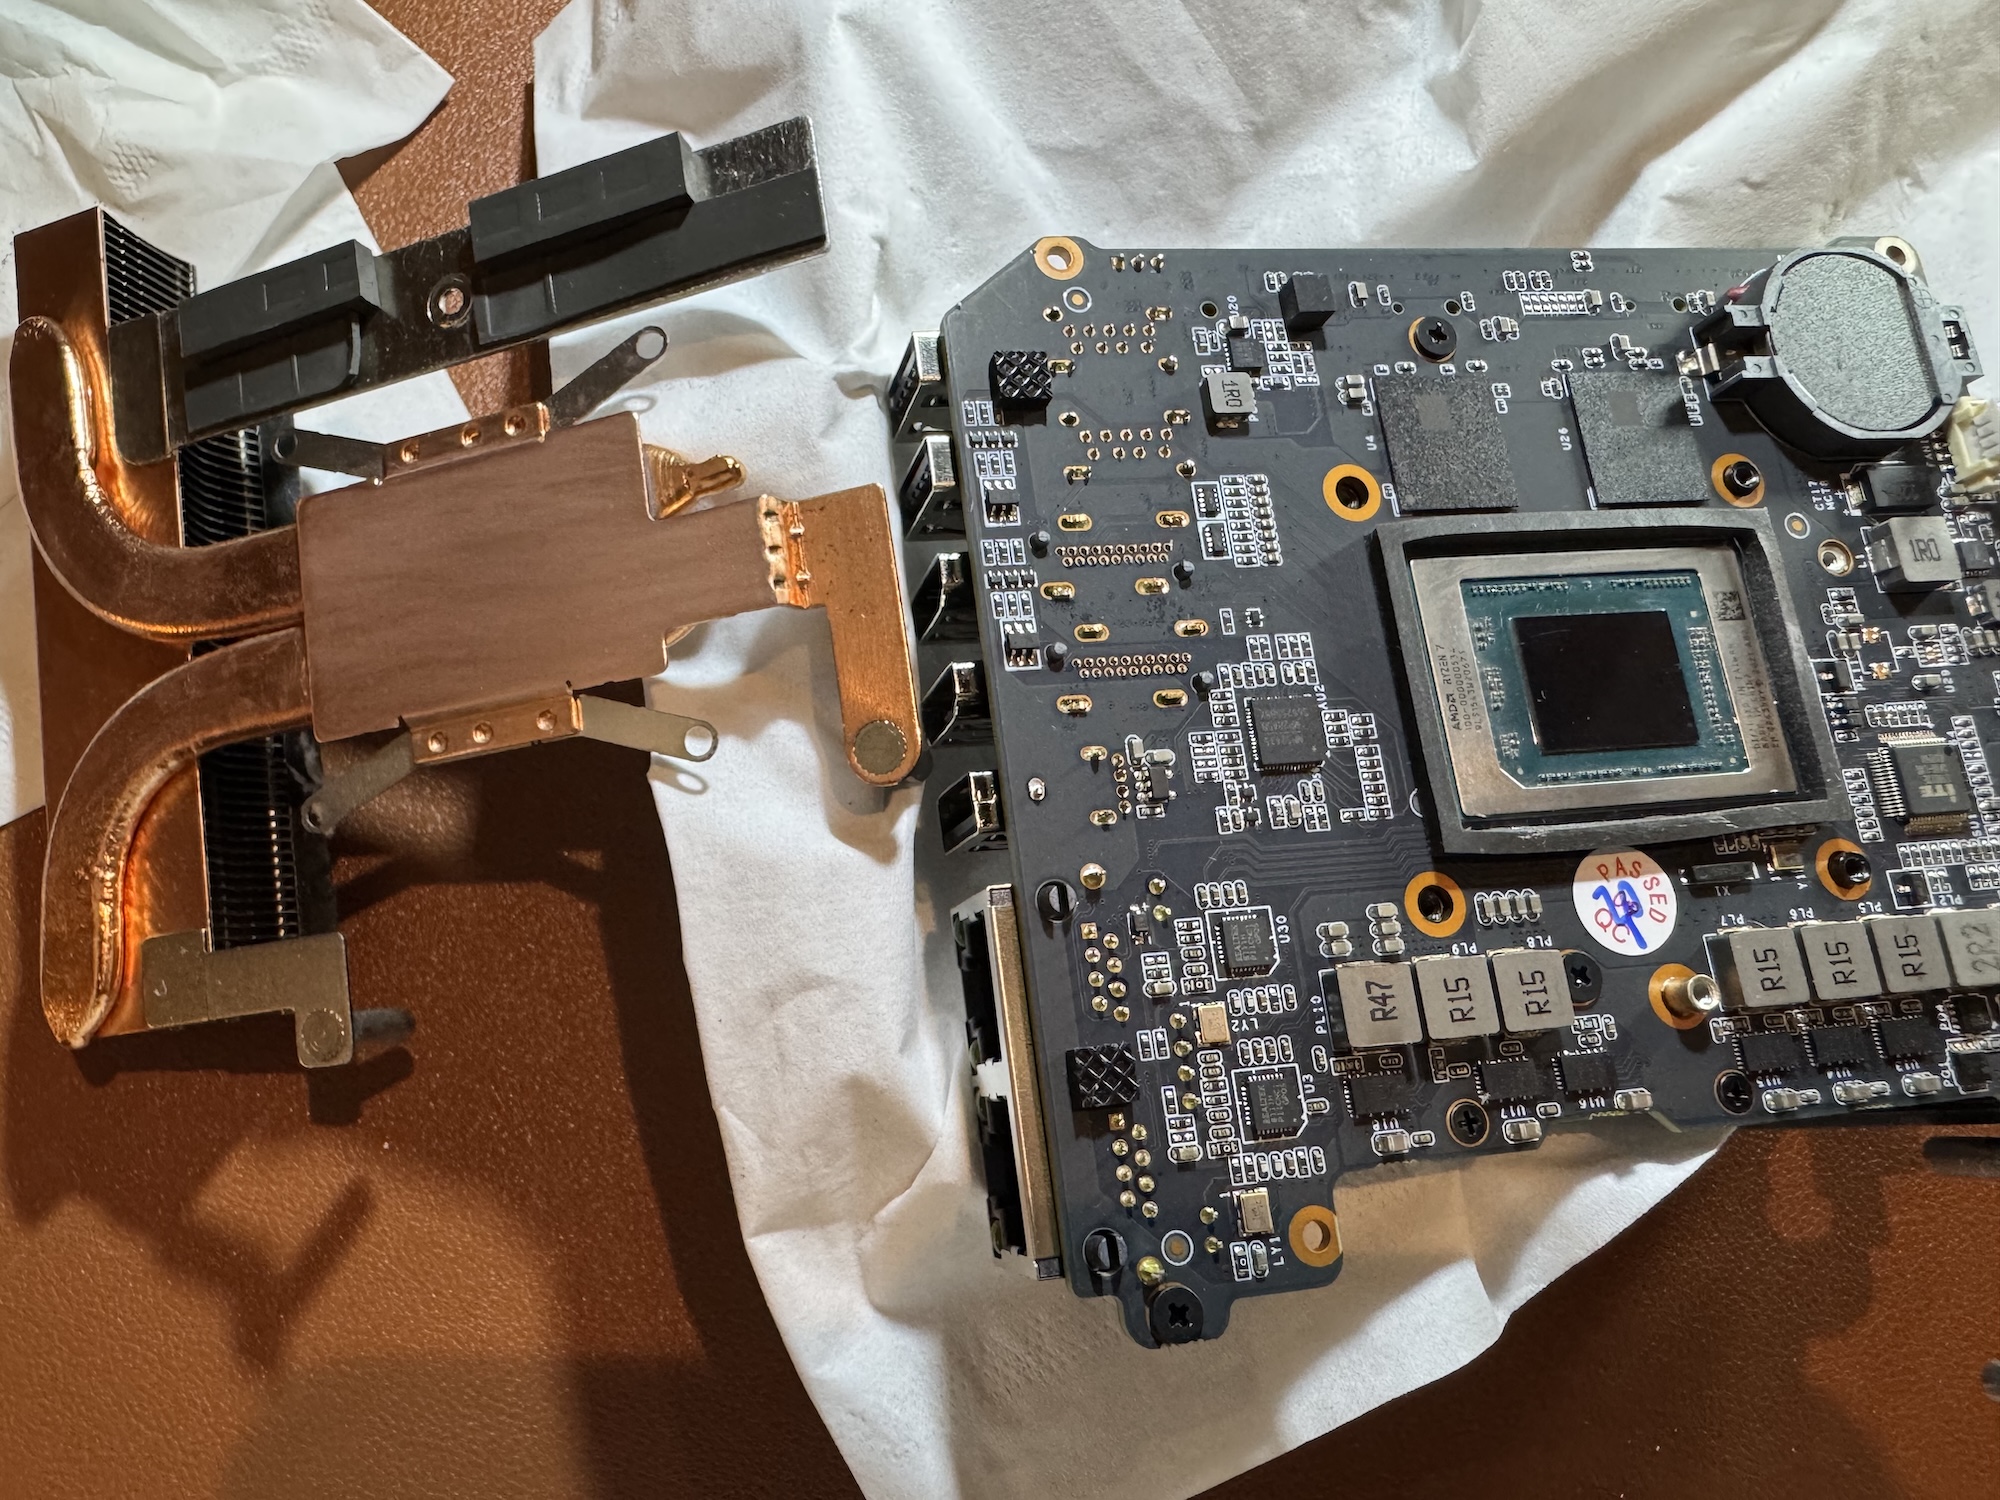
I’m not a fan of its exterior color and would have preferred black, but the value for money is hard to beat: for €359 I got the Beelink EQR6 with an AMD Ryzen 7 6800U (8 cores/16 threads, up to 4.7 GHz), 24GB of LPDDR5 RAM, and a 500GB PCIe 4x4 SSD.
Looking inside, the differences from the other Beelink mini PC are noticeable: since the RAM is soldered, the internal layout has been slightly reorganized.
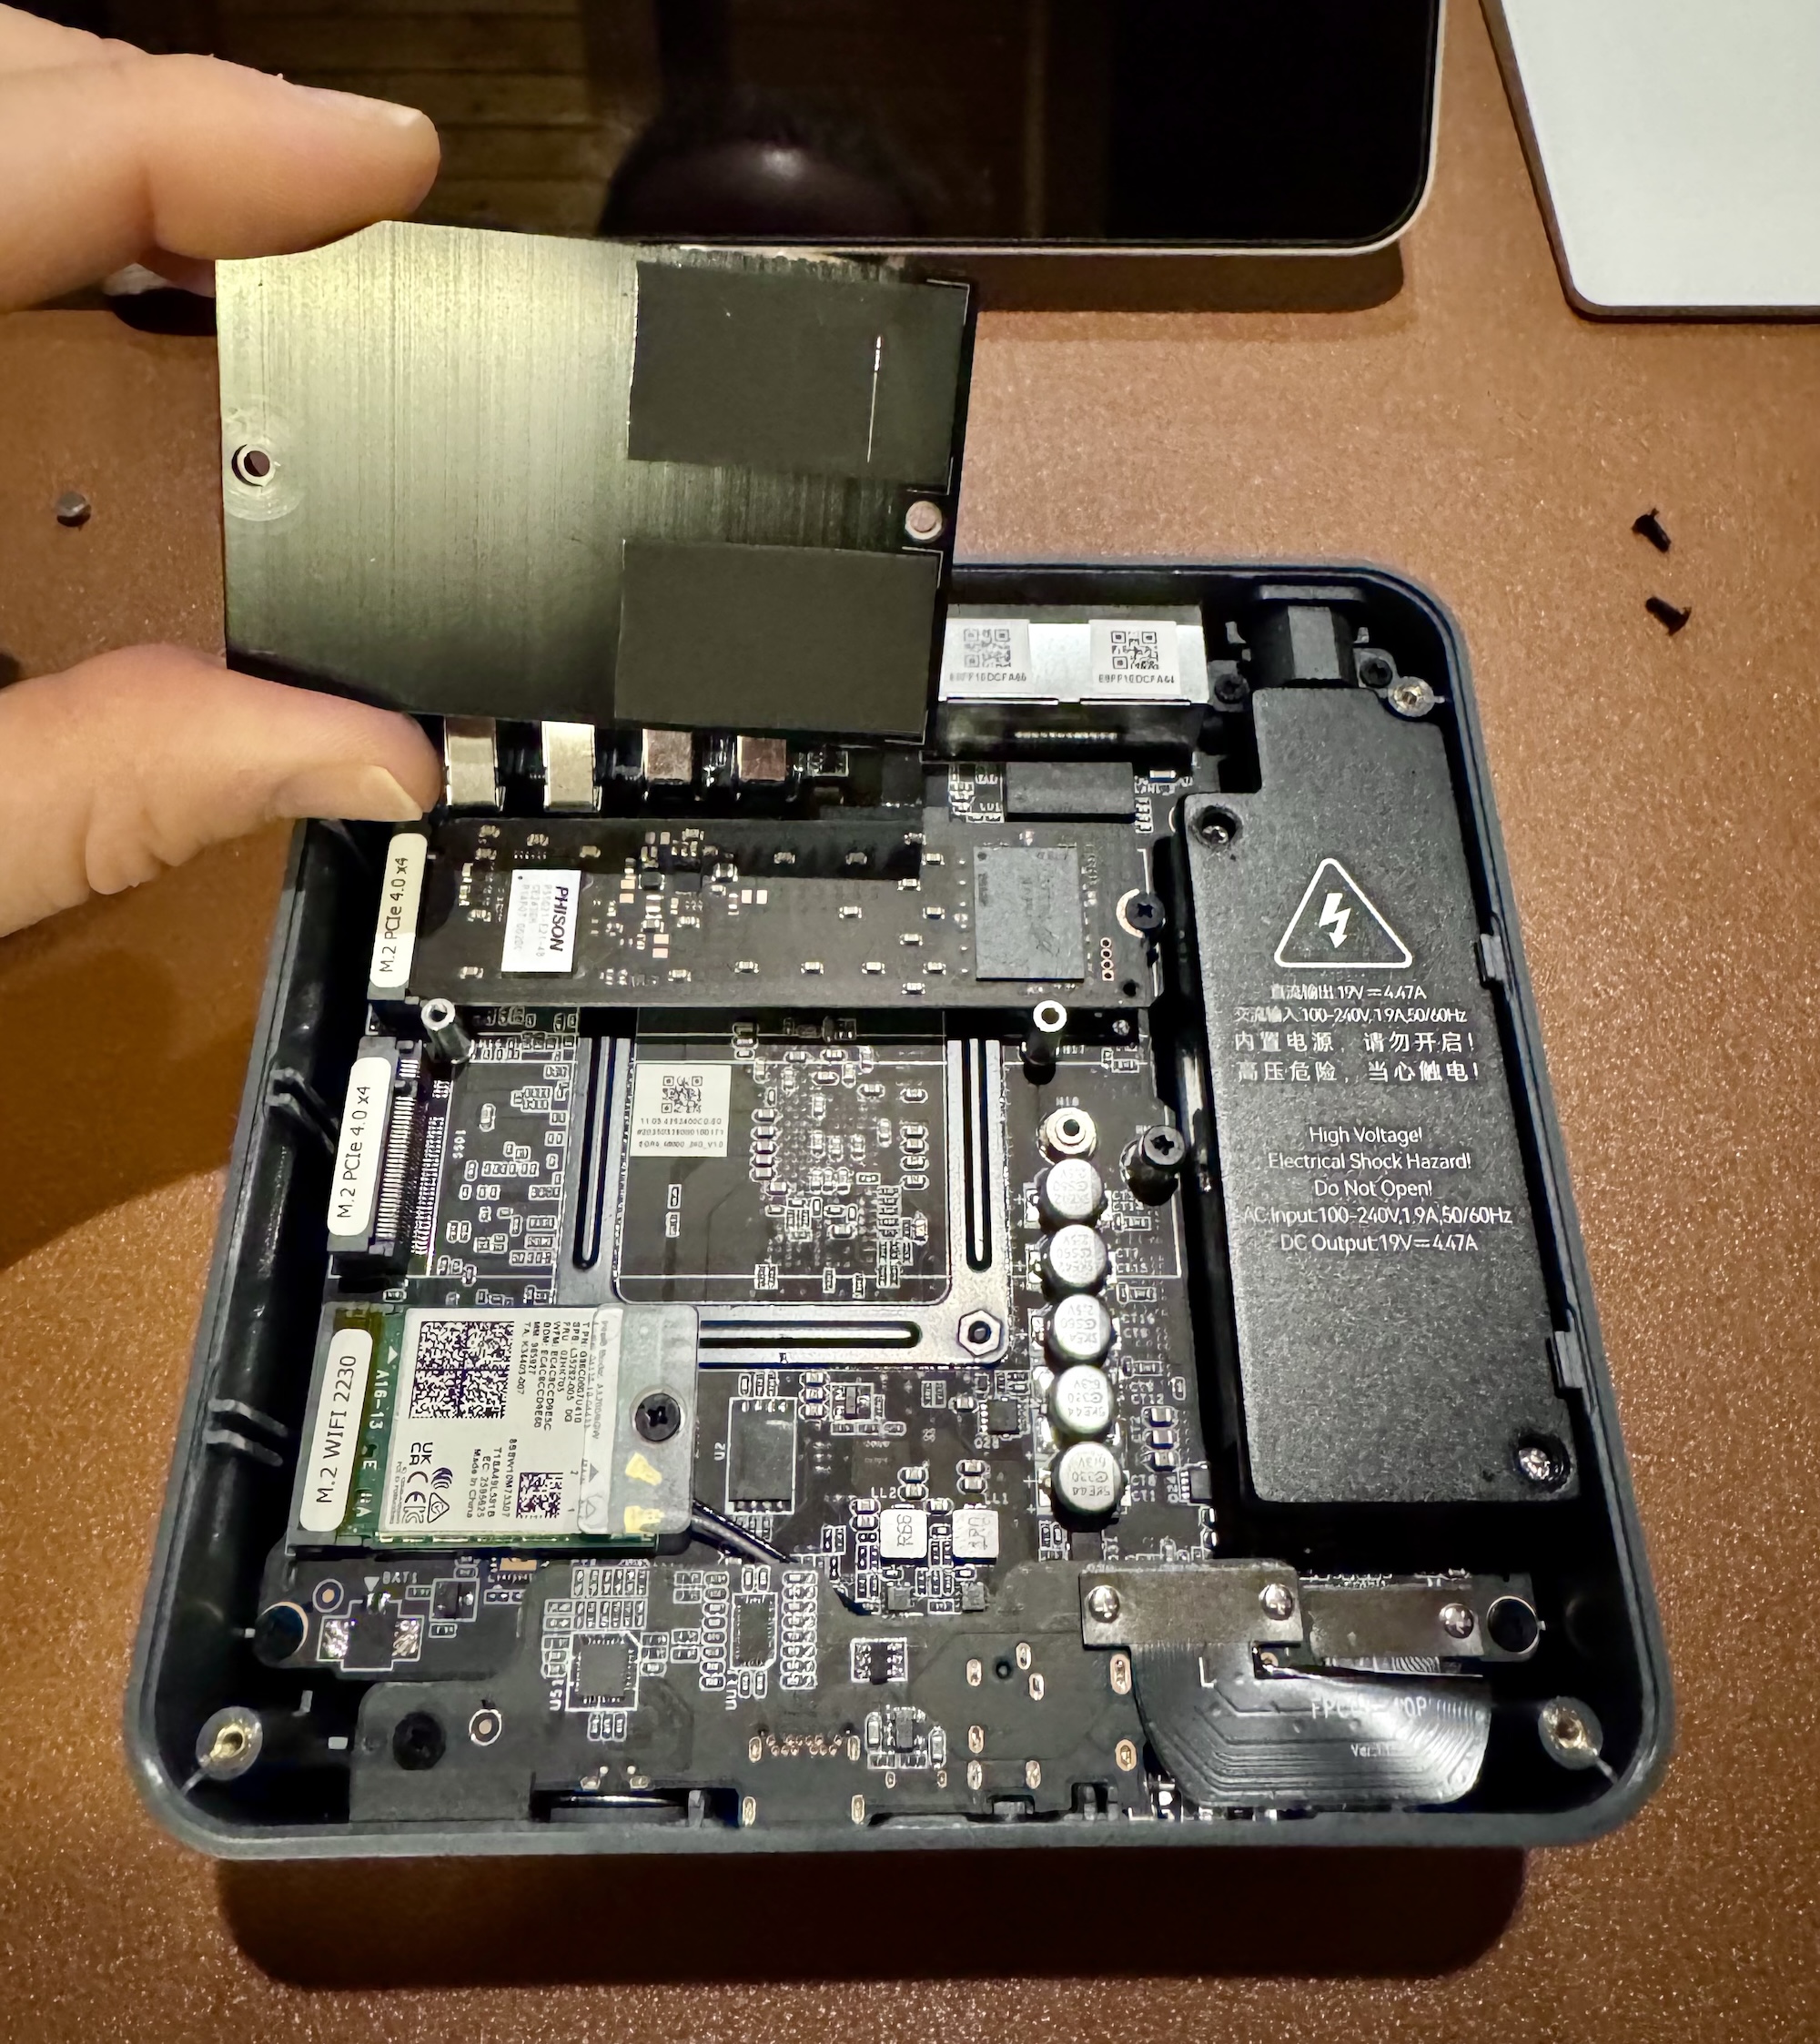
Like the previous one, I disassembled it, lapped the heat sink, replaced the thermal paste, and achieved an 8–10°C temperature drop.
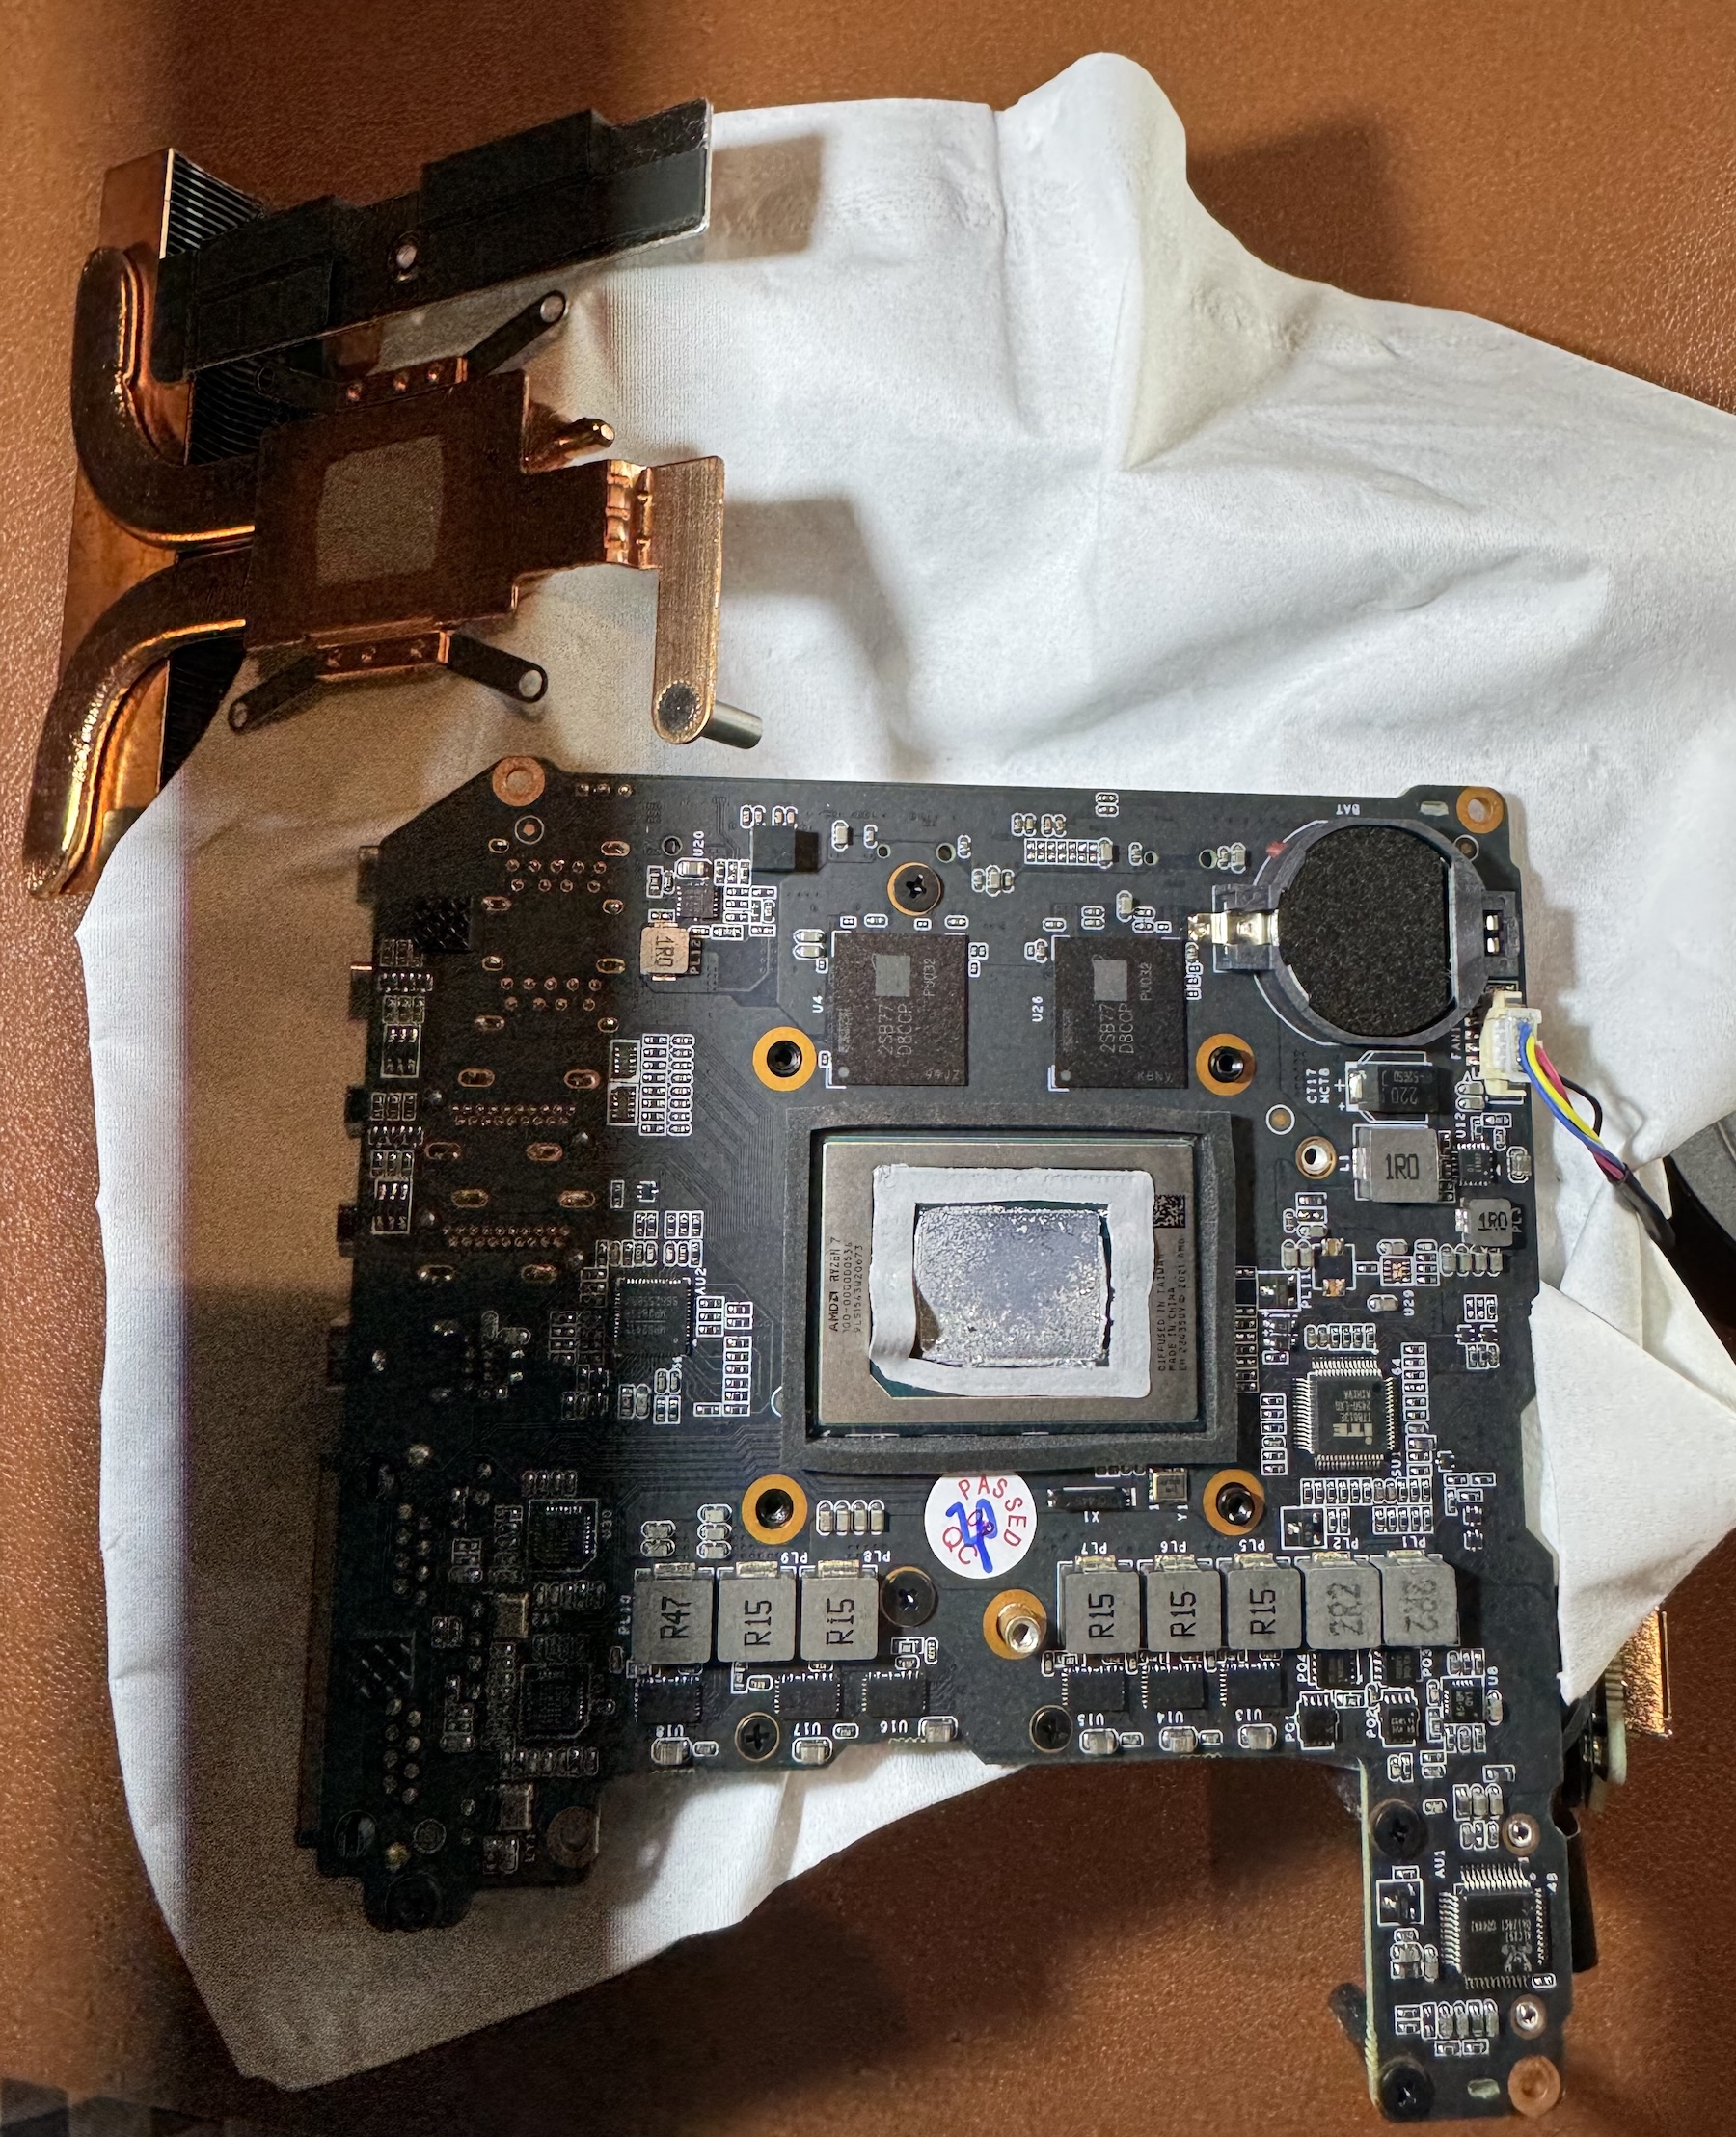
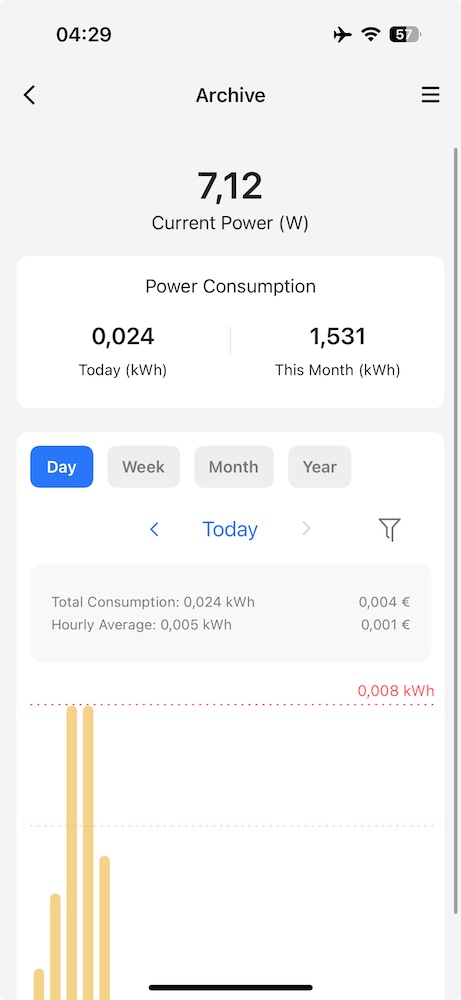
The power consumption is quite low, about 7-9W (for comparison 2 Raspberry Pi 5 8GB with NVMe consume 8-10W). I should note that I disabled the iGPU, reducing consumption by ~1/1.5W and generating less heat (and the fan spins less frequently).
The disk has remarkable performance for being a 512GB pre-installed unit, (Write ~4GB/s, Read: ~2.8GB/s measured with fio.
WRITE: bw=3873MiB/s (4061MB/s), 3873MiB/s-3873MiB/s (4061MB/s-4061MB/s), io=113GiB (122GB), run=30001-30001msec

   READ: bw=2624MiB/s (2752MB/s), 2624MiB/s-2624MiB/s (2752MB/s-2752MB/s), io=76.9GiB (82.6GB), run=30001-30001msec
And the 24h processes dashboard for the Archive server
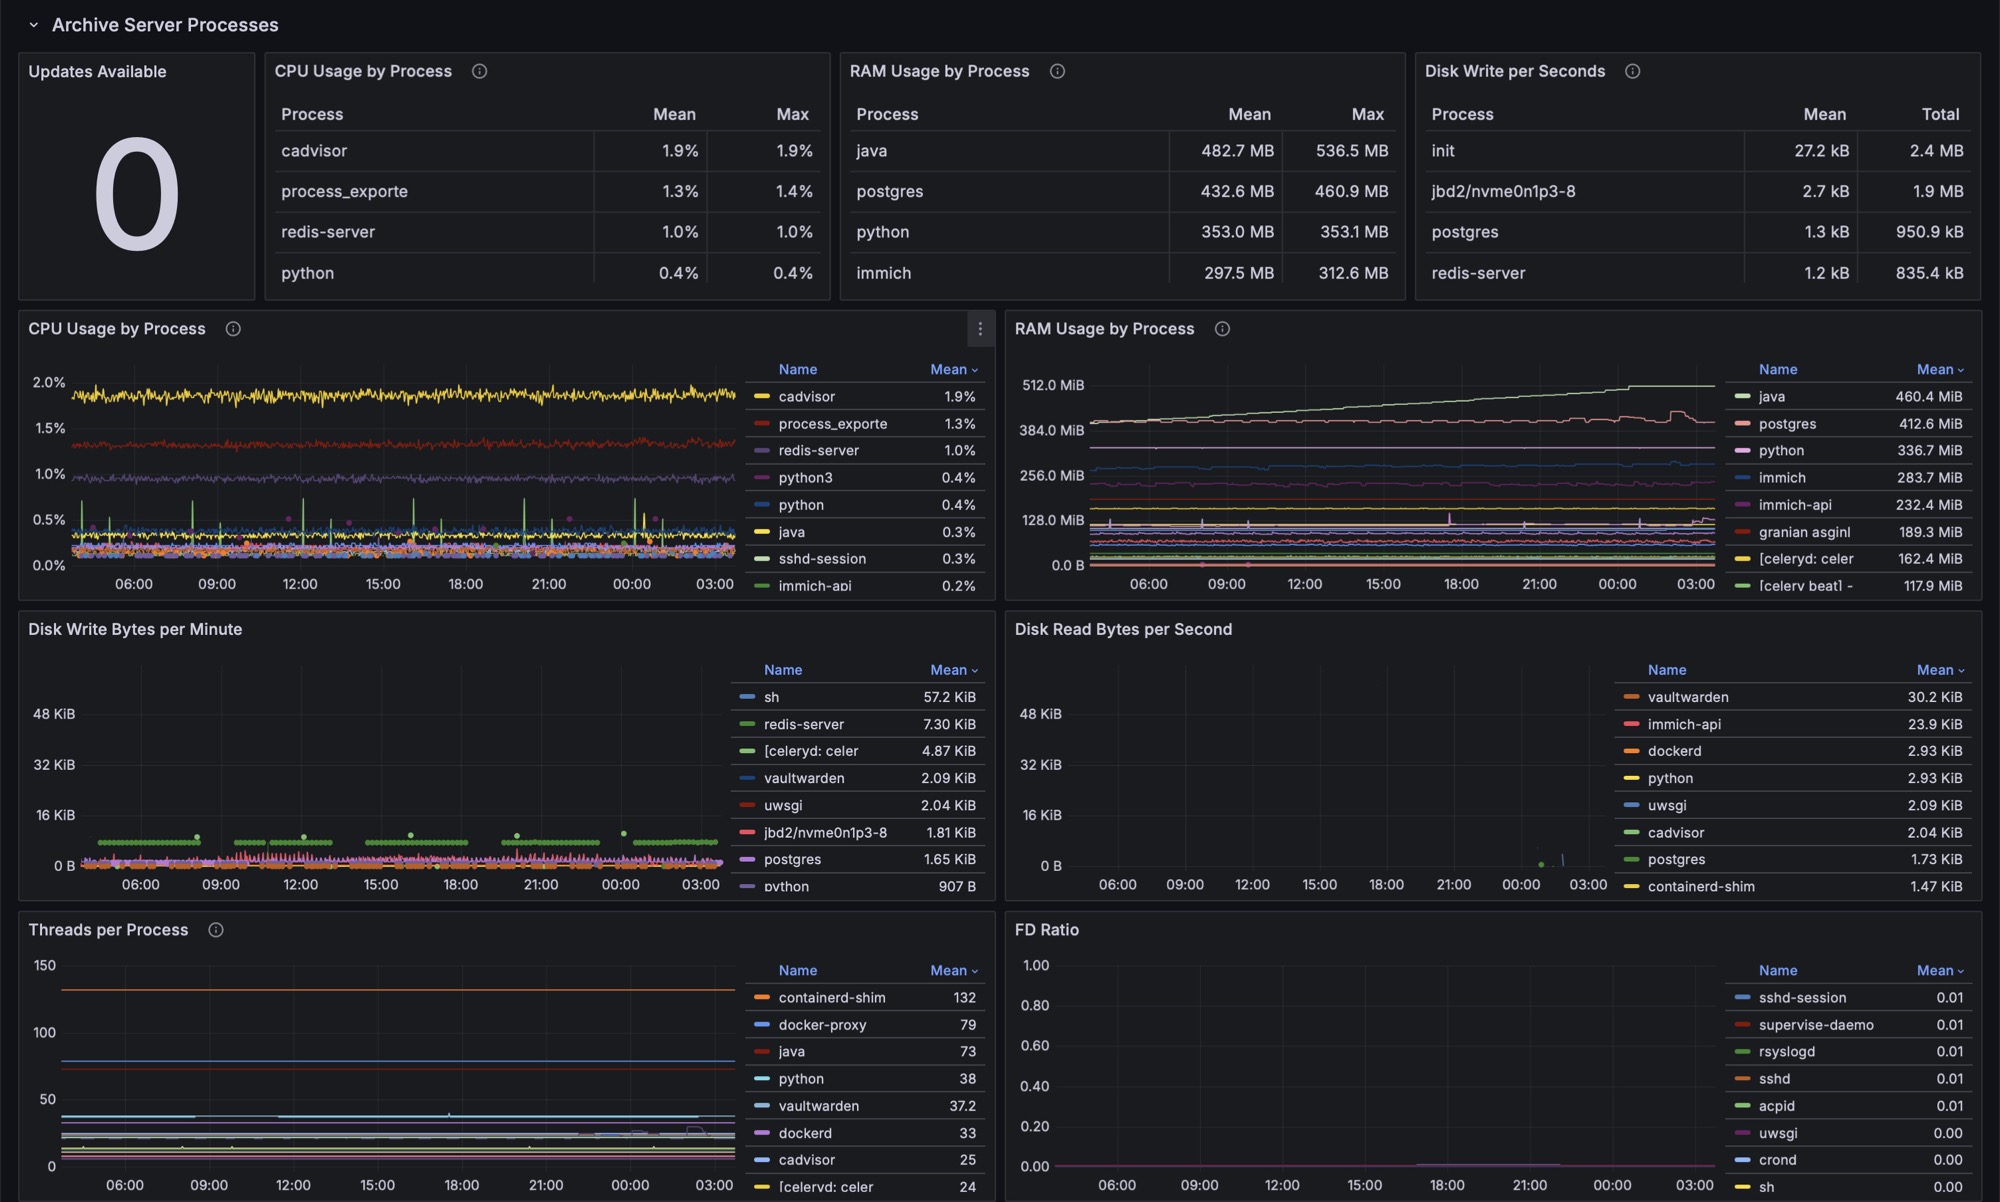
Also on this mini PC, I installed a minimal Alpine Linux along with Docker for management: Immich, Paperless, Linkding, Vaultwarden and n8n
Immich
I wrote a detailed post about Immich here: From Google Photos to Immich, check the link for all the technical details. After several months of use, I can confidently say it’s a fantastic service: I deleted all my photos from Google Photos and now rely entirely on Immich (and I’ve never had any issues accessing it remotely using WireGuard in split tunnel mode).
In short, I haven’t noticed anything negative, it works like a charm, never failed an update, and never had a problem. It’s a great self-hosted substitute for Google Photos.
A recent update: thanks to the increased power of the miniPC, I changed the object recognition model for “Smart Search” to ViT-L-14__openai. In 2-3 hours overnight it re-indexed all 11-12k photos, after I noticed improved recognition accuracy, although the differences aren’t significant.
Paperless
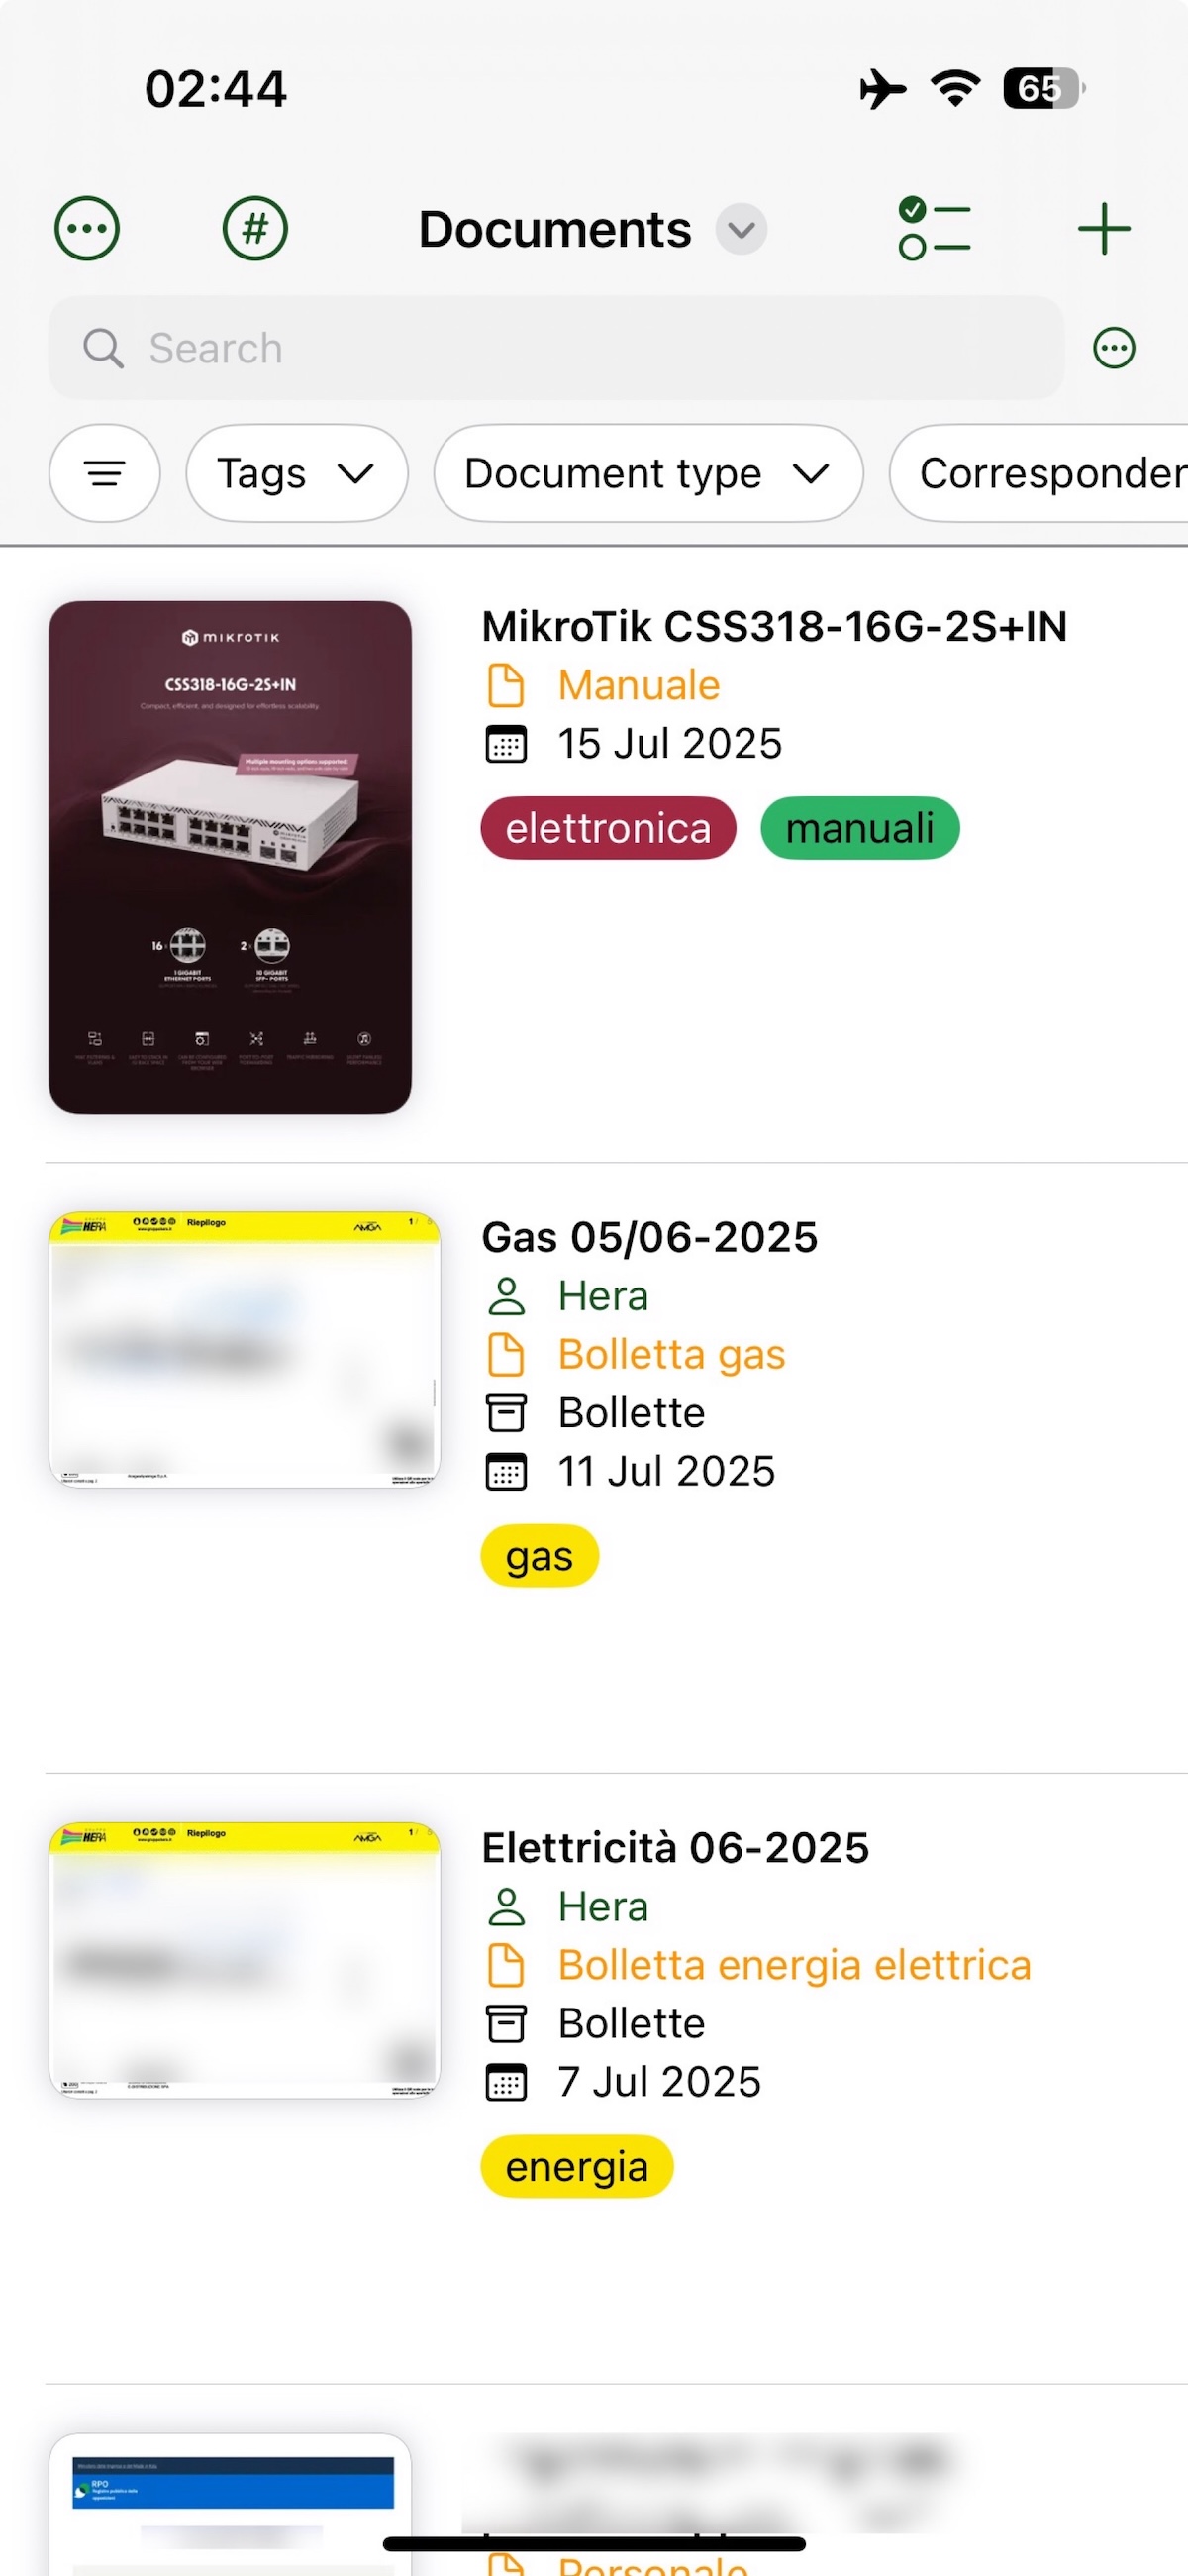
Paperless is used to archive PDFs in a highly advanced and structured way, well beyond my actual needs. It can monitor both local and remote folders, as well as an email account, to automatically retrieve and classify PDF documents and images.
By performing OCR on the text within PDFs, it enables lots of automations, for example, automatically adding tags or metadata to documents.
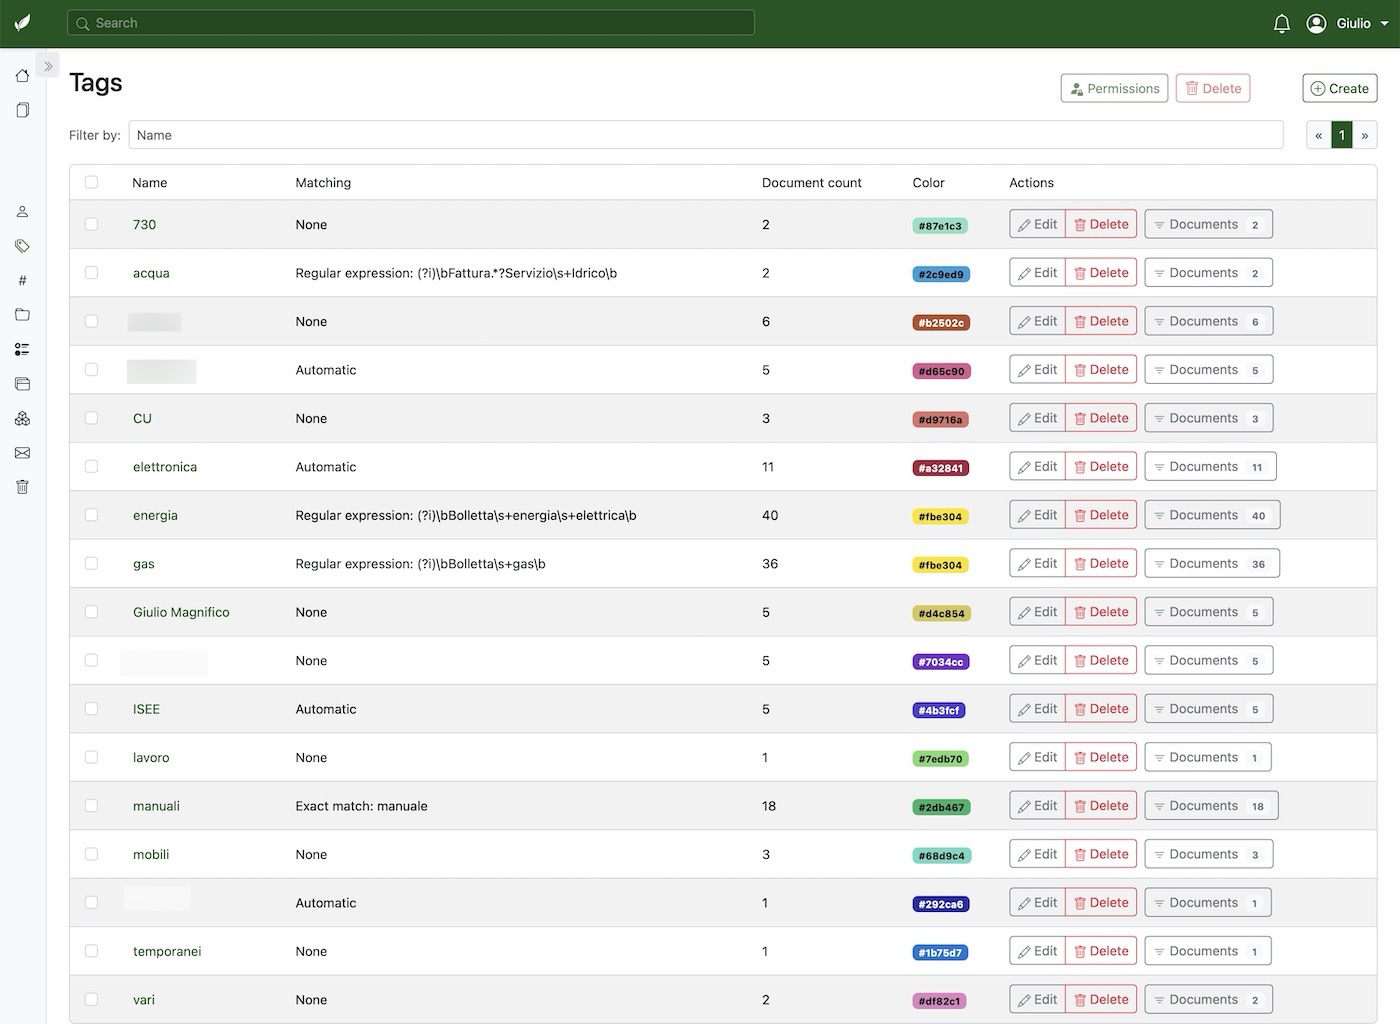
For specific tasks, like classifying electricity or water bills, it works exceptionally well: you just need to define the exact text to match, and Paperless takes care of the rest.
Here’s an example of my (very simple) tag setup:
There are many cool add-ons for Paperless; one is paperless-gpt, which enables ChatGPT to extract and classify data: paperless-gpt: Use LLMs and LLM Vision (OCR) to handle paperless-ngx.
My usage?! I use it for bills, owner’s manuals, and personal documents. I don’t archive every email document, I manually download them, and they’re automatically imported and categorized in Paperless. I only have one workflow that reads the electricity and water invoice from the email upon arrival, and Paperless adds it with the correct tags and name to its archive.
For the best user experience, I use this beautiful companion app on iOS: Swift Paperless.
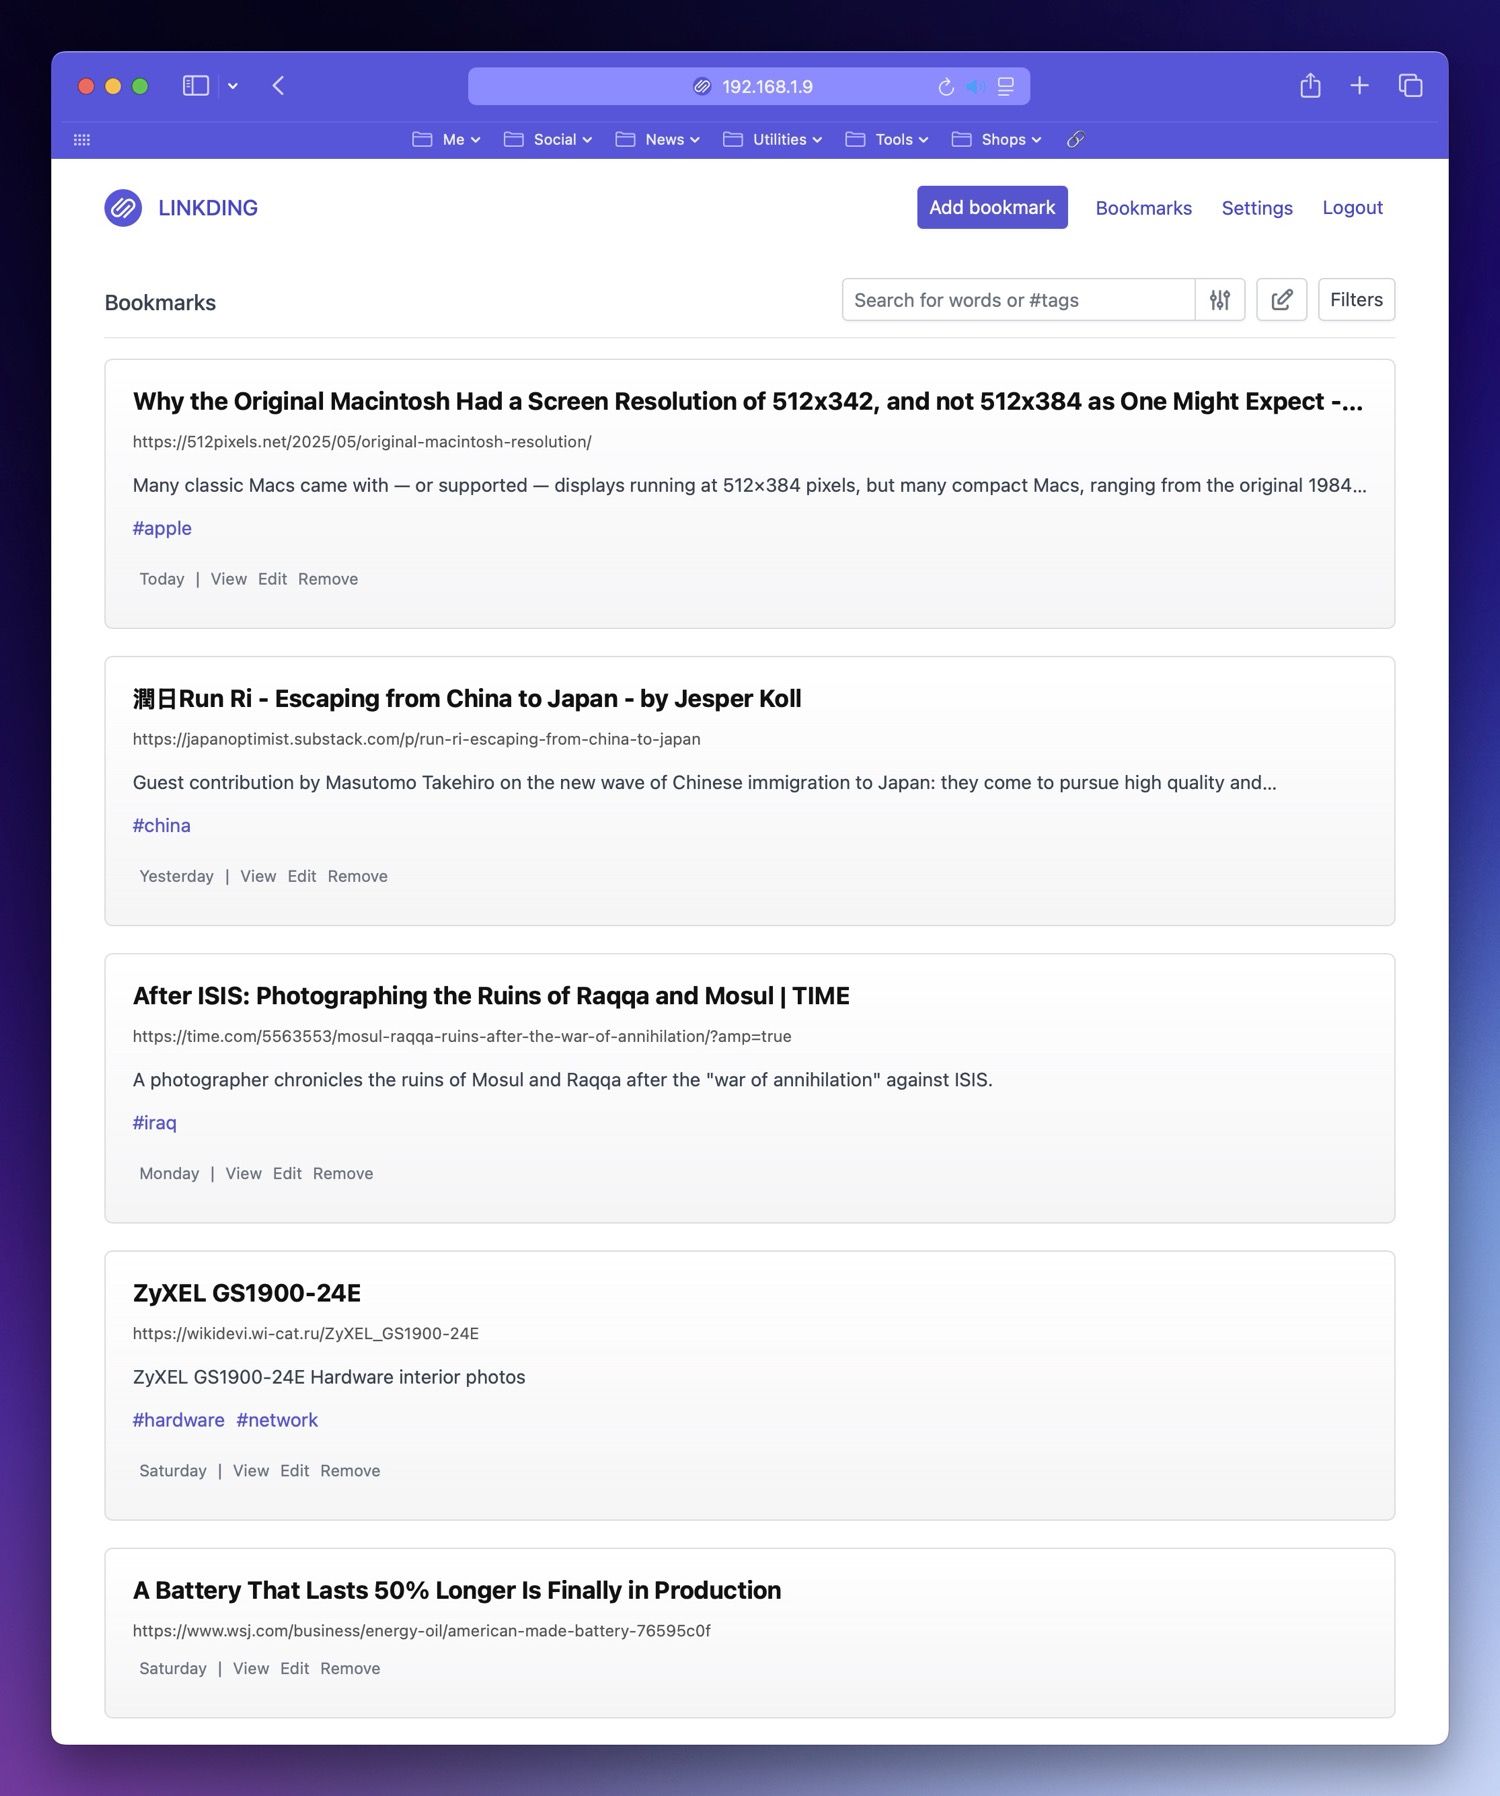
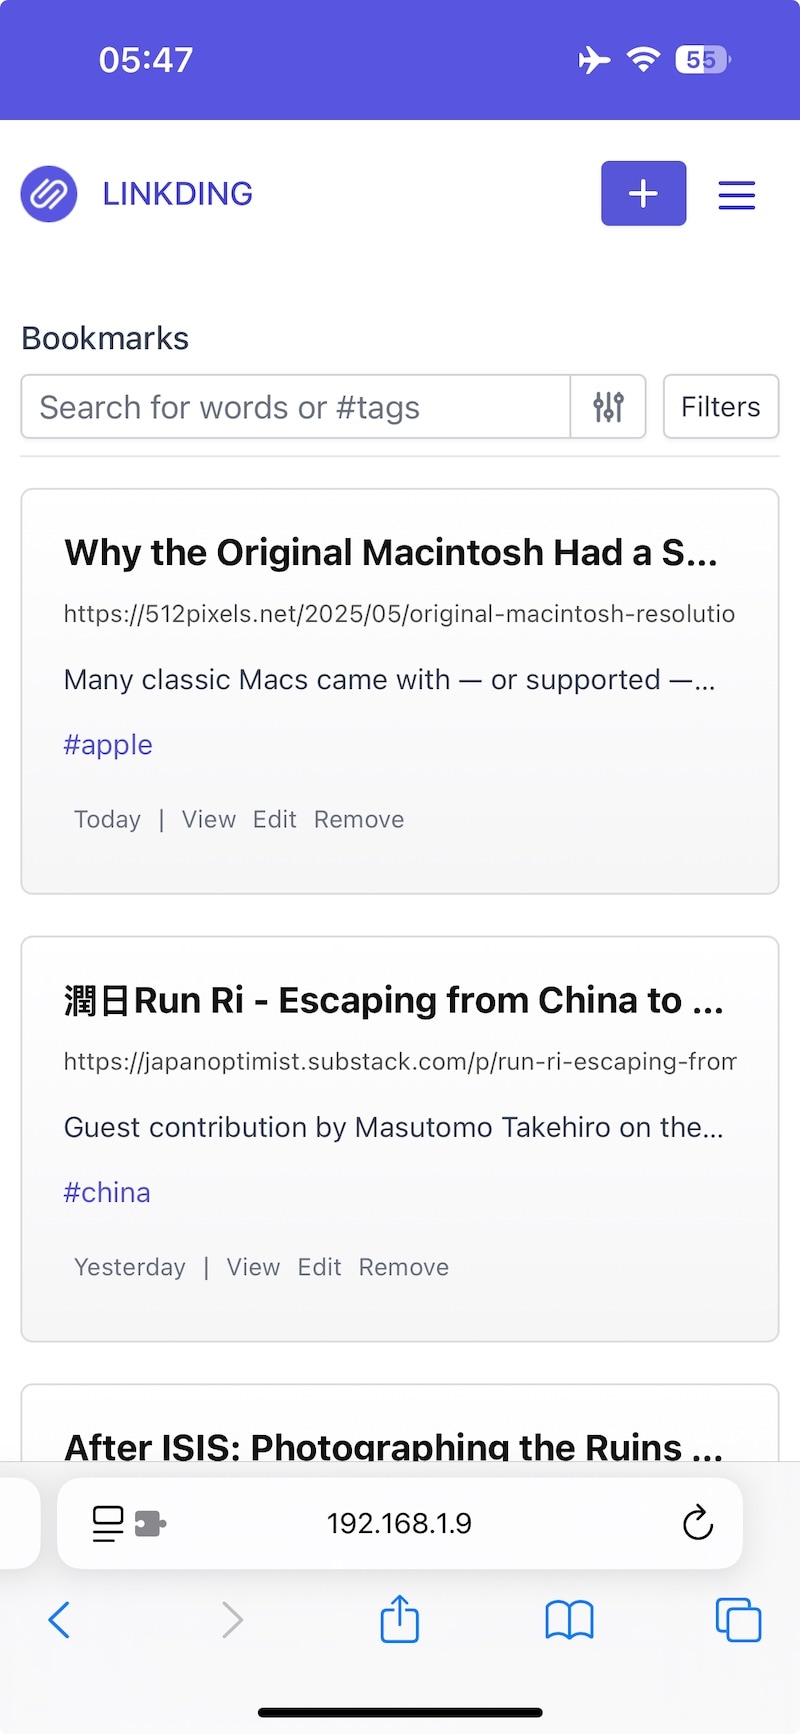
Linkding
The second service, Linkding, is a self-hosted platform for storing interesting links. I use it as a replacement for Raindrop.io, which became cumbersome with excessive features, costs, and privacy concerns. Linkding is lighter and simpler: it uses tags instead of folders, has a minimal and customizable interface, automatically saves each link to the Internet Archive, and allows creating an HTML archive of each link.
I also modified the CSS for a nicer look. Here’s the CSS if you like it: giuliomagnifico/linkding-css: Custom CSS for Linkding bookmarks manager
And I created a shortcut that allows me to add links to Linkding when I open a web page from a WebKit interface of an app, not from Safari. This avoids using the bookmarklet, which isn’t available in Safari web view within other apps.
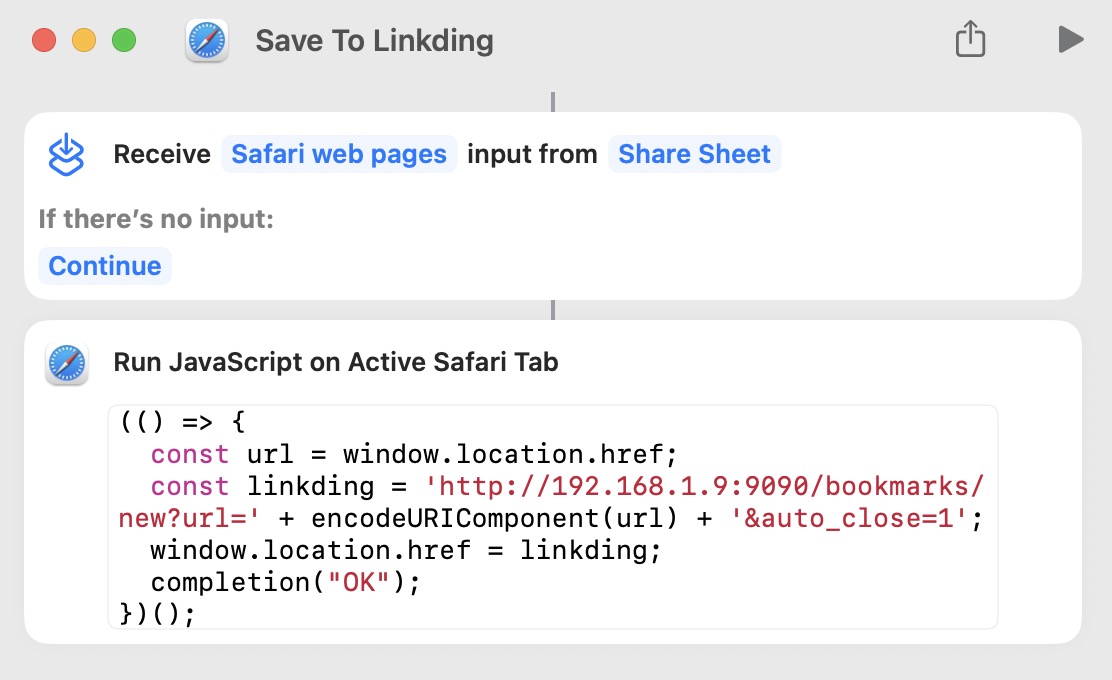
The code to copy and paste (obviously replace the IP)
(() => {
  const url = window.location.href;
  const linkding = 'http://192.168.1.9:9090/bookmarks/new?url=' + encodeURIComponent(url) + '&auto_close=1';
  window.location.href = linkding;
  completion("OK");
})();
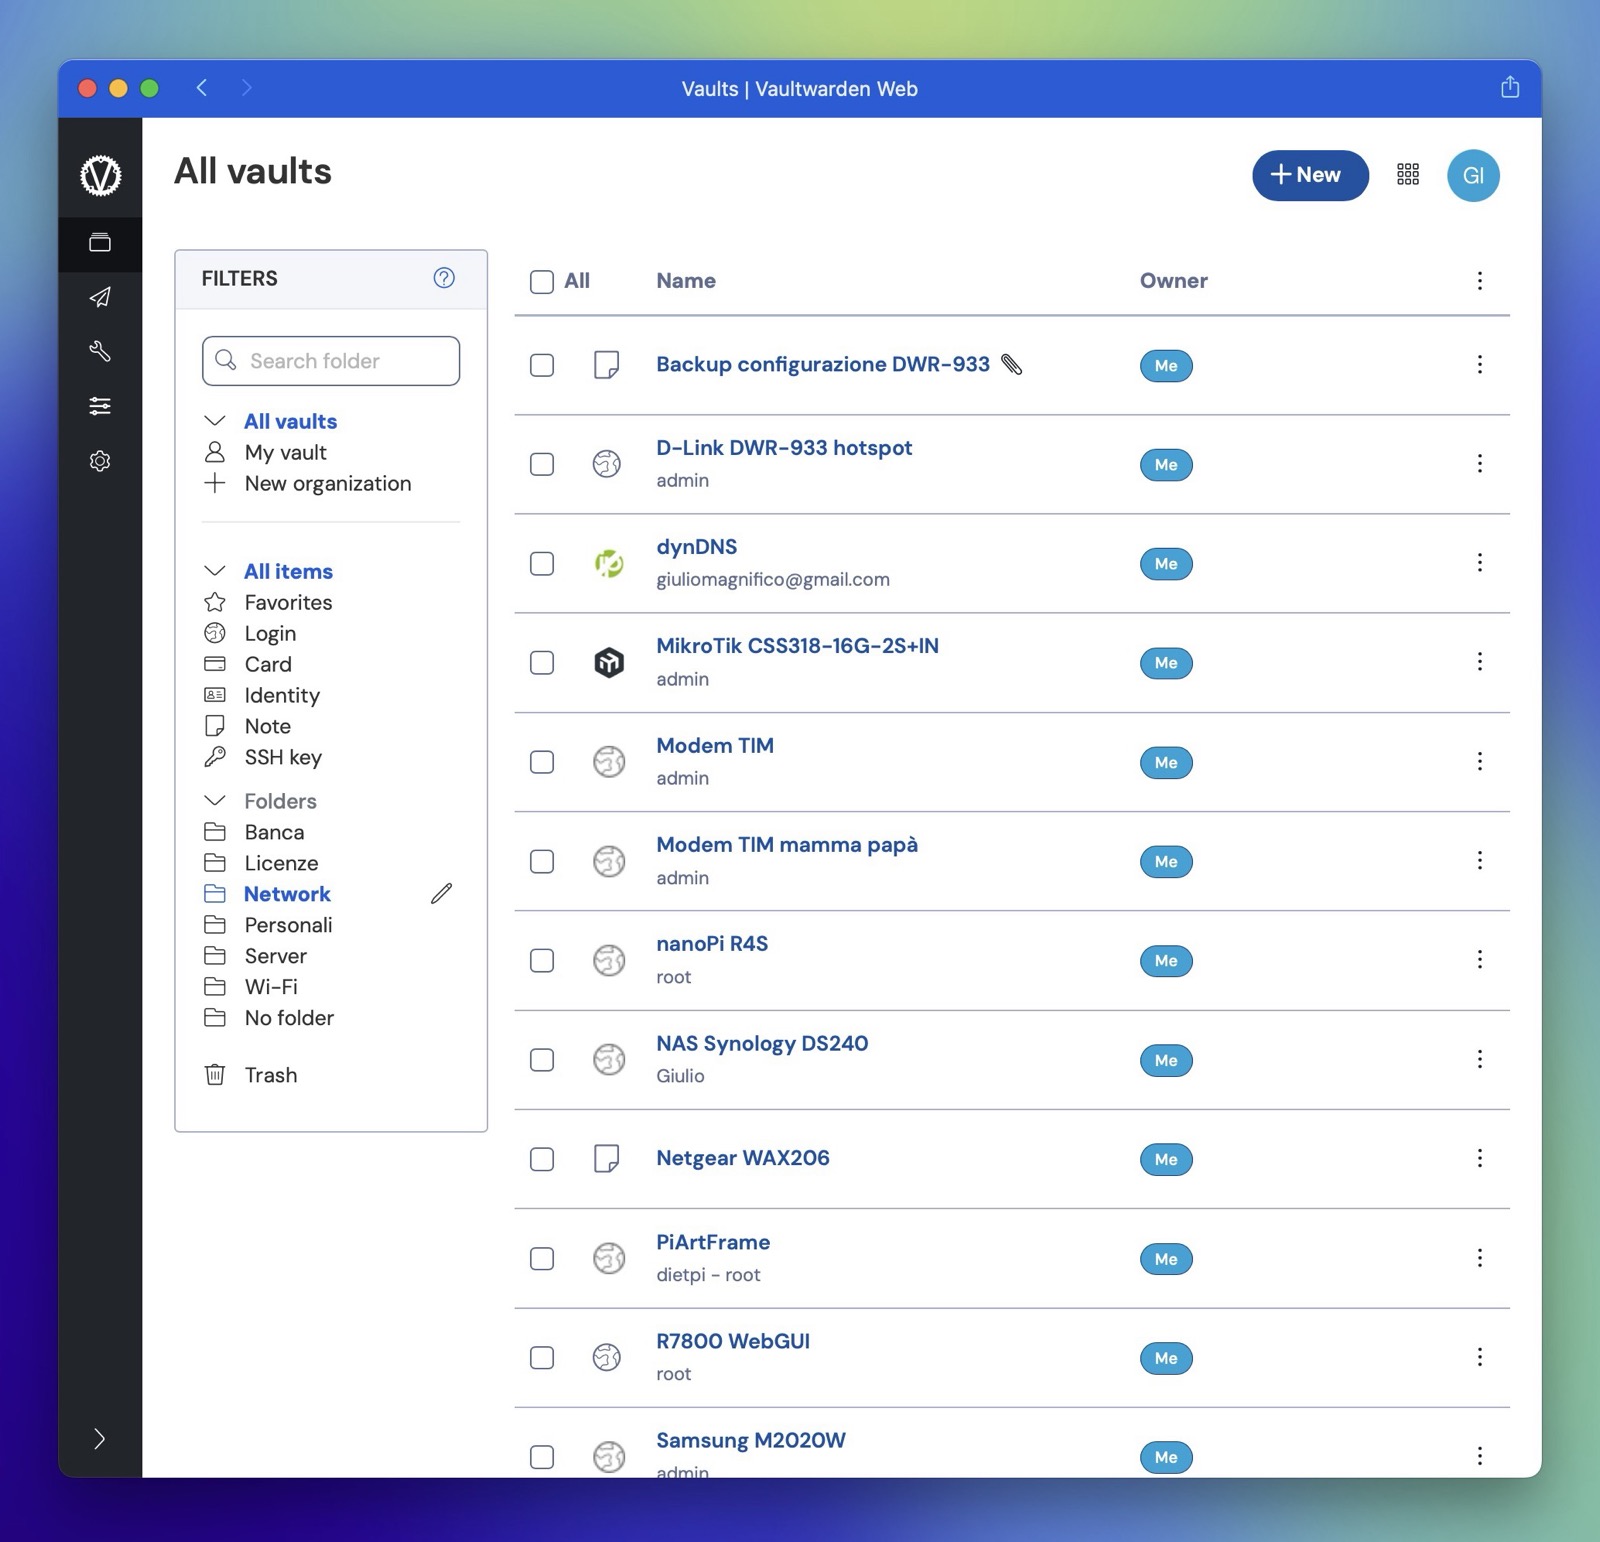
Vaultwarden
Since Apple introduced its built-in password manager “Passwords”, I’ve rarely used 1Password. I now use Apple’s service for saving and autofilling web logins, and keep 1Password only for specific needs like SSH keys, server credentials or sensitive documents.
That’s why I hesitated to renew the 1Password subscription. Besides, I’ve never been entirely comfortable with a cloud-based password manager, while I’m confident everything is secure, hosting it at home (and accessible only via WireGuard) feels safer to me.
So I exported my data from 1Password (using the .1pux format) and imported everything into Vaultwarden without any issues. It just took a bit of time to reorganize some “weird” entries and (re)attach external files to the item with attachments in 1Password.
After several months with Vaultwarden, I found it less user-friendly and straightforward than 1Password: the interface is less intuitive, and even on a LAN, you need to generate TLS certificates via mkcert and install them on each Mac or iOS device.
But… hey it’s an open source service, free and self-hosted, despite the complexity, once set up, it works well and meets my needs. If you need something more advanced, 1Password or Bitwarden are definitely better options.
n8n
n8n is a great service for building and running workflows under certain conditions. It’like IFTTT, on steroids.
To me, it’s even overkill, I only use it for a few things since I already receive many notifications from Grafana.
In any case, my -few- workflows are:
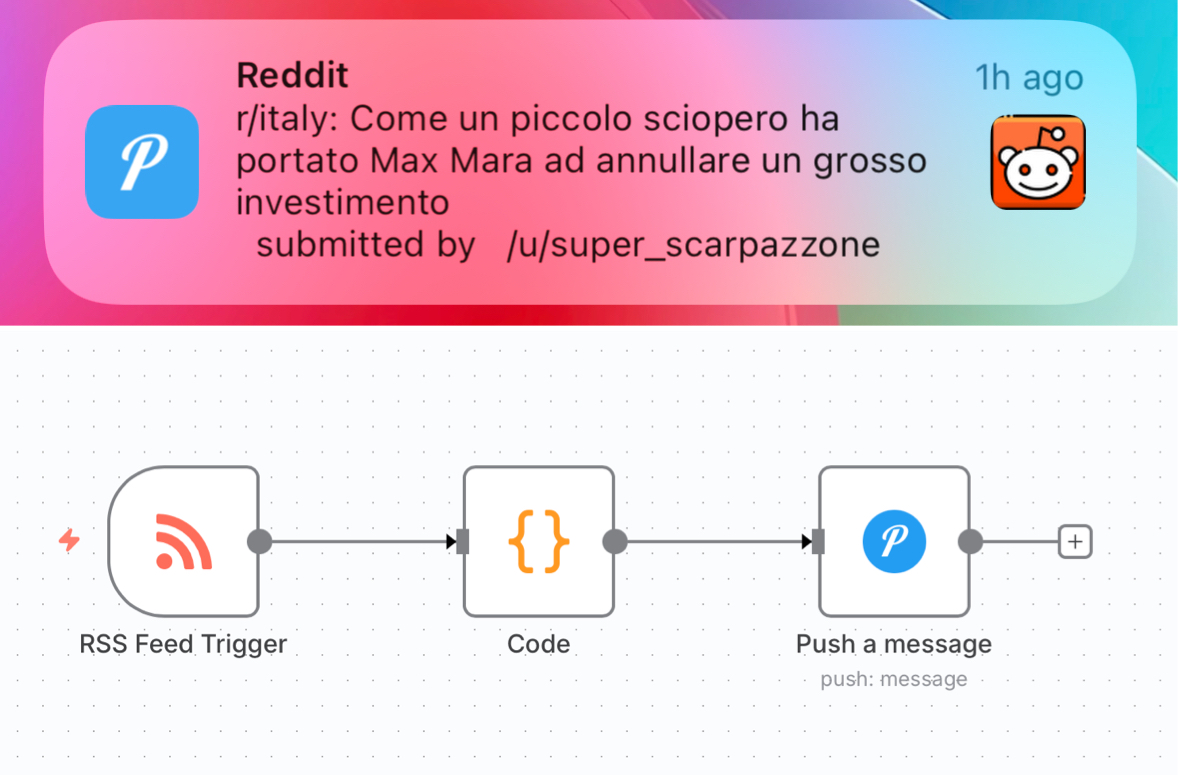
- Push notifications (via Pushover) for new posts on specific subreddits.
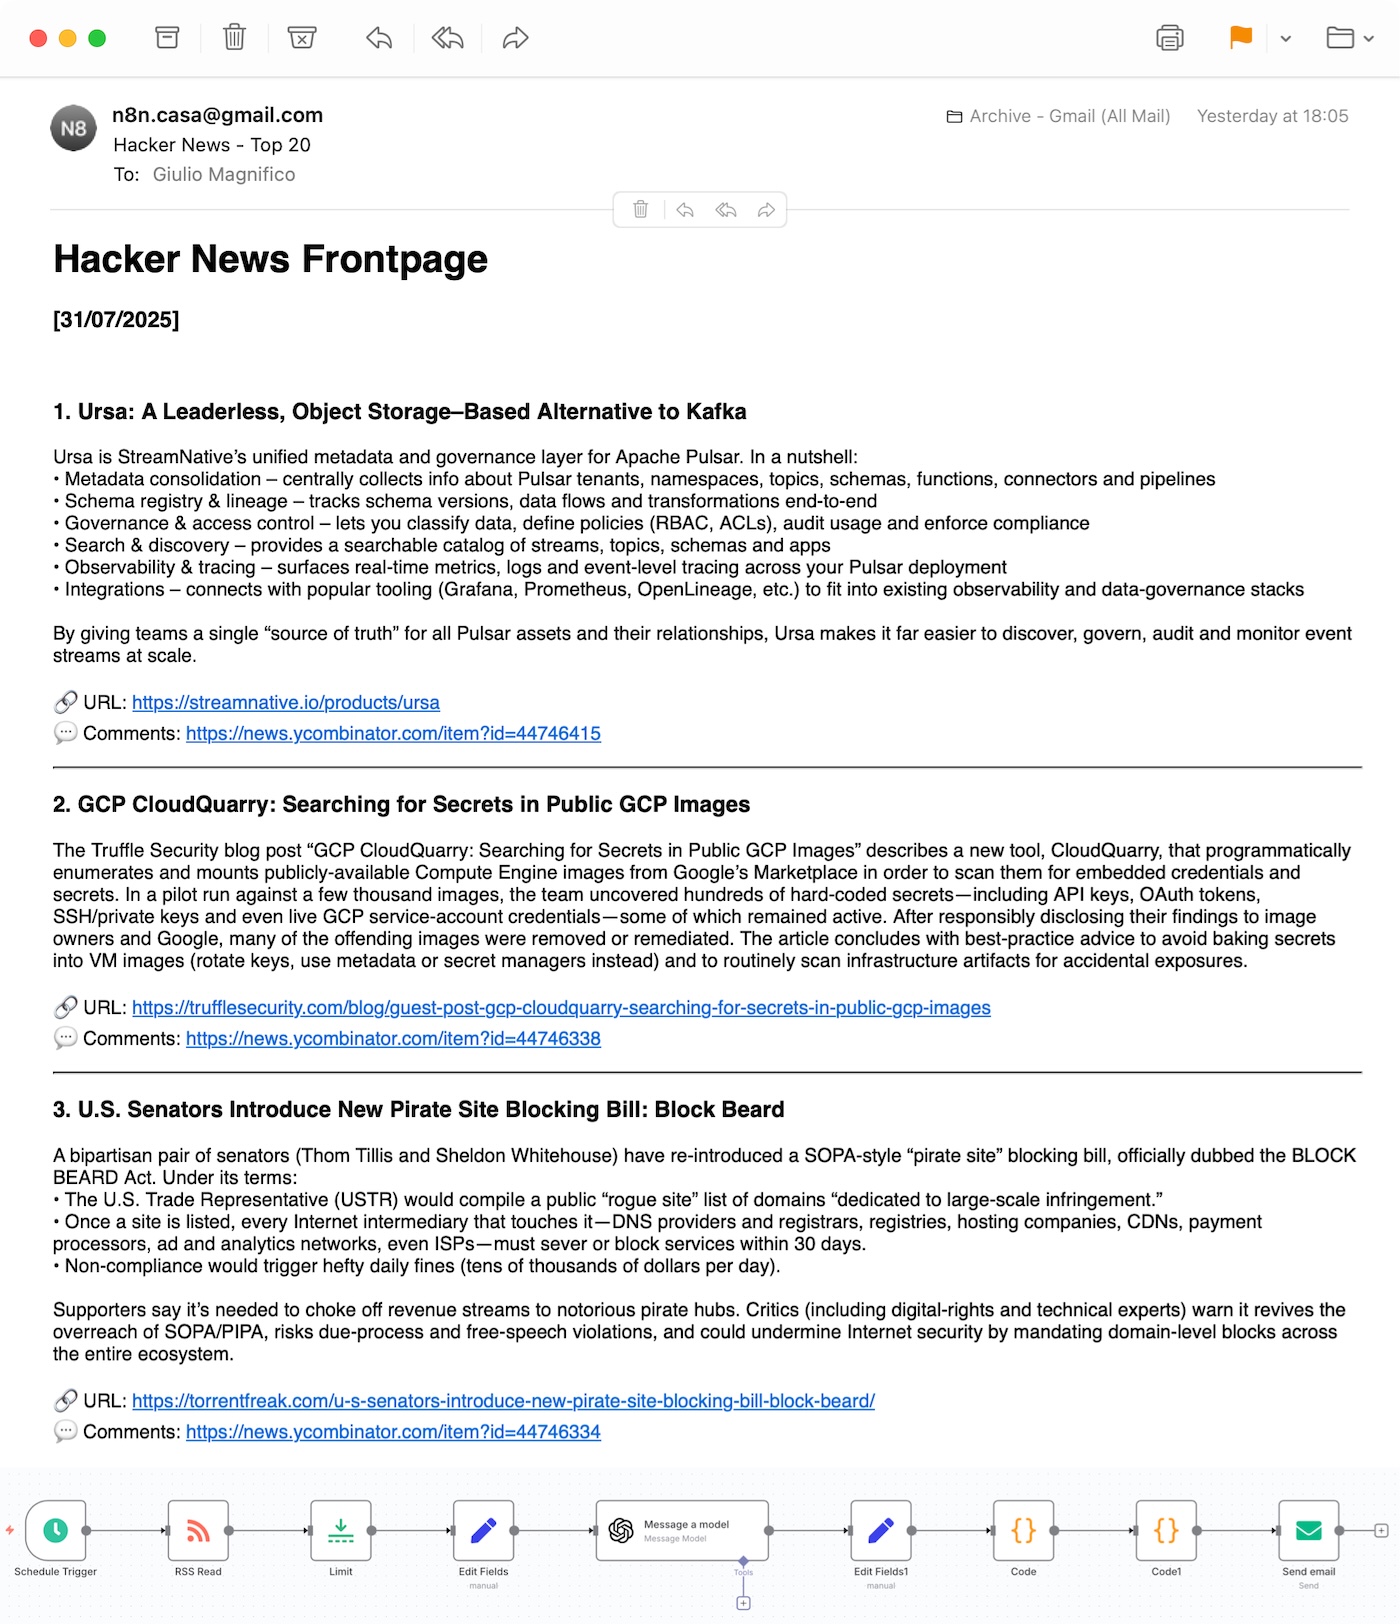
- Daily summary of the top 20 front page posts on HN summarized using ChatGPT.
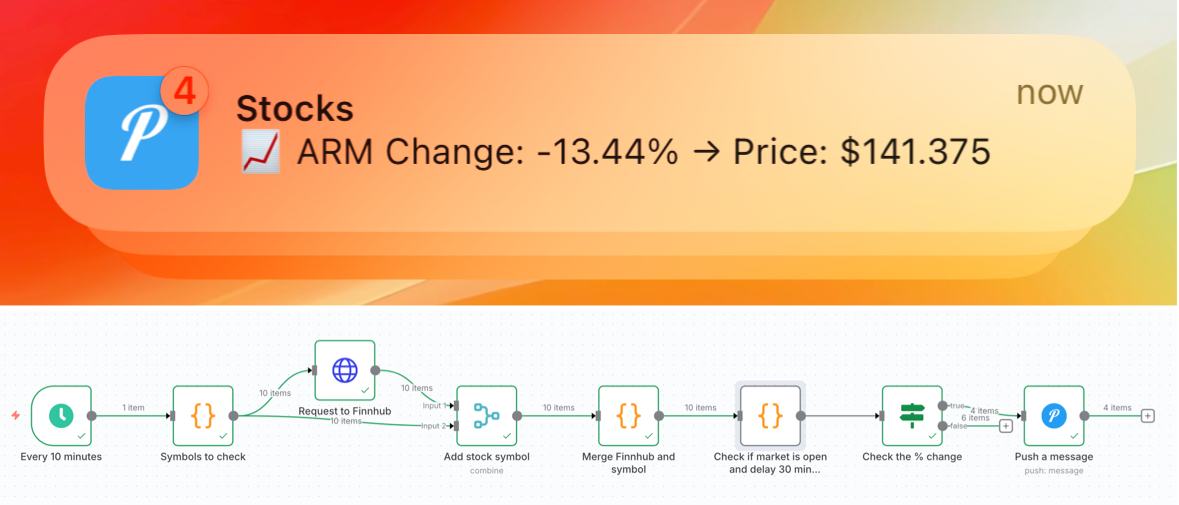
- Pushover notifications if a stock title varies by +-2%.
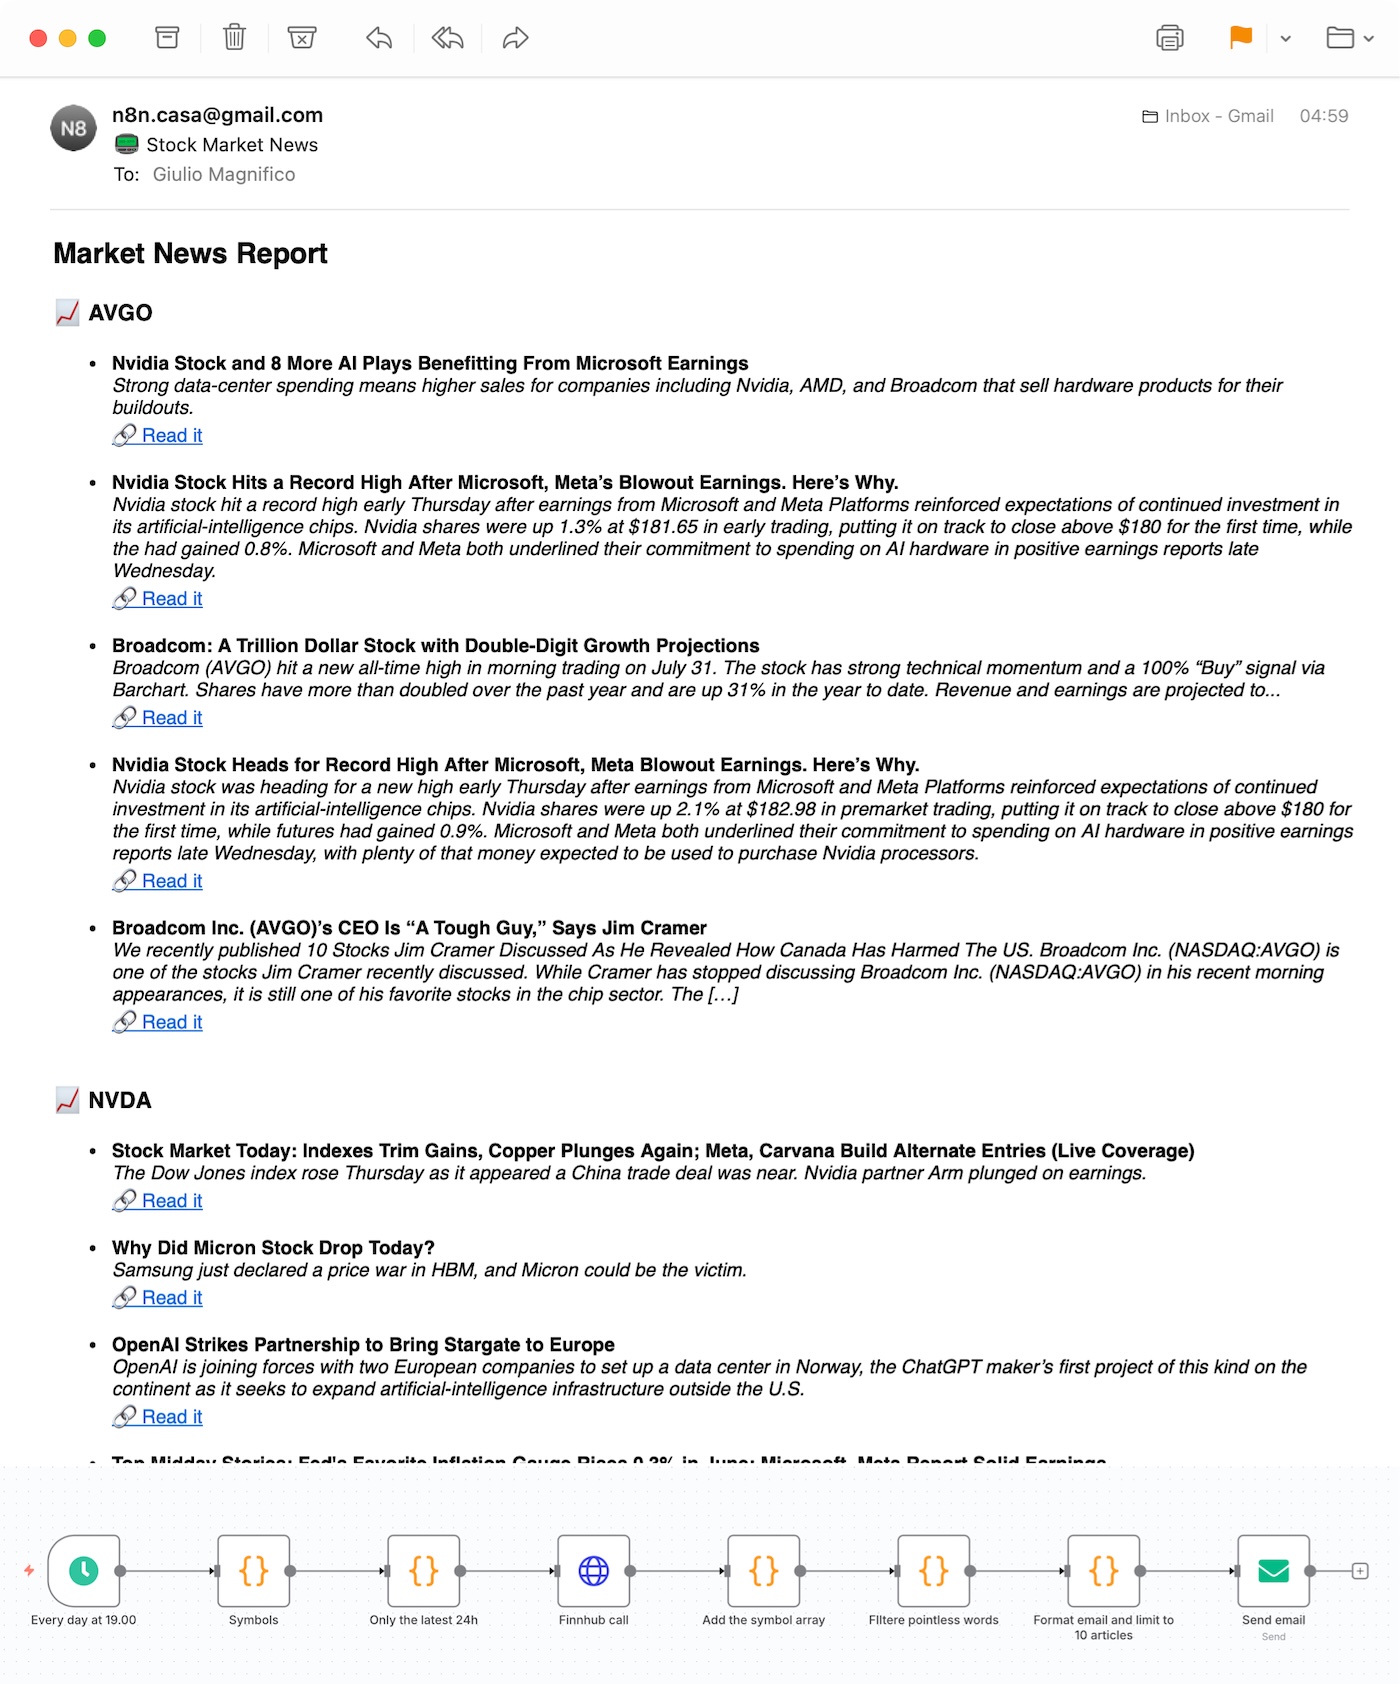
- Daily summary of news on specific stock titles via Finnhub
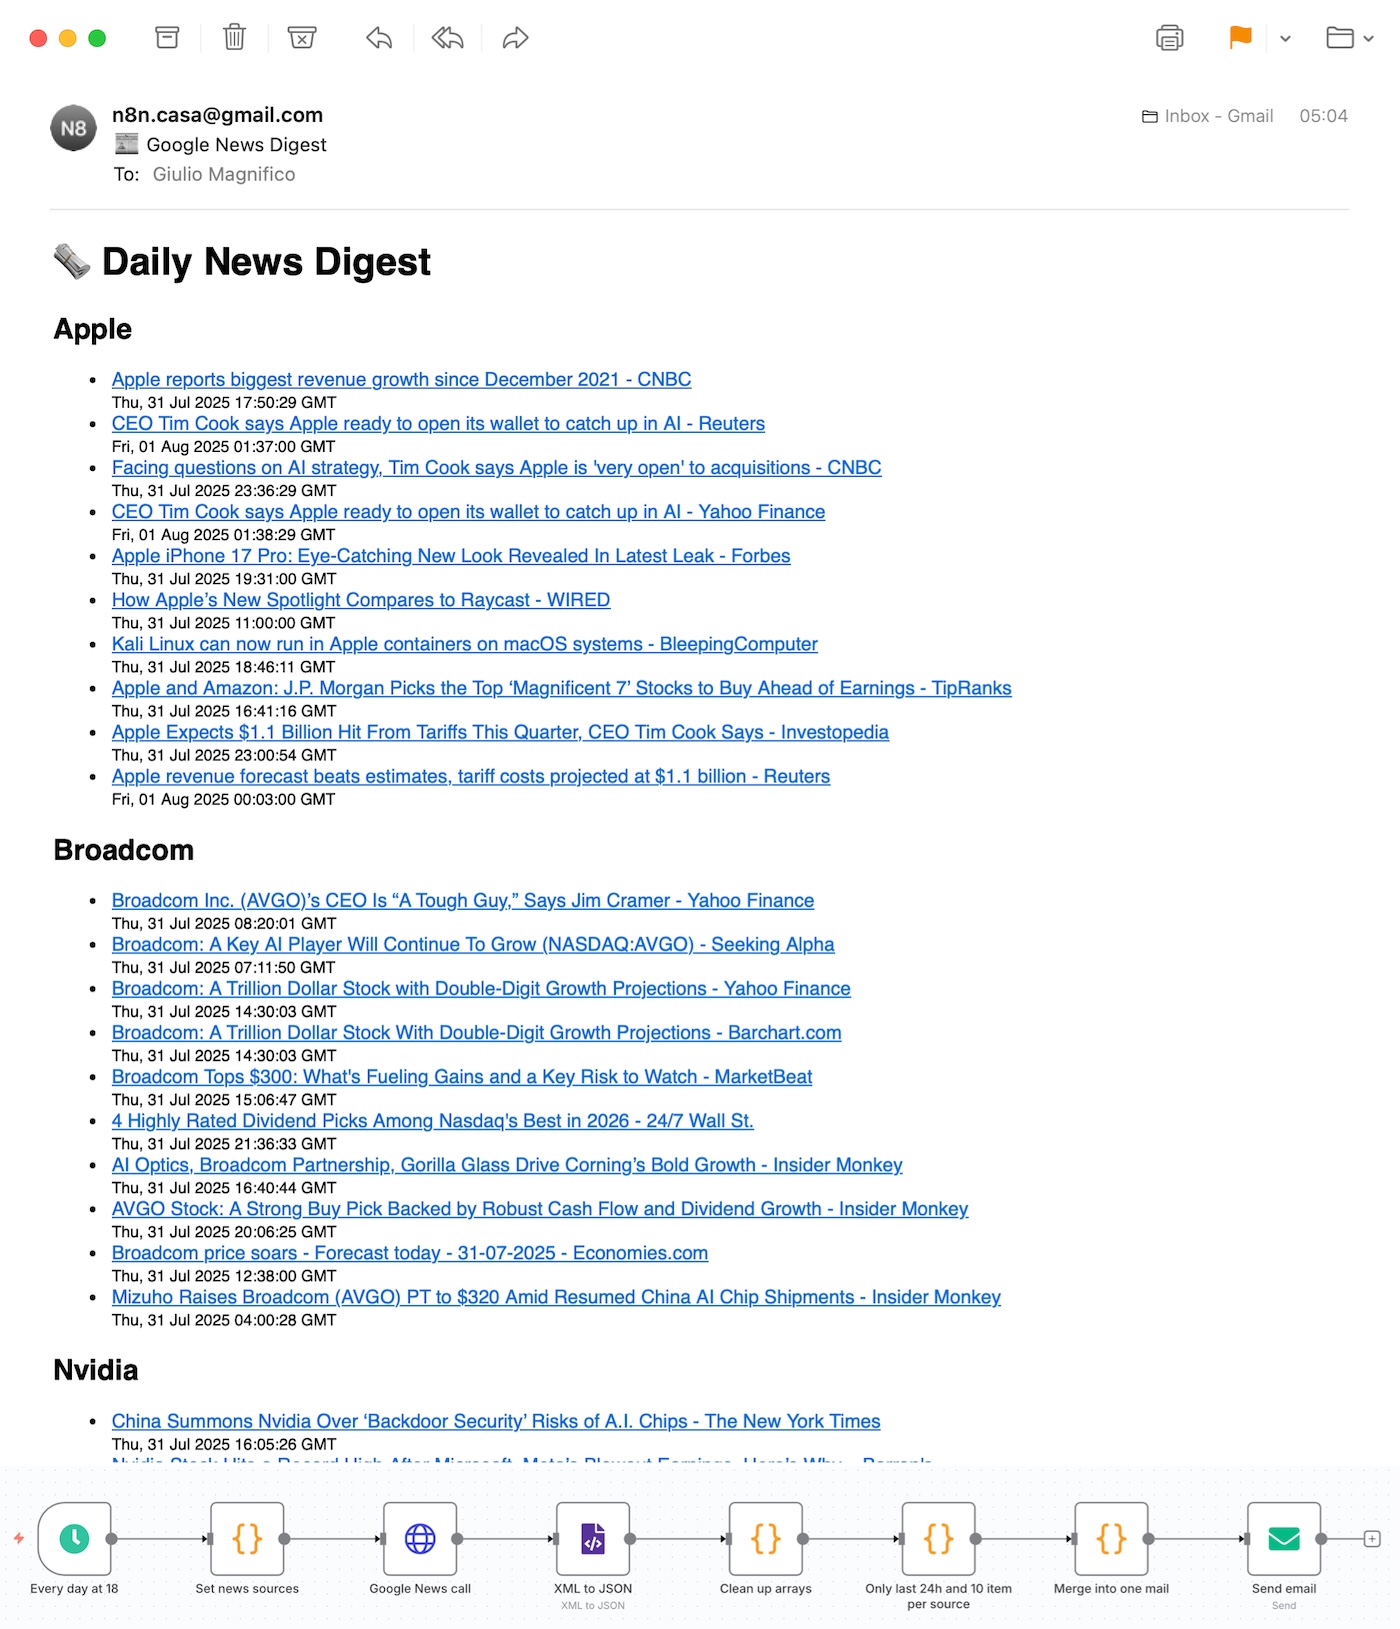
- Daily summary of news on specific keywords/argument via Google News
New post on Reddit on a specific subreddit:
The summary of the 20 posts on the front page of Hacker News is sent to me every day at 18:00 and it looks like this:
The push notifications for the stock price change:
The daily summary of the articles related to a specific stock:
The daily summary of the Google News articles to a specific query:
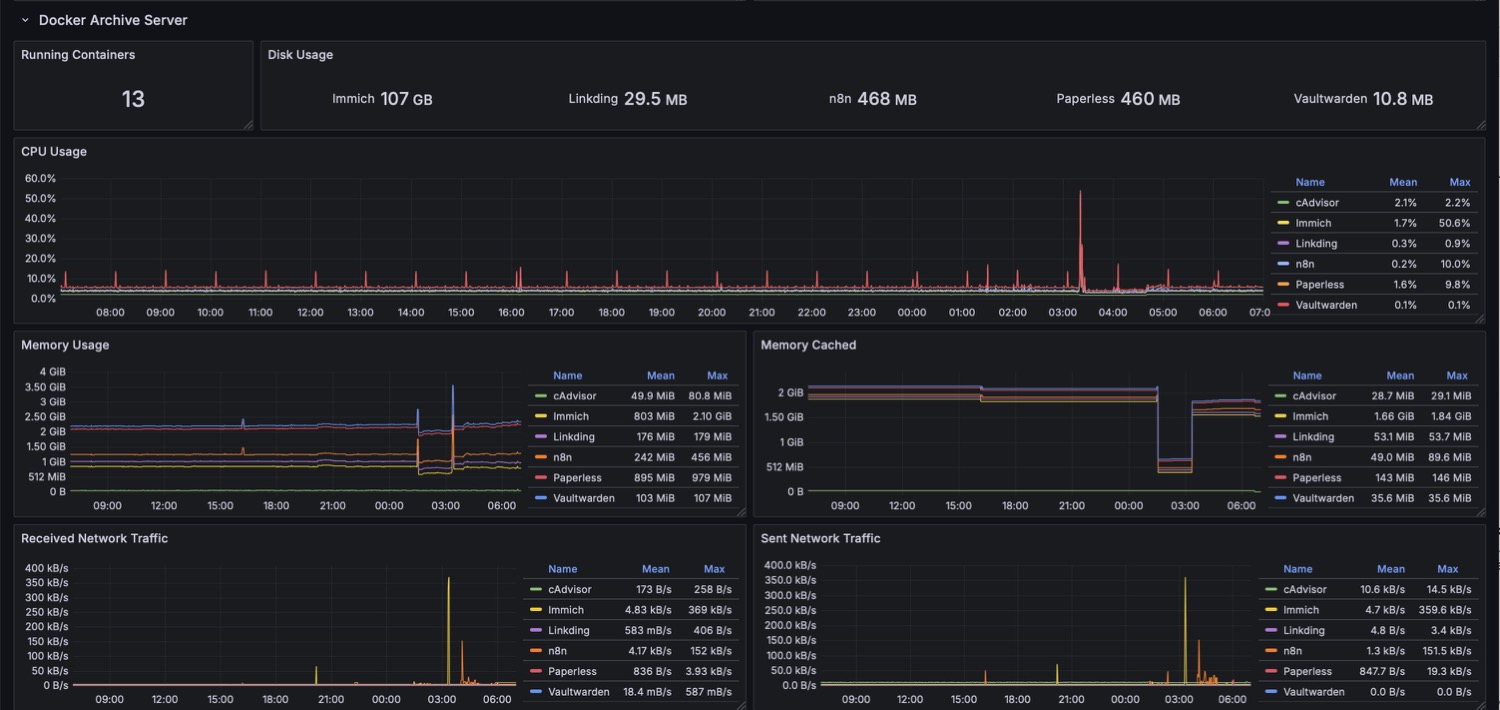
Docker Grafana stat
After deciding to use only Docker containers on the Archive server, to avoid the stress and complexity of installing and maintaining services manually, I chose to monitor them using the Prometheus exporter cAdvisor. With a few tweaks to an existing Grafana dashboard, I managed to build this useful and clean visualization:
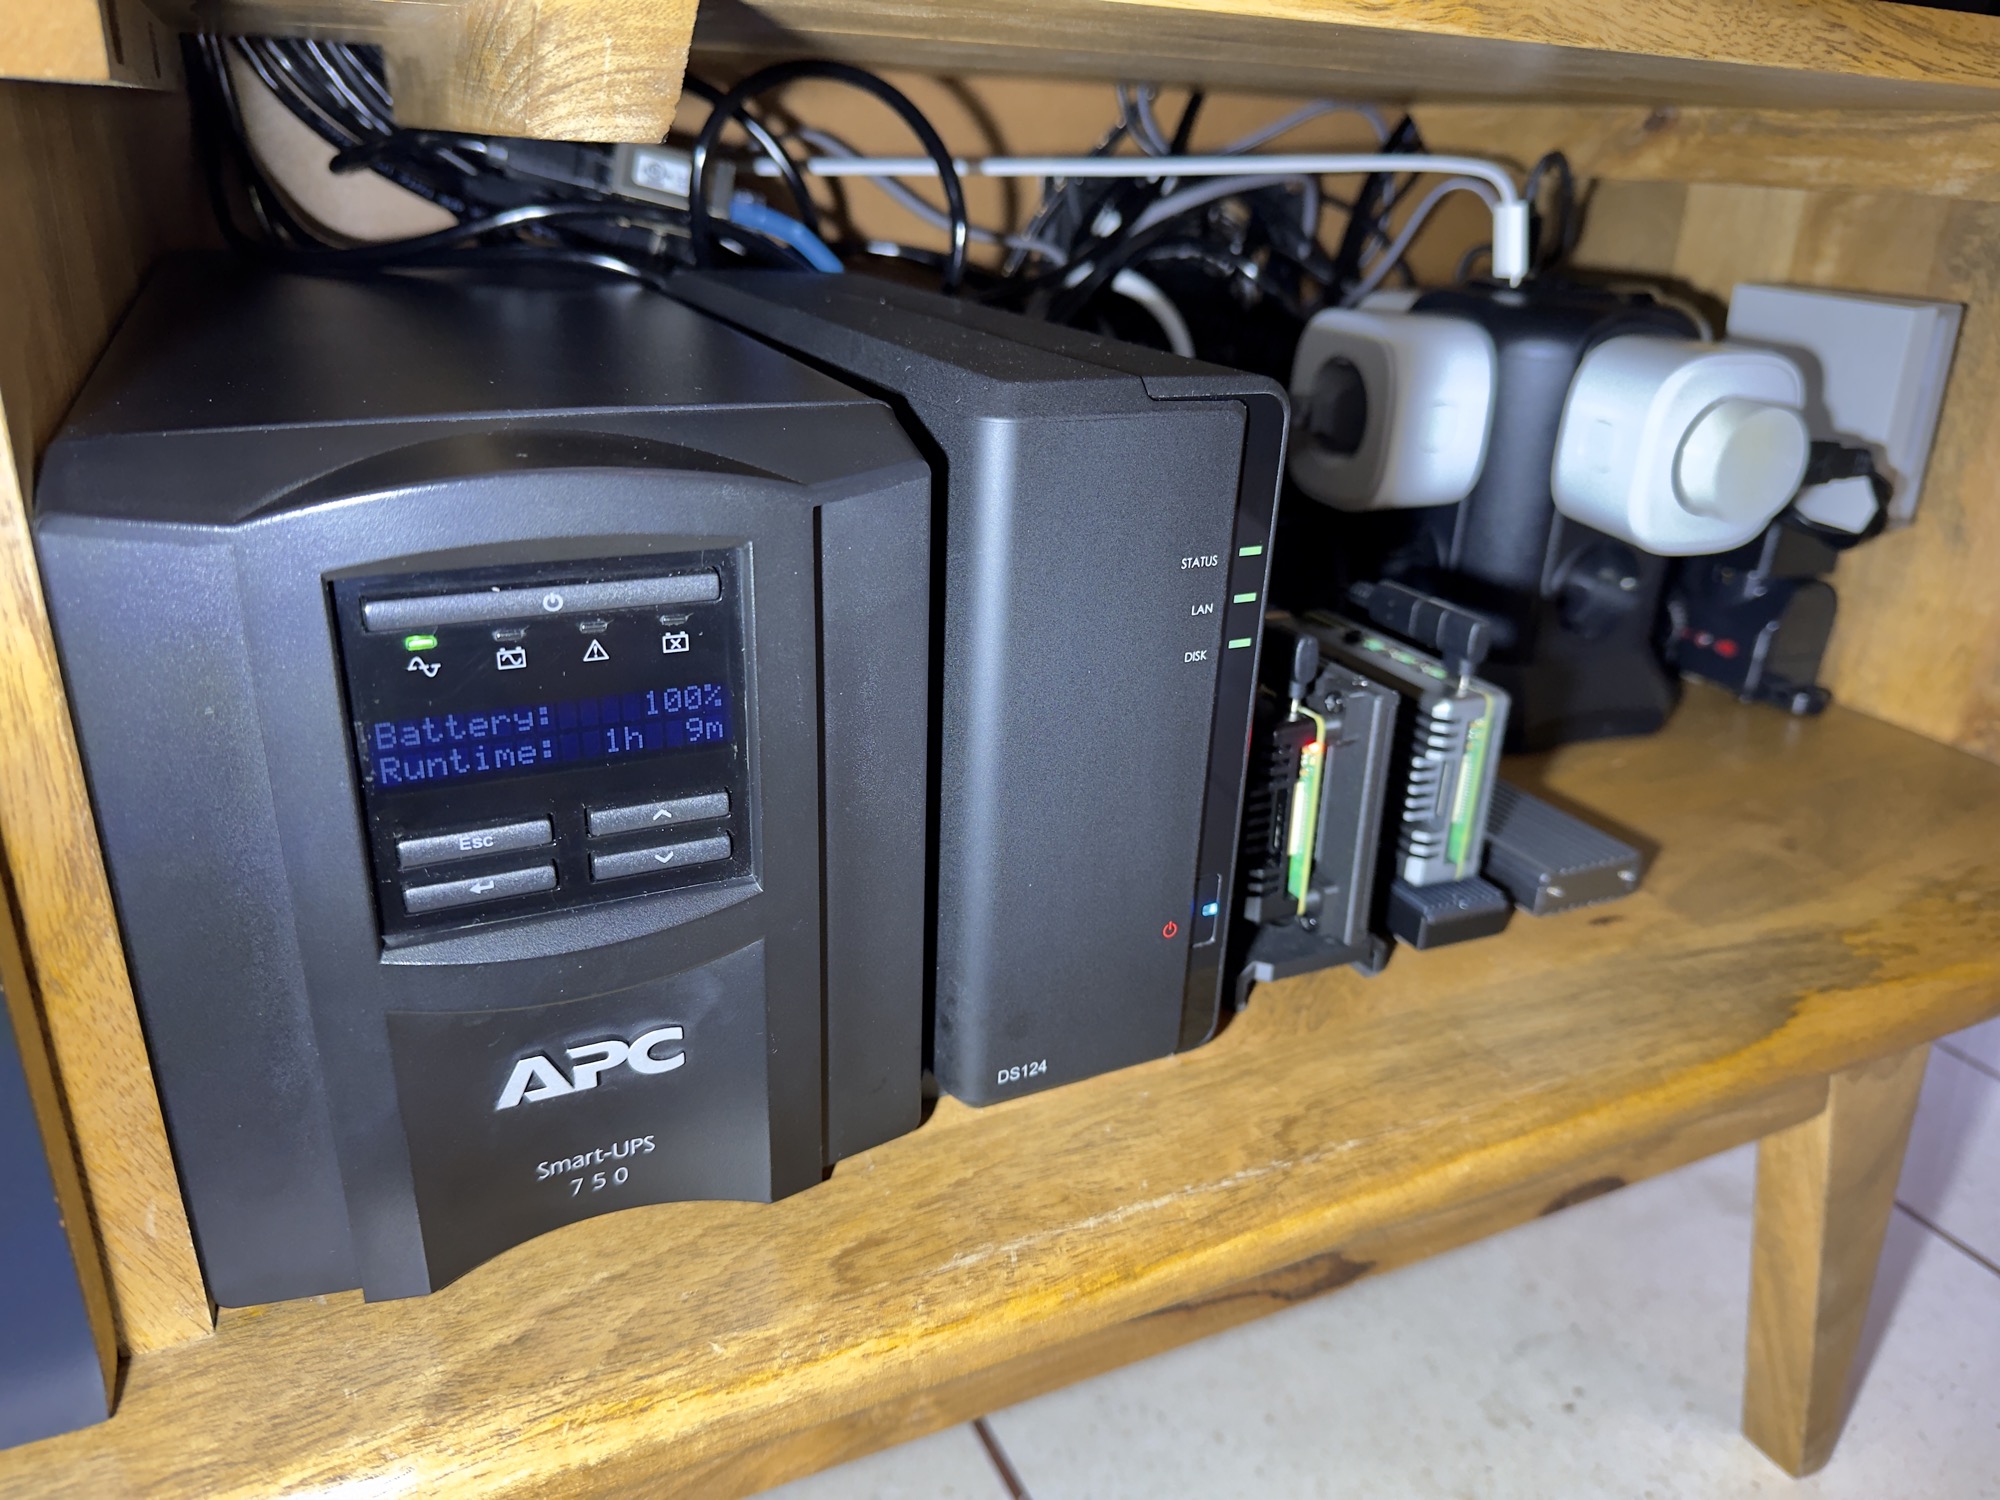
UPS APC SMT-750I monitored via SNMP
For this “story” I wrote a post: Monitoring the UPS APC SMT-750.
Tl;dr: I initially considered replacing my UPS with a basic model and monitoring it via USB, but I ended up with a more advanced unit with an external network card, monitored via SNMP:
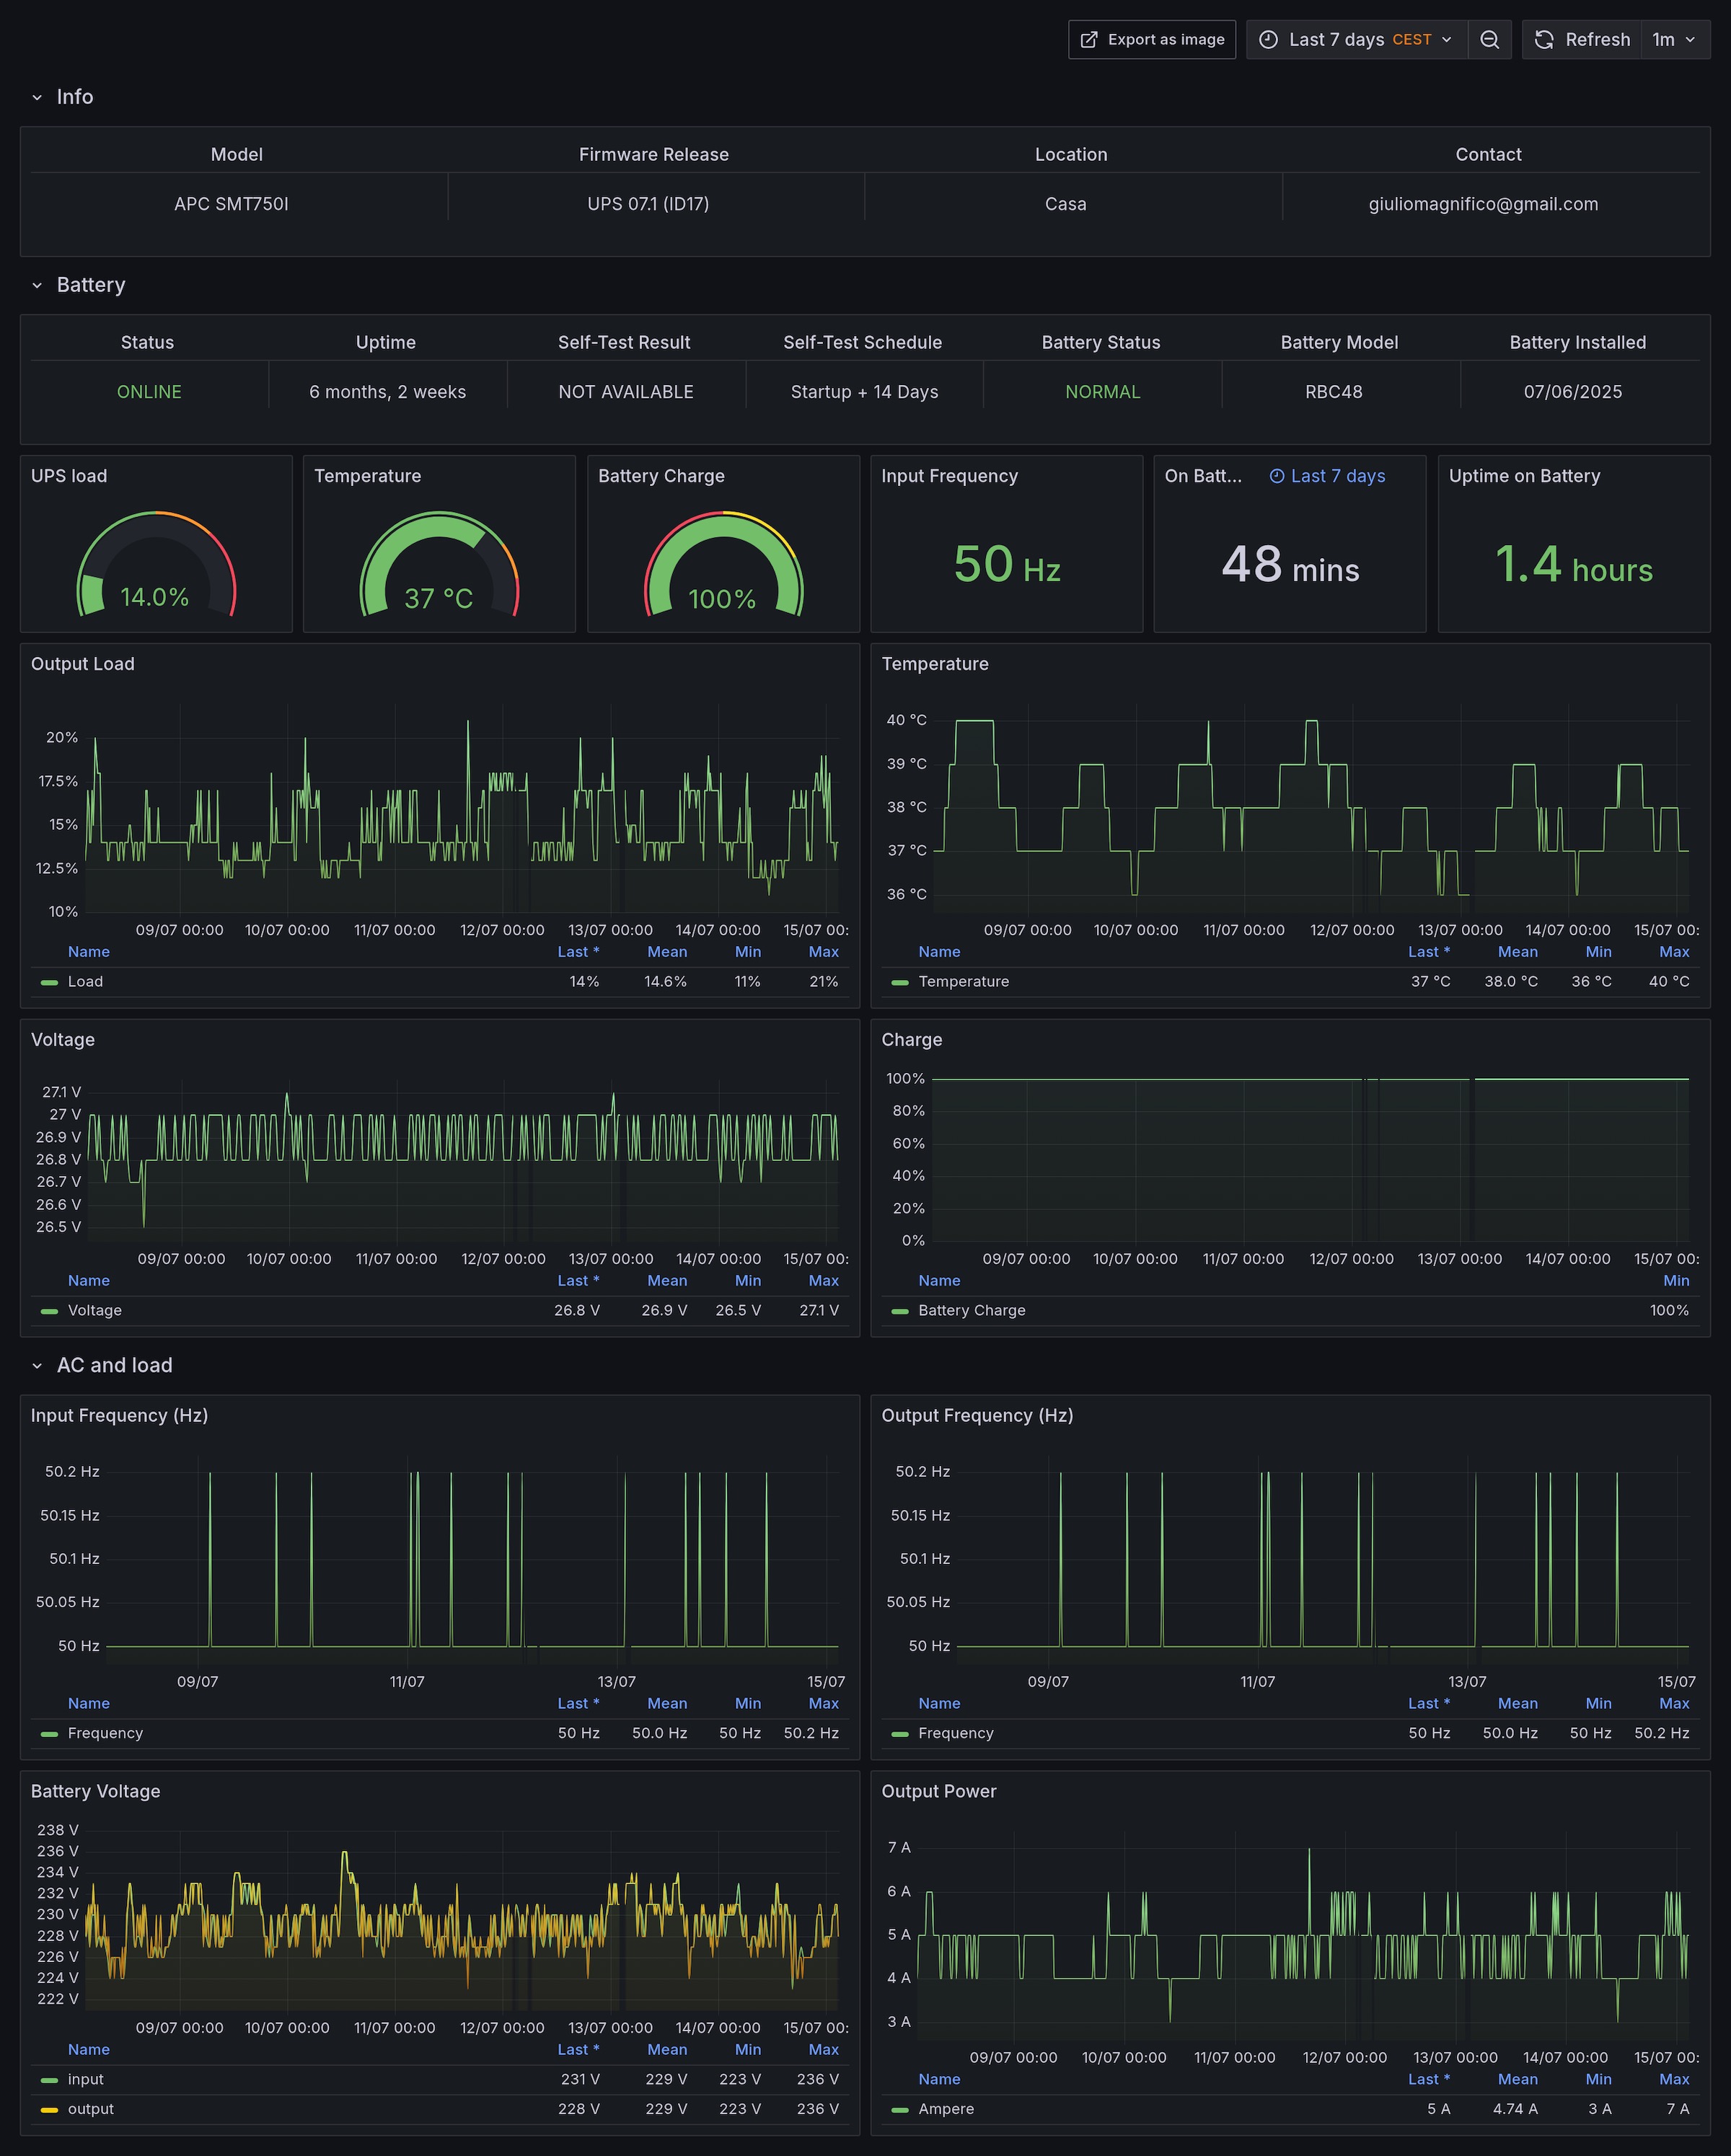
I’m satisfied with this UPS setup, even if it’s definitely over-engineered for a home environment, I learned a lot in the process. If you’re interested, the linked above post includes all the details and configuration.
piArtFrame(s) digital paints
These two are the piArtFrame frames (link) that I ported to C++. One uses the Mandelbrot set, and the other the Julia set.
I wrote a detailed post about these: cPiArtFrame. At the moment they generate a new fractal every hour, and I have placed one on the desk and one in the living room.

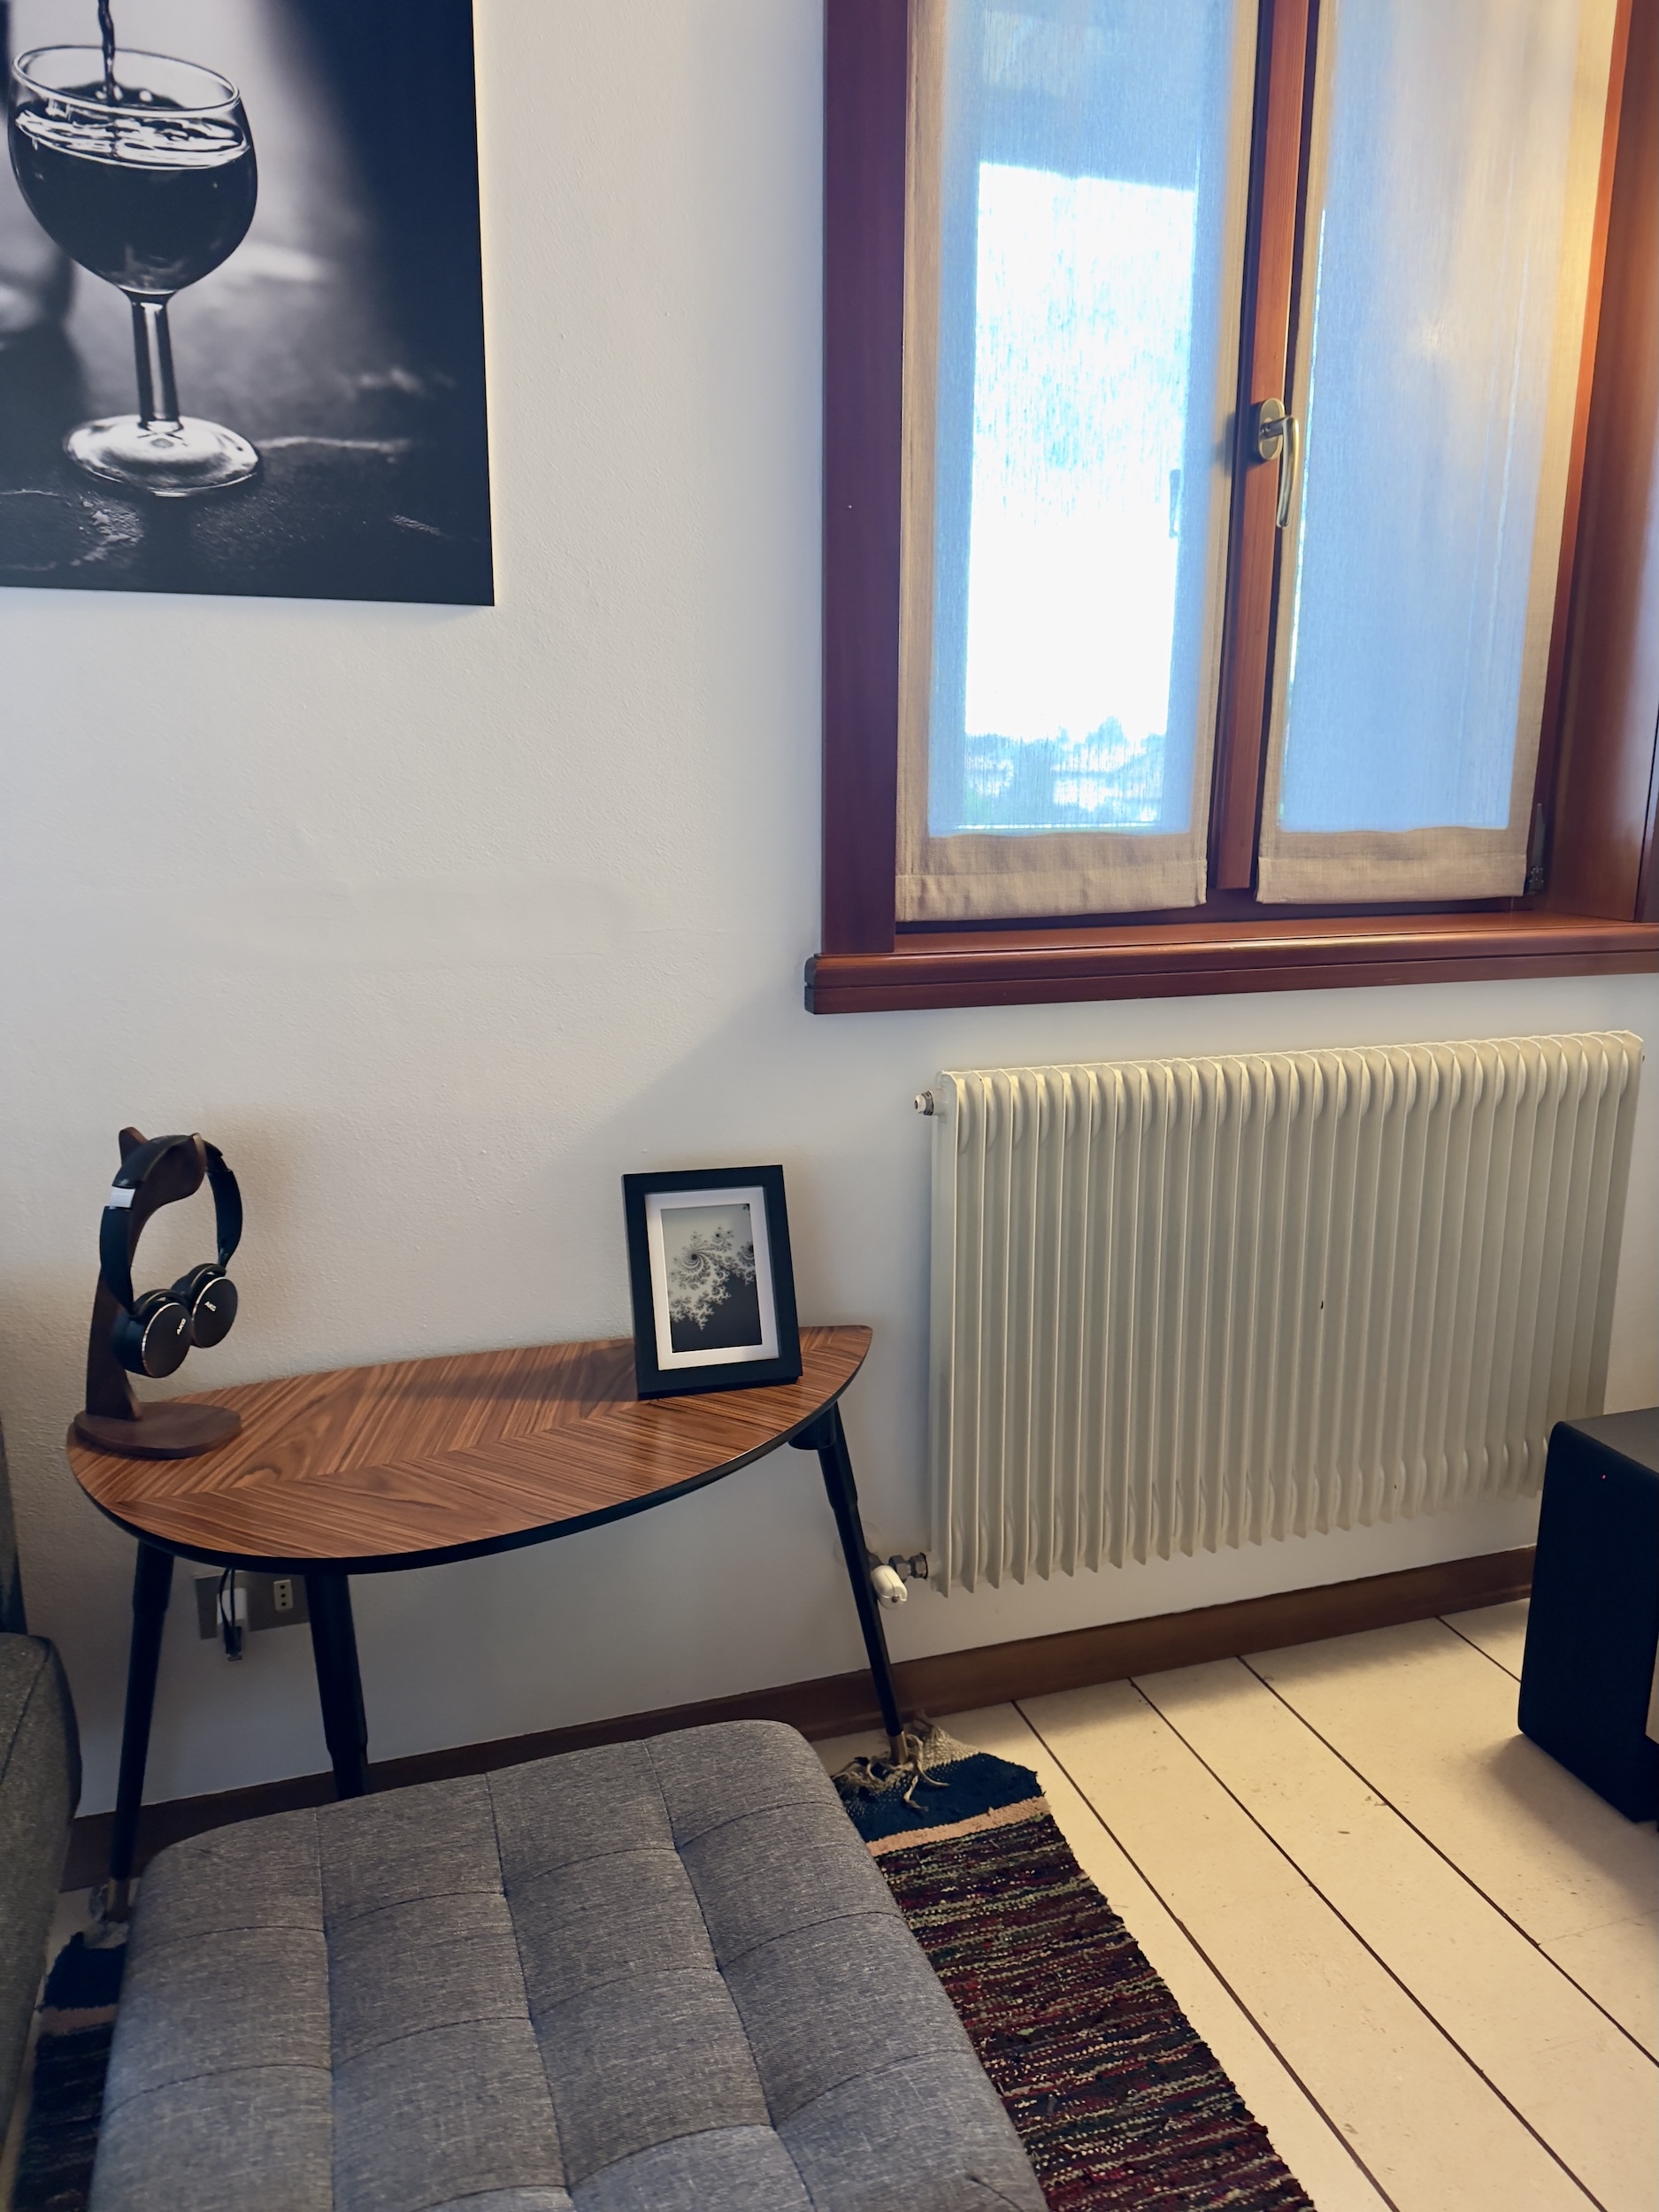
And -obviously- I’m also monitoring both in Grafana, with some alerts in case something got stuck or broken or the temperatures get too high.
If you wonder about the energy consumption, it’s low, very low, about 1/1,5W, so they can stay always on without any impact on the bill.
iPad Pro M2
I replaced my old 2018 iPad Pro with the new M2 iPad Pro, but not because the old one wasn’t working. In fact, for my typical use (browsing and reading the news while eating), it was still perfectly fine. The main reason I upgraded was this:
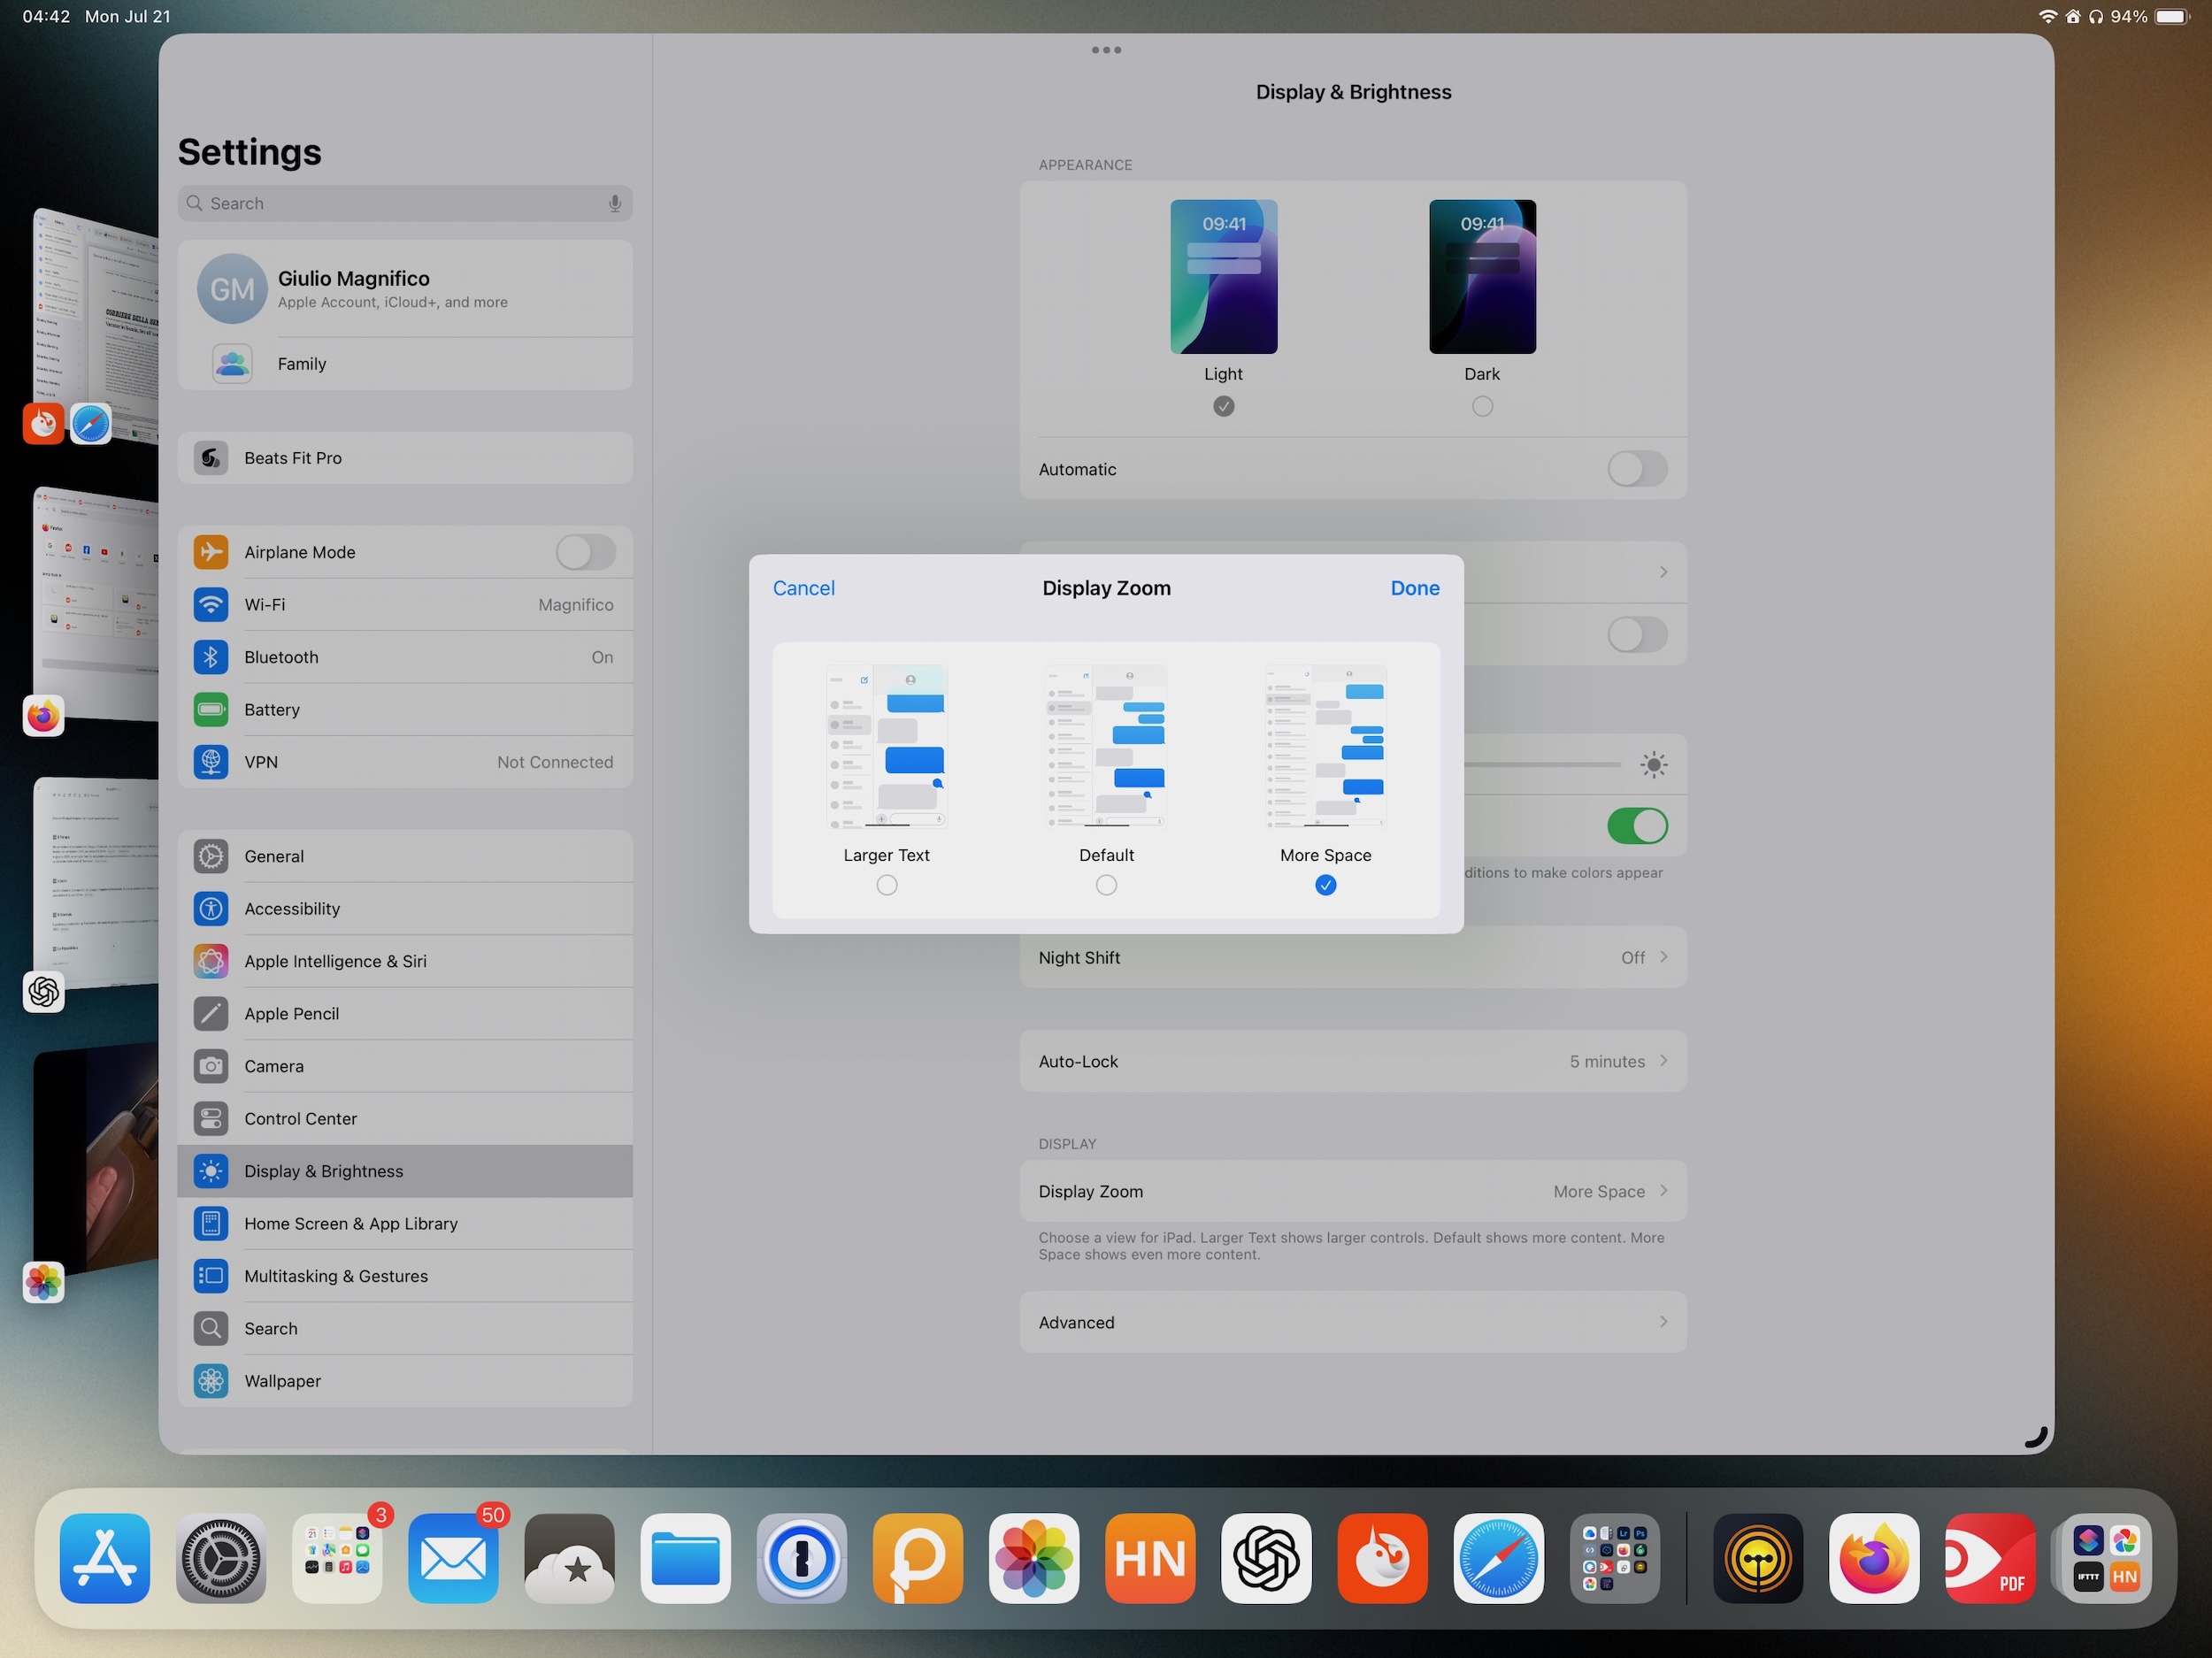
…the ability to use the “HiDPI” interface.
By enabling a higher resolution, everything appears smaller on screen, which means more usable space and more content can fits (this option it’s available only on “M iPads”).
I really dislike “large” interfaces with oversized fonts and UI elements, as they waste valuable screen space that could be used for actual content. I use the highest available resolution on both my MacBook Air and the Apple Studio Display.
The new iPad Pro is very powerful and I even found an Apple Pencil 2 on the street, which supports new features like hover preview (though I’ve practically never used it and honestly would never have bought it myself).
I bought the “Pro” for the refresh rate (ProMotion display) because I primarily use it to read news, RSS feeds, Hacker News, Reddit, etc., and the ProMotion display makes a difference for this. Face ID is another useful feature, though less essential.
A convenient thing I did was to bring a long power cable to the iPad, because sometimes I forget to recharge it, and during breakfast or lunch, I sit down and found the battery empty… Now, if I forget to charge it, the cable is nearby.
HomePod(s)
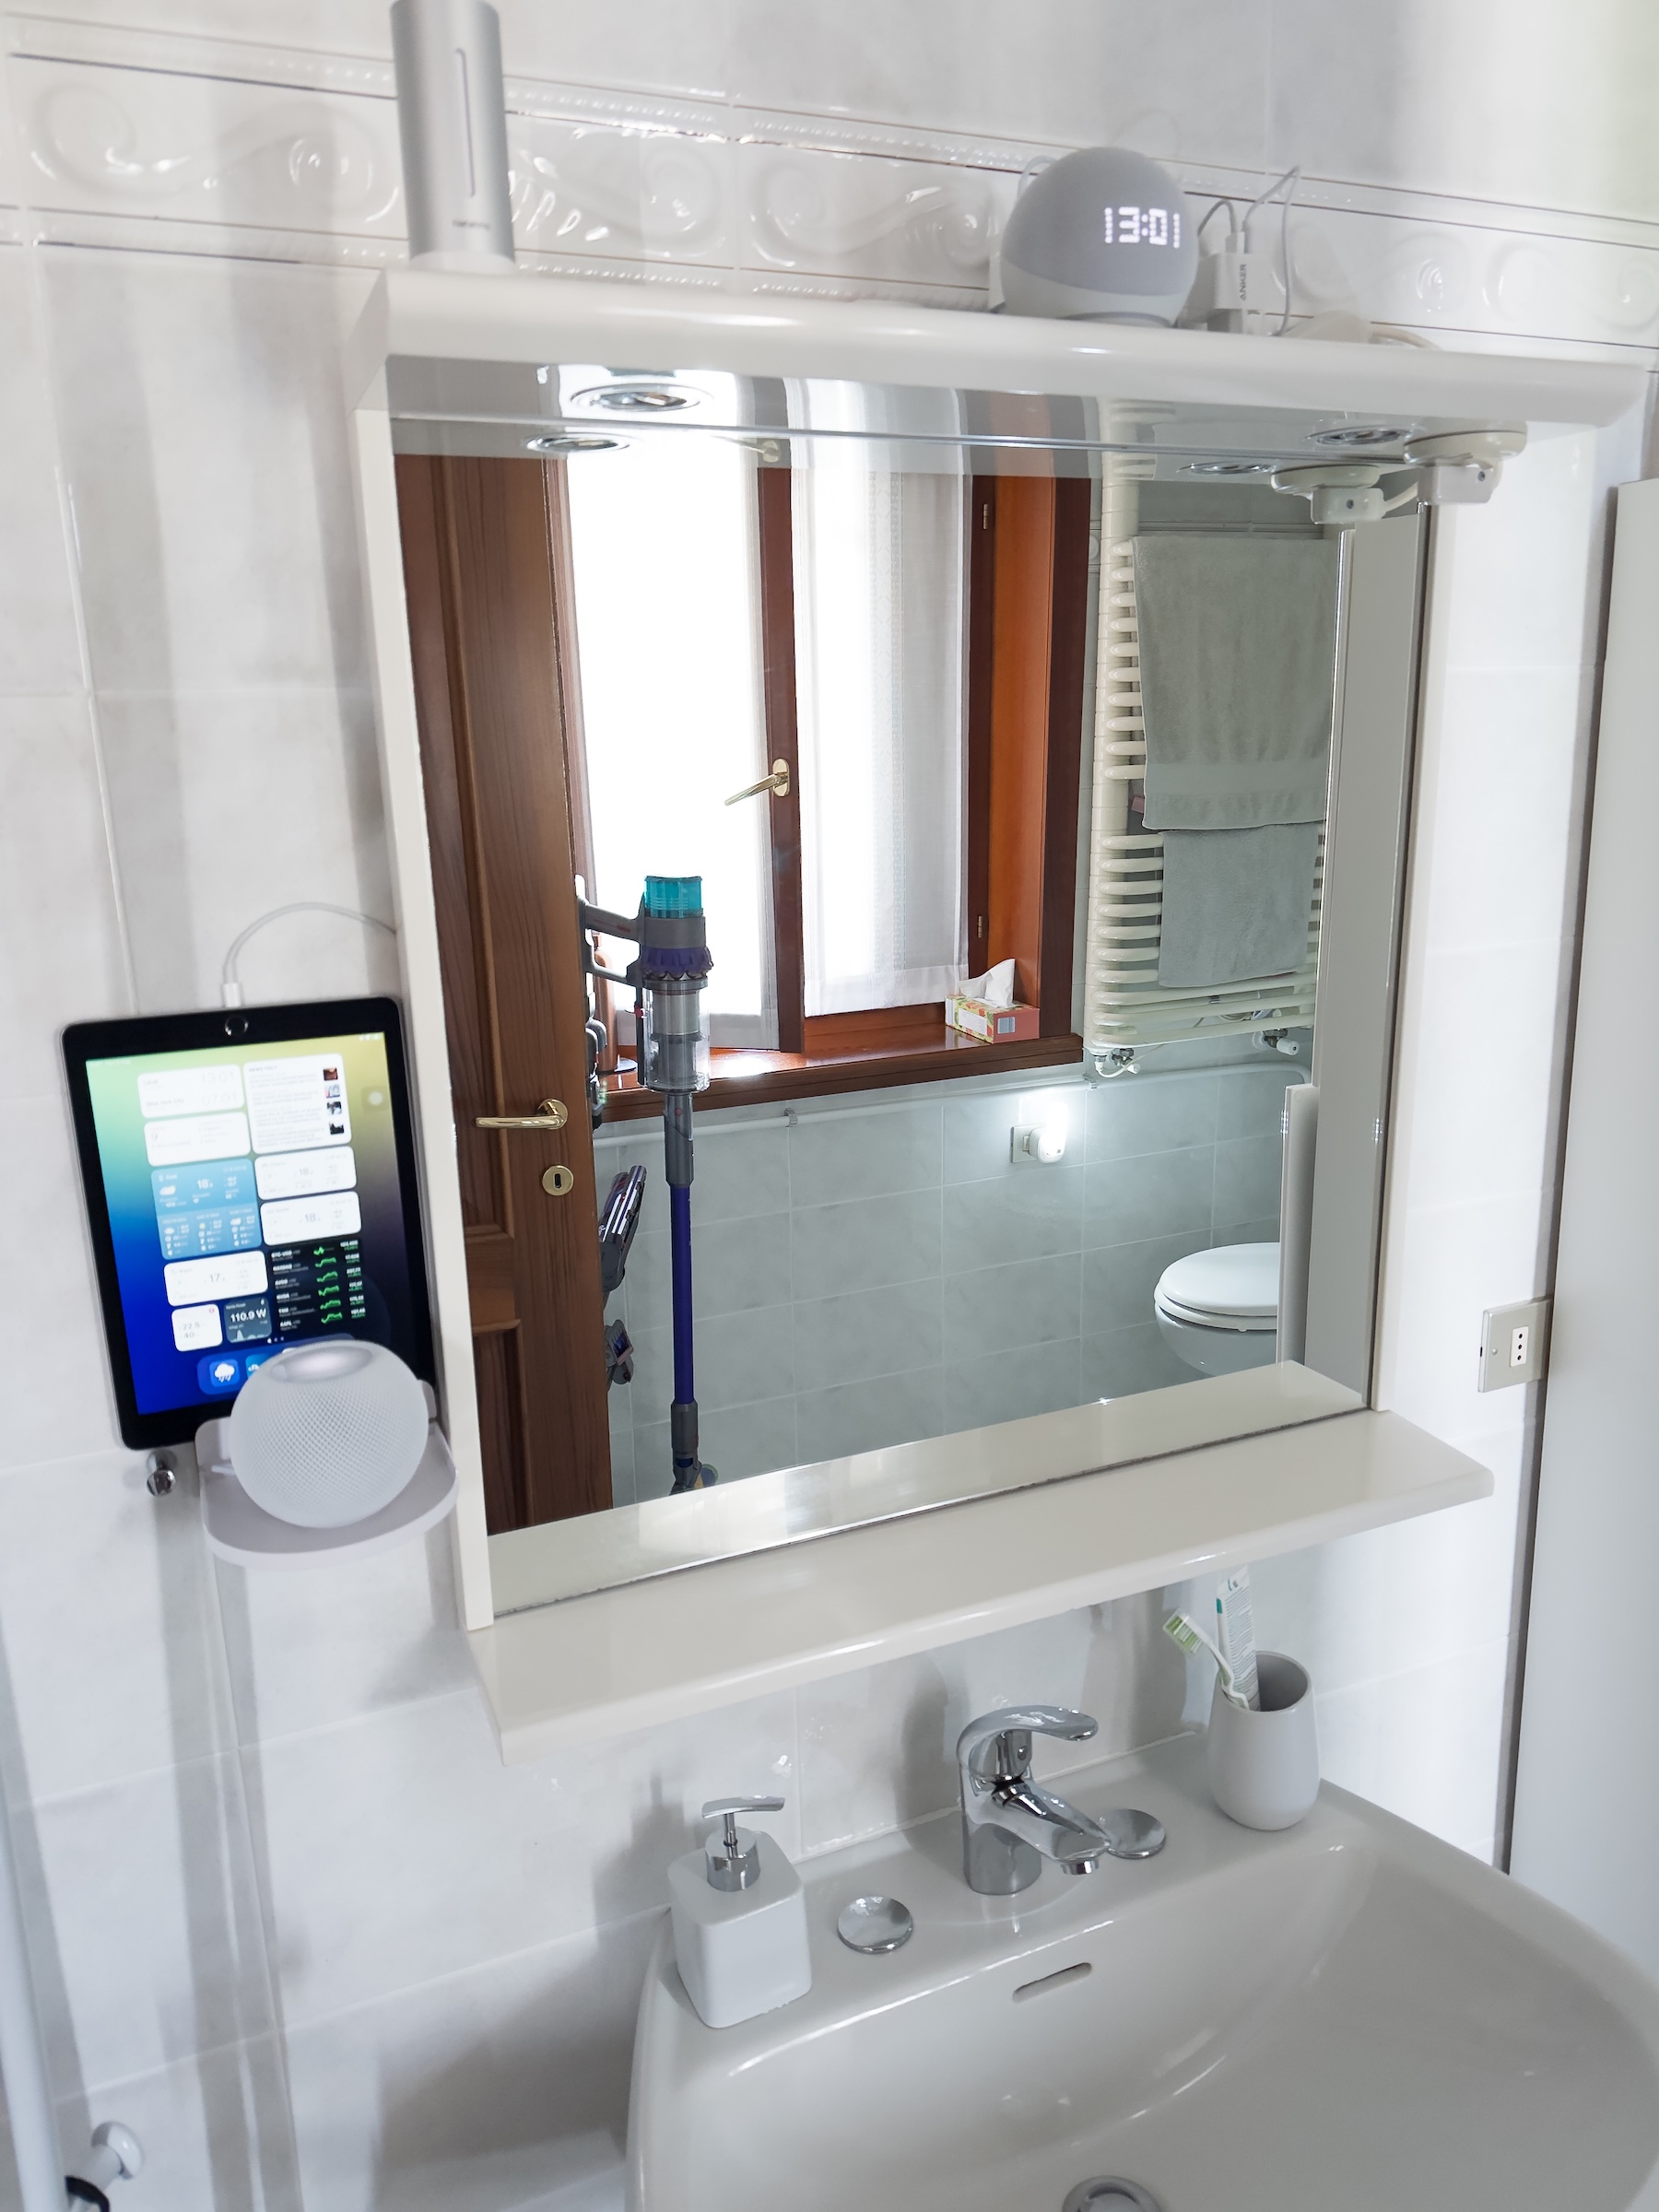
Regarding the HomePods, which I love, I finally managed to do something important for me: listen to my personalized streams (custom URLs) simultaneously on all of them. Consequently, I decided to get two new HomePod Minis, one white and one black.
The white one I placed in the bathroom:
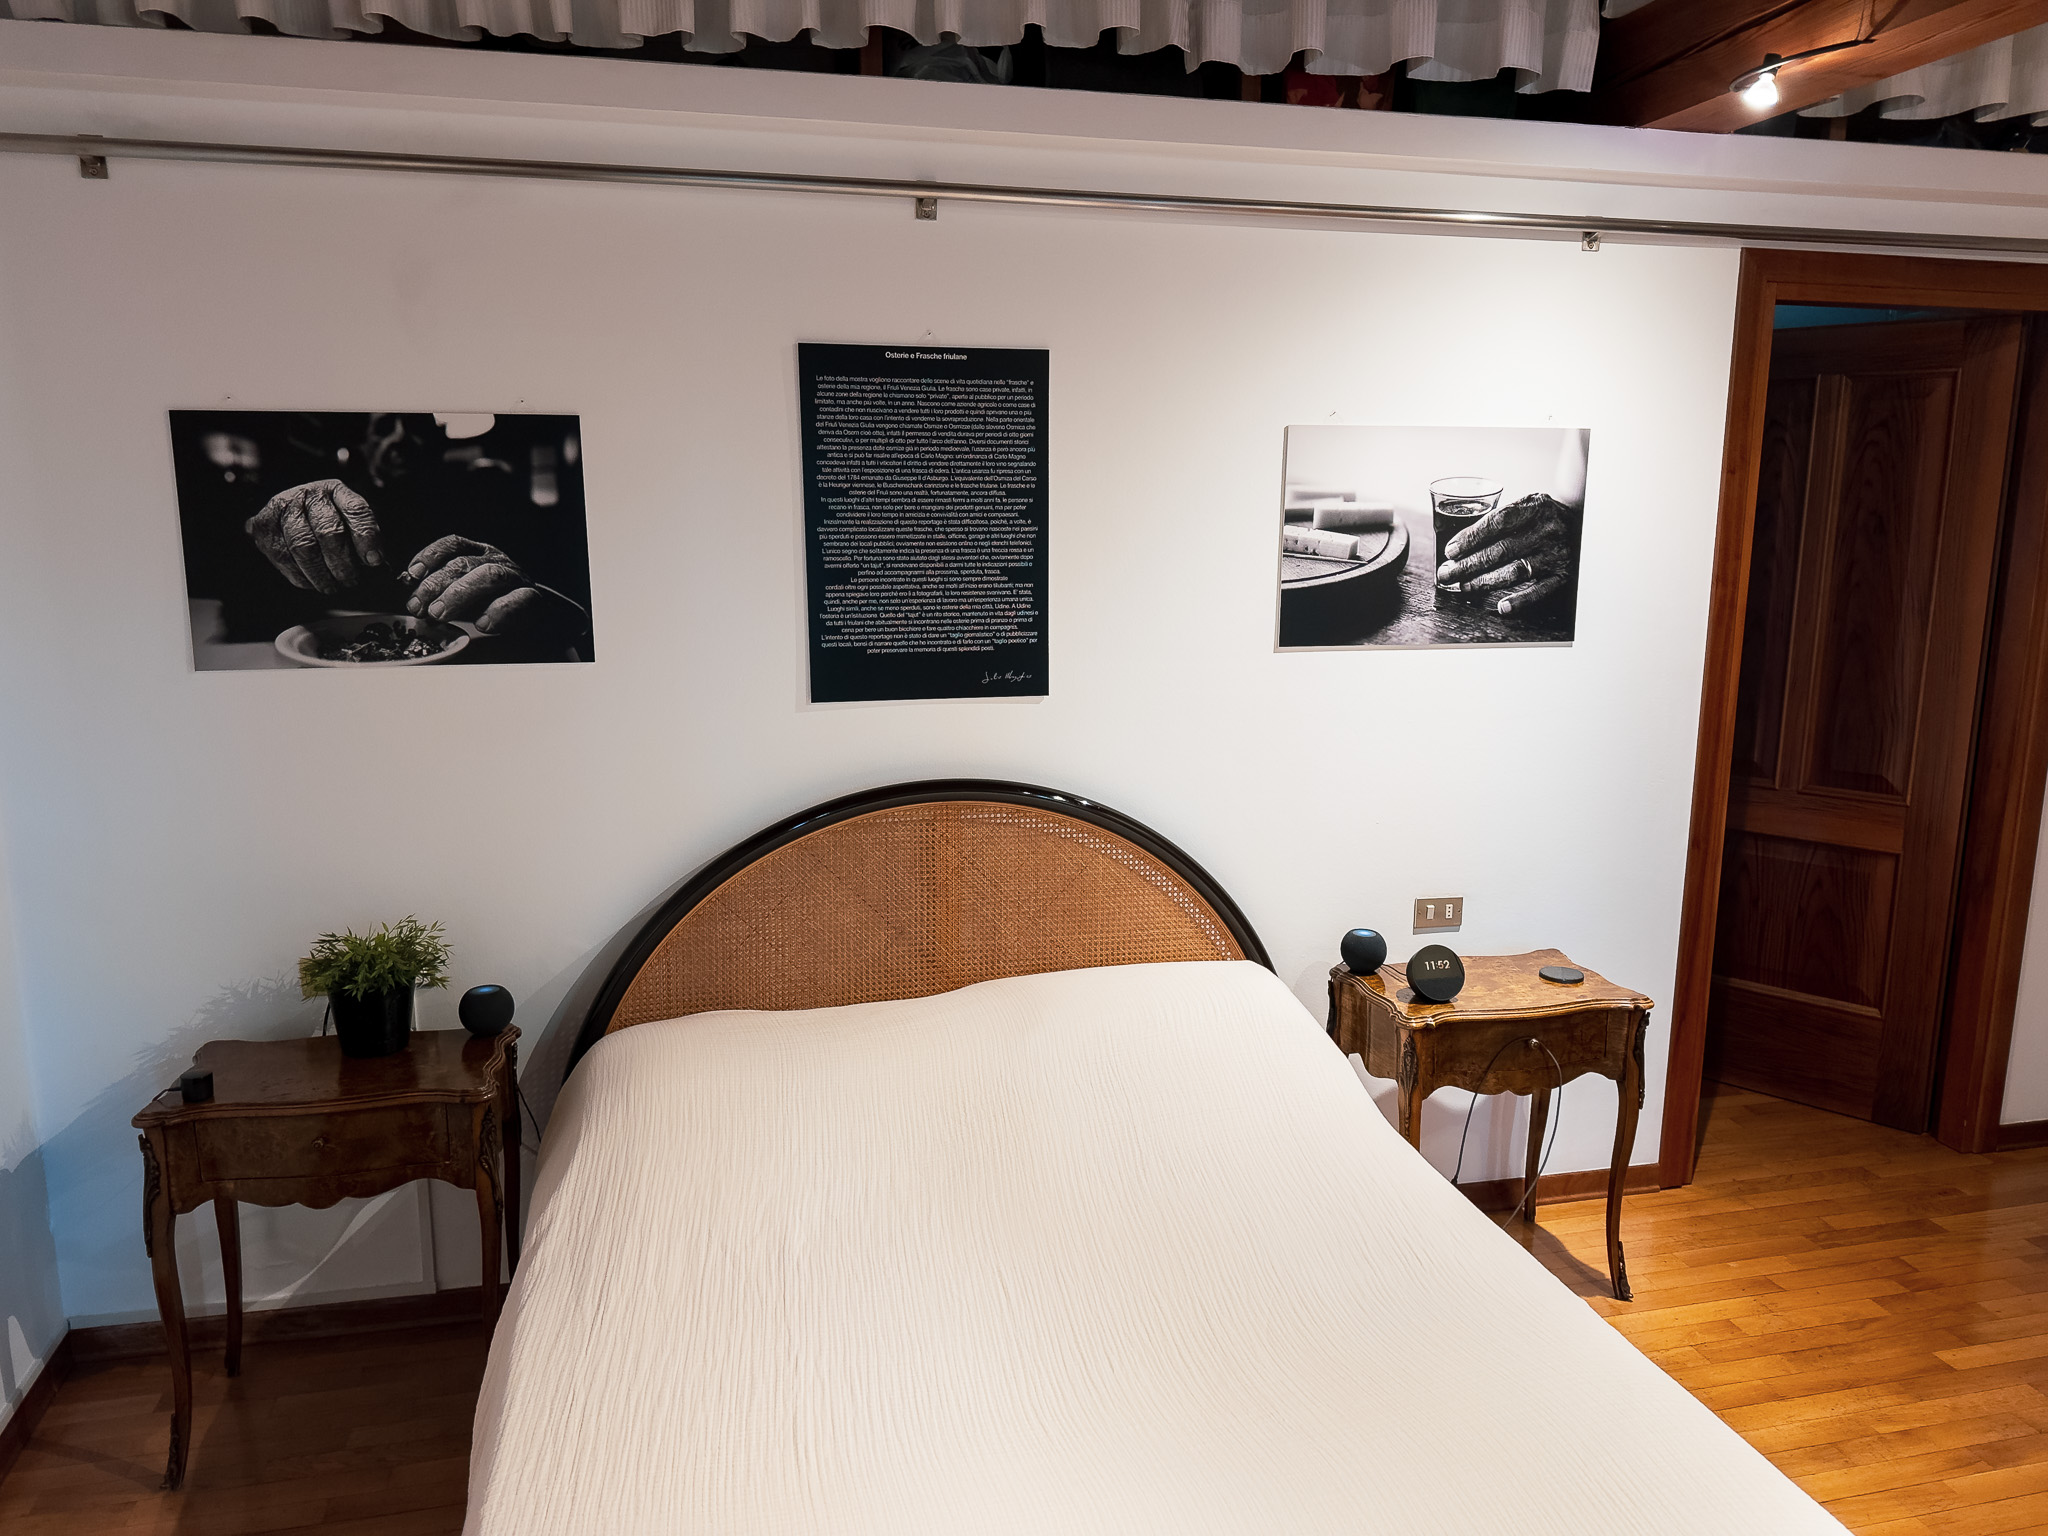
The black one, or rather the black ones, are on either side of the bed in stereo, so I can listen to music and movies in stereo when I’m in bed.
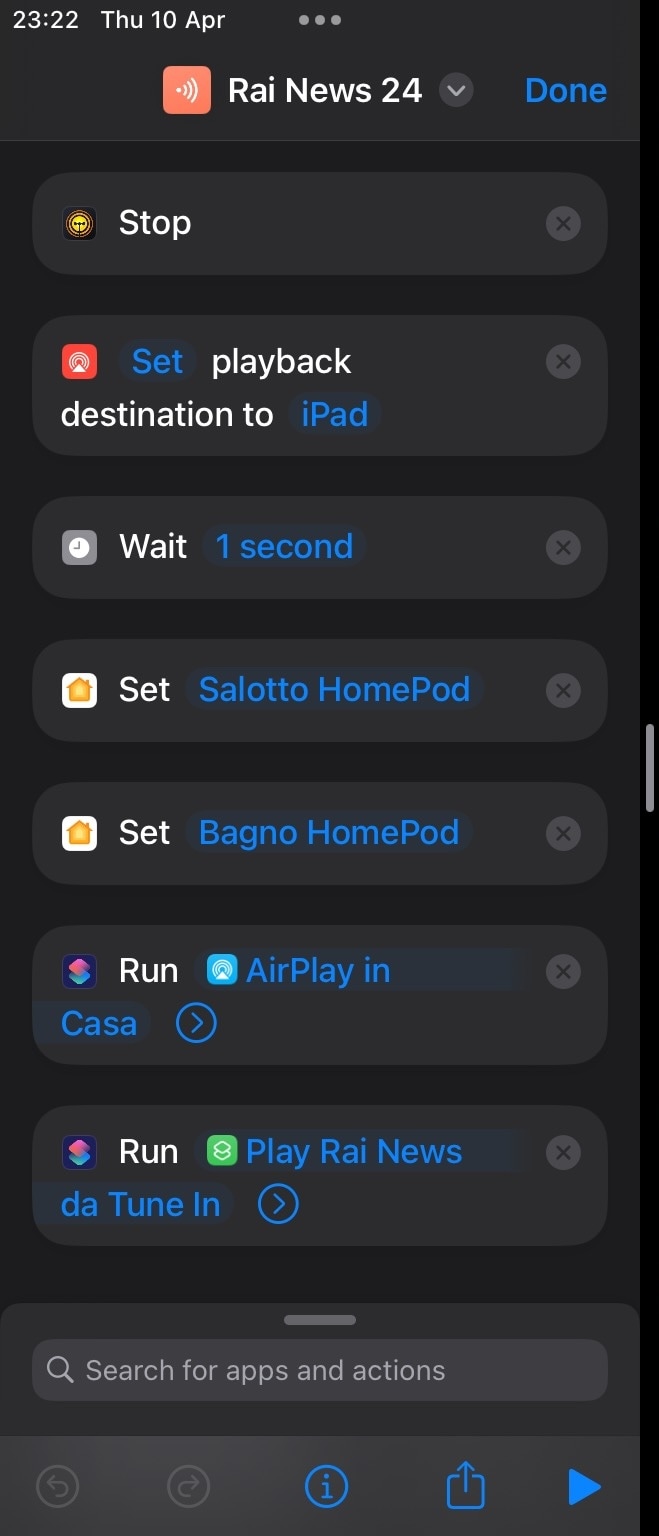
Im able to listen custom stream over all the house thanks to this app I discovered: Triode from the legendary iconfactory.
The application allows custom URLs for streams, which isn’t new, but it also includes Shortcuts actions to start your personalized station directly from a Shortcut. So I created a Shortcut that plays my custom stations throughout the HomePods in the house and when I enter home, I can tap on the Shortcut to listen to Italian all-news TV channel streams like Rai News 24, Sky TG24, and other streams that aren’t available via the regular radio apps.
Here’s the shortcut:
Grafana improvments
I modified the main Grafana dashboard and now I have a better view of everything. Also, thanks to the really smooth scrolling of the new miniPC kiosk and high resolution of the 4K kiosk display, I can scroll without problems to see all the data.
I also I added a cool Prometheus exporter for OpenWrt that monitors traffic and rules on nftables, This is the dashboard created and if you want, I have put everything on GitHub: giuliomagnifico/openwrt-nftables_exporter
Logs and Backups
I have consolidated all logs from all devices into a single Grafana dashboard using rsyslog: each server sends logs to the Grafana server, and via rsyslog, Promtail and Loki, the logs are sorted into folders, read by Promtail, and displayed on Grafana.
To direct all logs to the Grafana server, I just added *.* @192.168.1.6:514 to each device in /etc/rsyslog.conf. Grafana then sorts them accordingly to rsyslog.conf on Grafana server.
if $fromhost-ip == ‘192.168.1.4’ then /var/log/server/pihole.log
& stop
Thanks to this and Grafana alerts, I receive push notifications for any log errors, such as when a Homebridge plugin “breaks” (one of the most useful applications so far) or a backup failure occurs.
Backup
I configured a custom backup script, a pure rsync script that checks if the NAS is mounted, mounts it if necessary, starts the backup, deletes older backups and write a log.
Throughout this process, the script writes logs that I monitor via Grafana, and I receive notifications if an error occured;
Here is the script (which I continually update to fix errors):
#!/bin/sh

NAS_IP="192.168.1.8"
NAS_PATH="/volume1/Backups-Network/Archive"
MOUNT_POINT="/mnt/archive_backup"
NOW=$(date +"%Y-%m-%d_%H-%M")
BACKUP_DIR="${MOUNT_POINT}/archive_backup_${NOW}"
LATEST_LINK="${MOUNT_POINT}/latest"
LOG_FILE="/var/log/backup.log"

log() {
  message="[$(date +"%d-%m-%Y %H:%M")] $1"
  echo "$message" | tee -a "$LOG_FILE"
  logger -t archive-backup "$1"
}

mount_NAS() {
  if ! mountpoint -Q "$MOUNT_POINT"; then
    log "⚠️ NAS not mounted, trying to mount it..."
    mkdir -p "$MOUNT_POINT"
    mount -t nfs "${NAS_IP}:${NAS_PATH}" "$MOUNT_POINT"
    sleep 1
  fi

  if ! mountpoint -Q "$MOUNT_POINT" || [ "$(stat -f -c %T "$MOUNT_POINT")" != "nfs" ] && [ "$(stat -f -c %T "$MOUNT_POINT")" != "nfs4" ]; then
    log "❌ ERROR: $MOUNT_POINT is not mounted correctly, abort the backup"
    exit 1
  fi

  log "✅ NAS correctly mounted on /mnt"
}

run_backup() {
  log "Start full backup in $BACKUP_DIR"
  mkdir -p "$BACKUP_DIR"

  if [ -d "$LATEST_LINK" ]; then
    LINK_DEST_OPT="--link-dest=$LATEST_LINK"
  else
    LINK_DEST_OPT=""
  fi

  rsync -a --delete \
    --exclude=/proc \
    --exclude=/sys \
    --exclude=/dev \
    --exclude=/run \
    --exclude=/mnt \
    --exclude=/media \
    --exclude=/lost+found \
    --exclude=/tmp \
    $LINK_DEST_OPT \
    /etc /home /usr /var /root /bin "$BACKUP_DIR" >> "$LOG_FILE" 2>&1

  RSYNC_EXIT_CODE=$?
  if [ "$RSYNC_EXIT_CODE" -ne 0 ]; then
    log "❌ rsync failed with exit code $RSYNC_EXIT_CODE, aborting"
    exit 1
  fi

  rm -f "$LATEST_LINK"
  ln -s "$BACKUP_DIR" "$LATEST_LINK"

  log "✅ Archive backup completed in $BACKUP_DIR"
}

clean_old_backups() {
  log "🧹 Cleaning the old backups (keep 2 latest)..."
  ls -1dt "$MOUNT_POINT"/archive_backup_* | tail -n +3 | while read old; do
    rm -rf "$old"
    echo "🗑️ Removed: $old" >> "$LOG_FILE"
  done
}

log "🔁 Start daily Archive backup"
mount_NAS
run_backup
clean_old_backups
log "🏁 Archive backup completed"
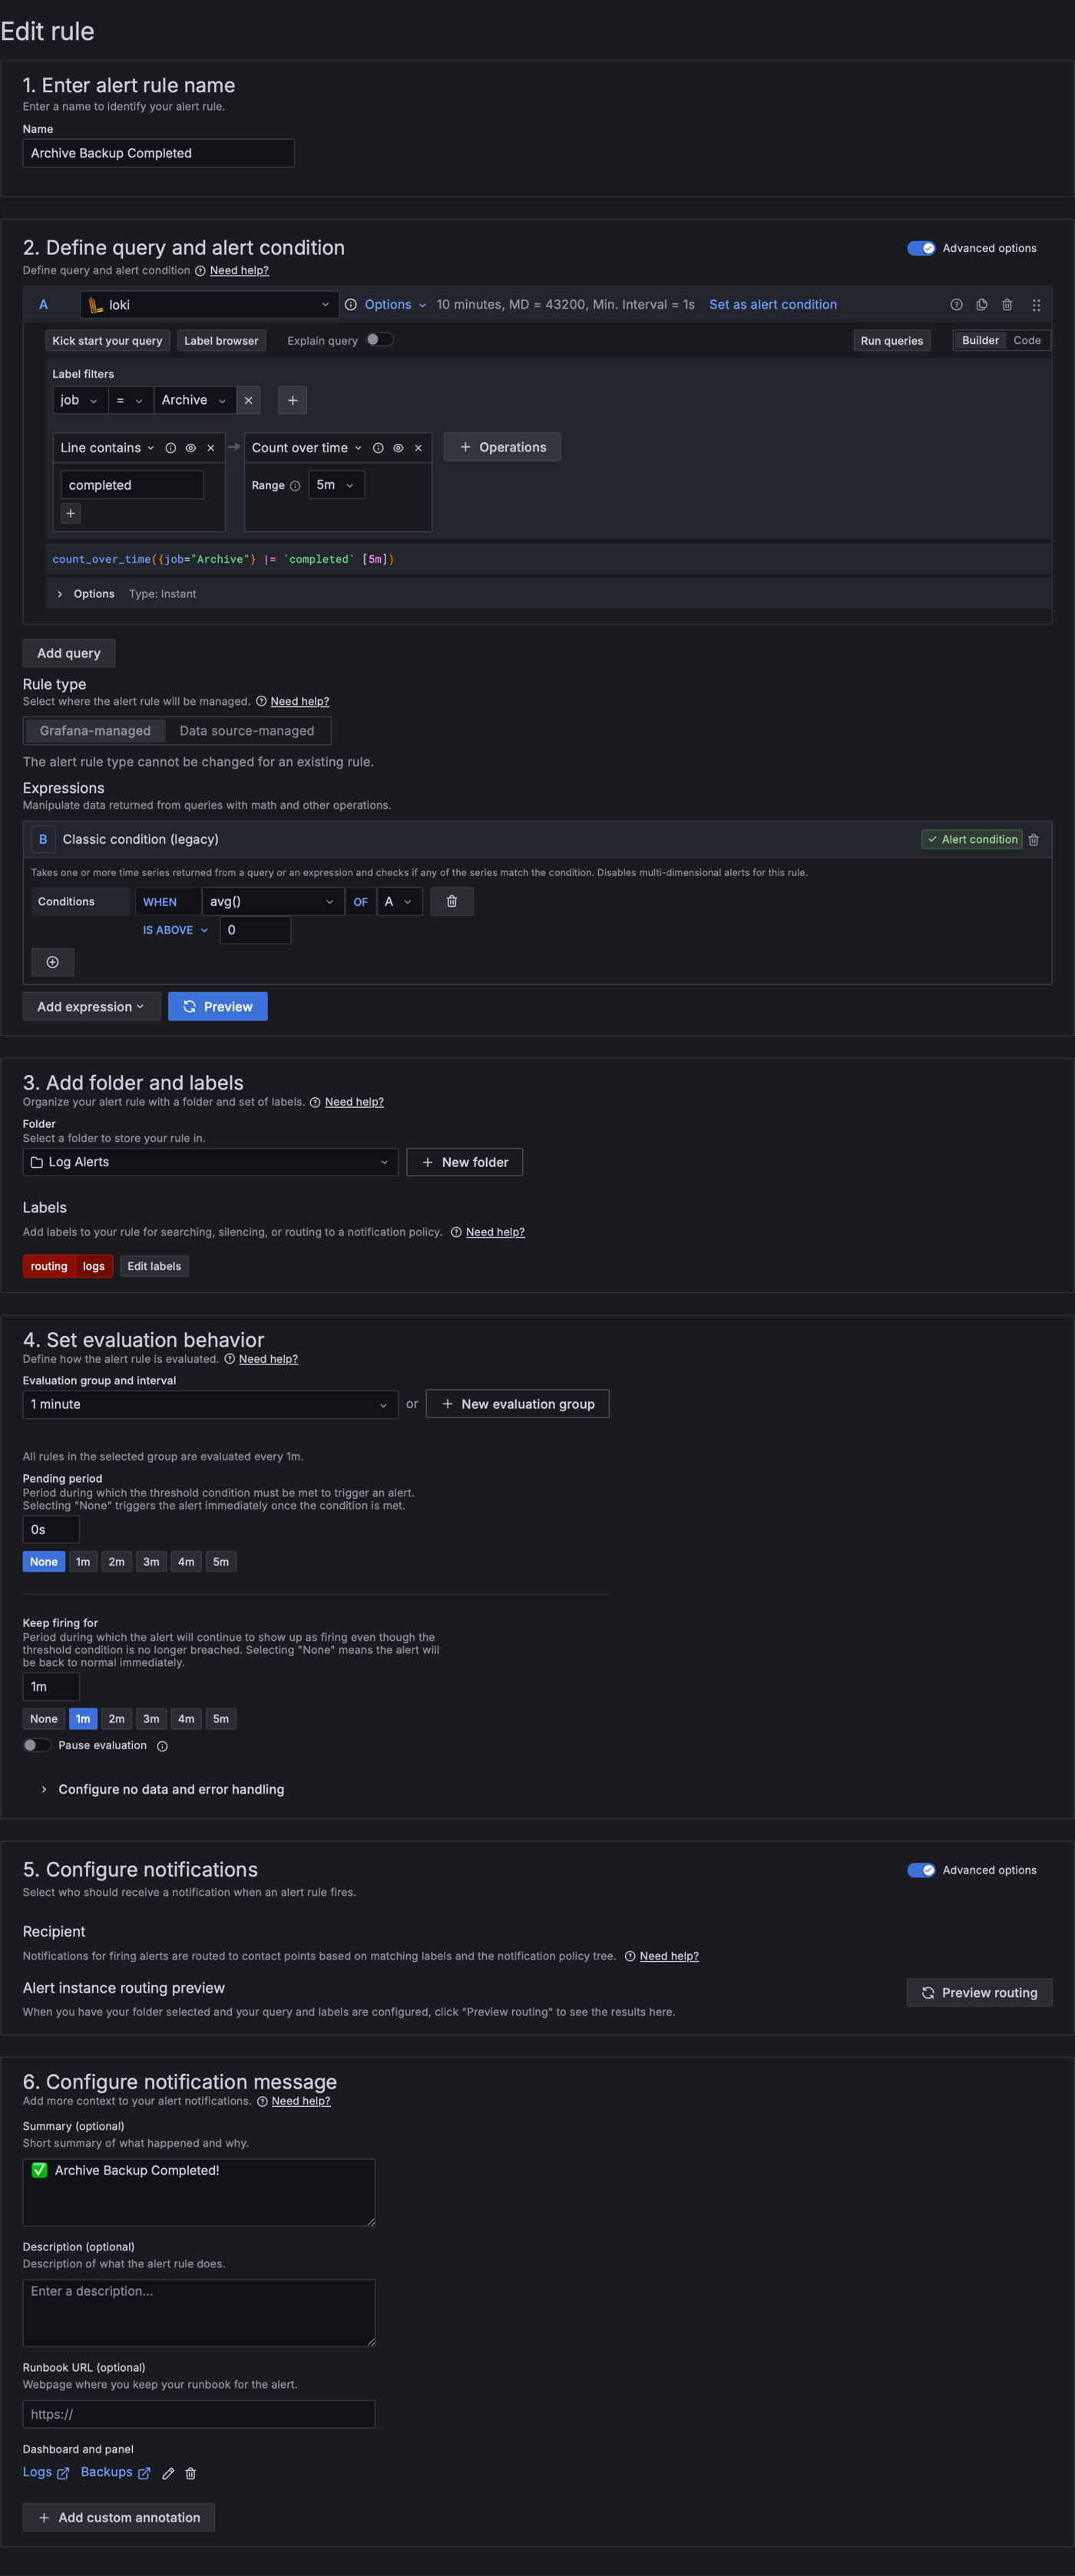
Here’s the alert in Grafana:
Conclusions
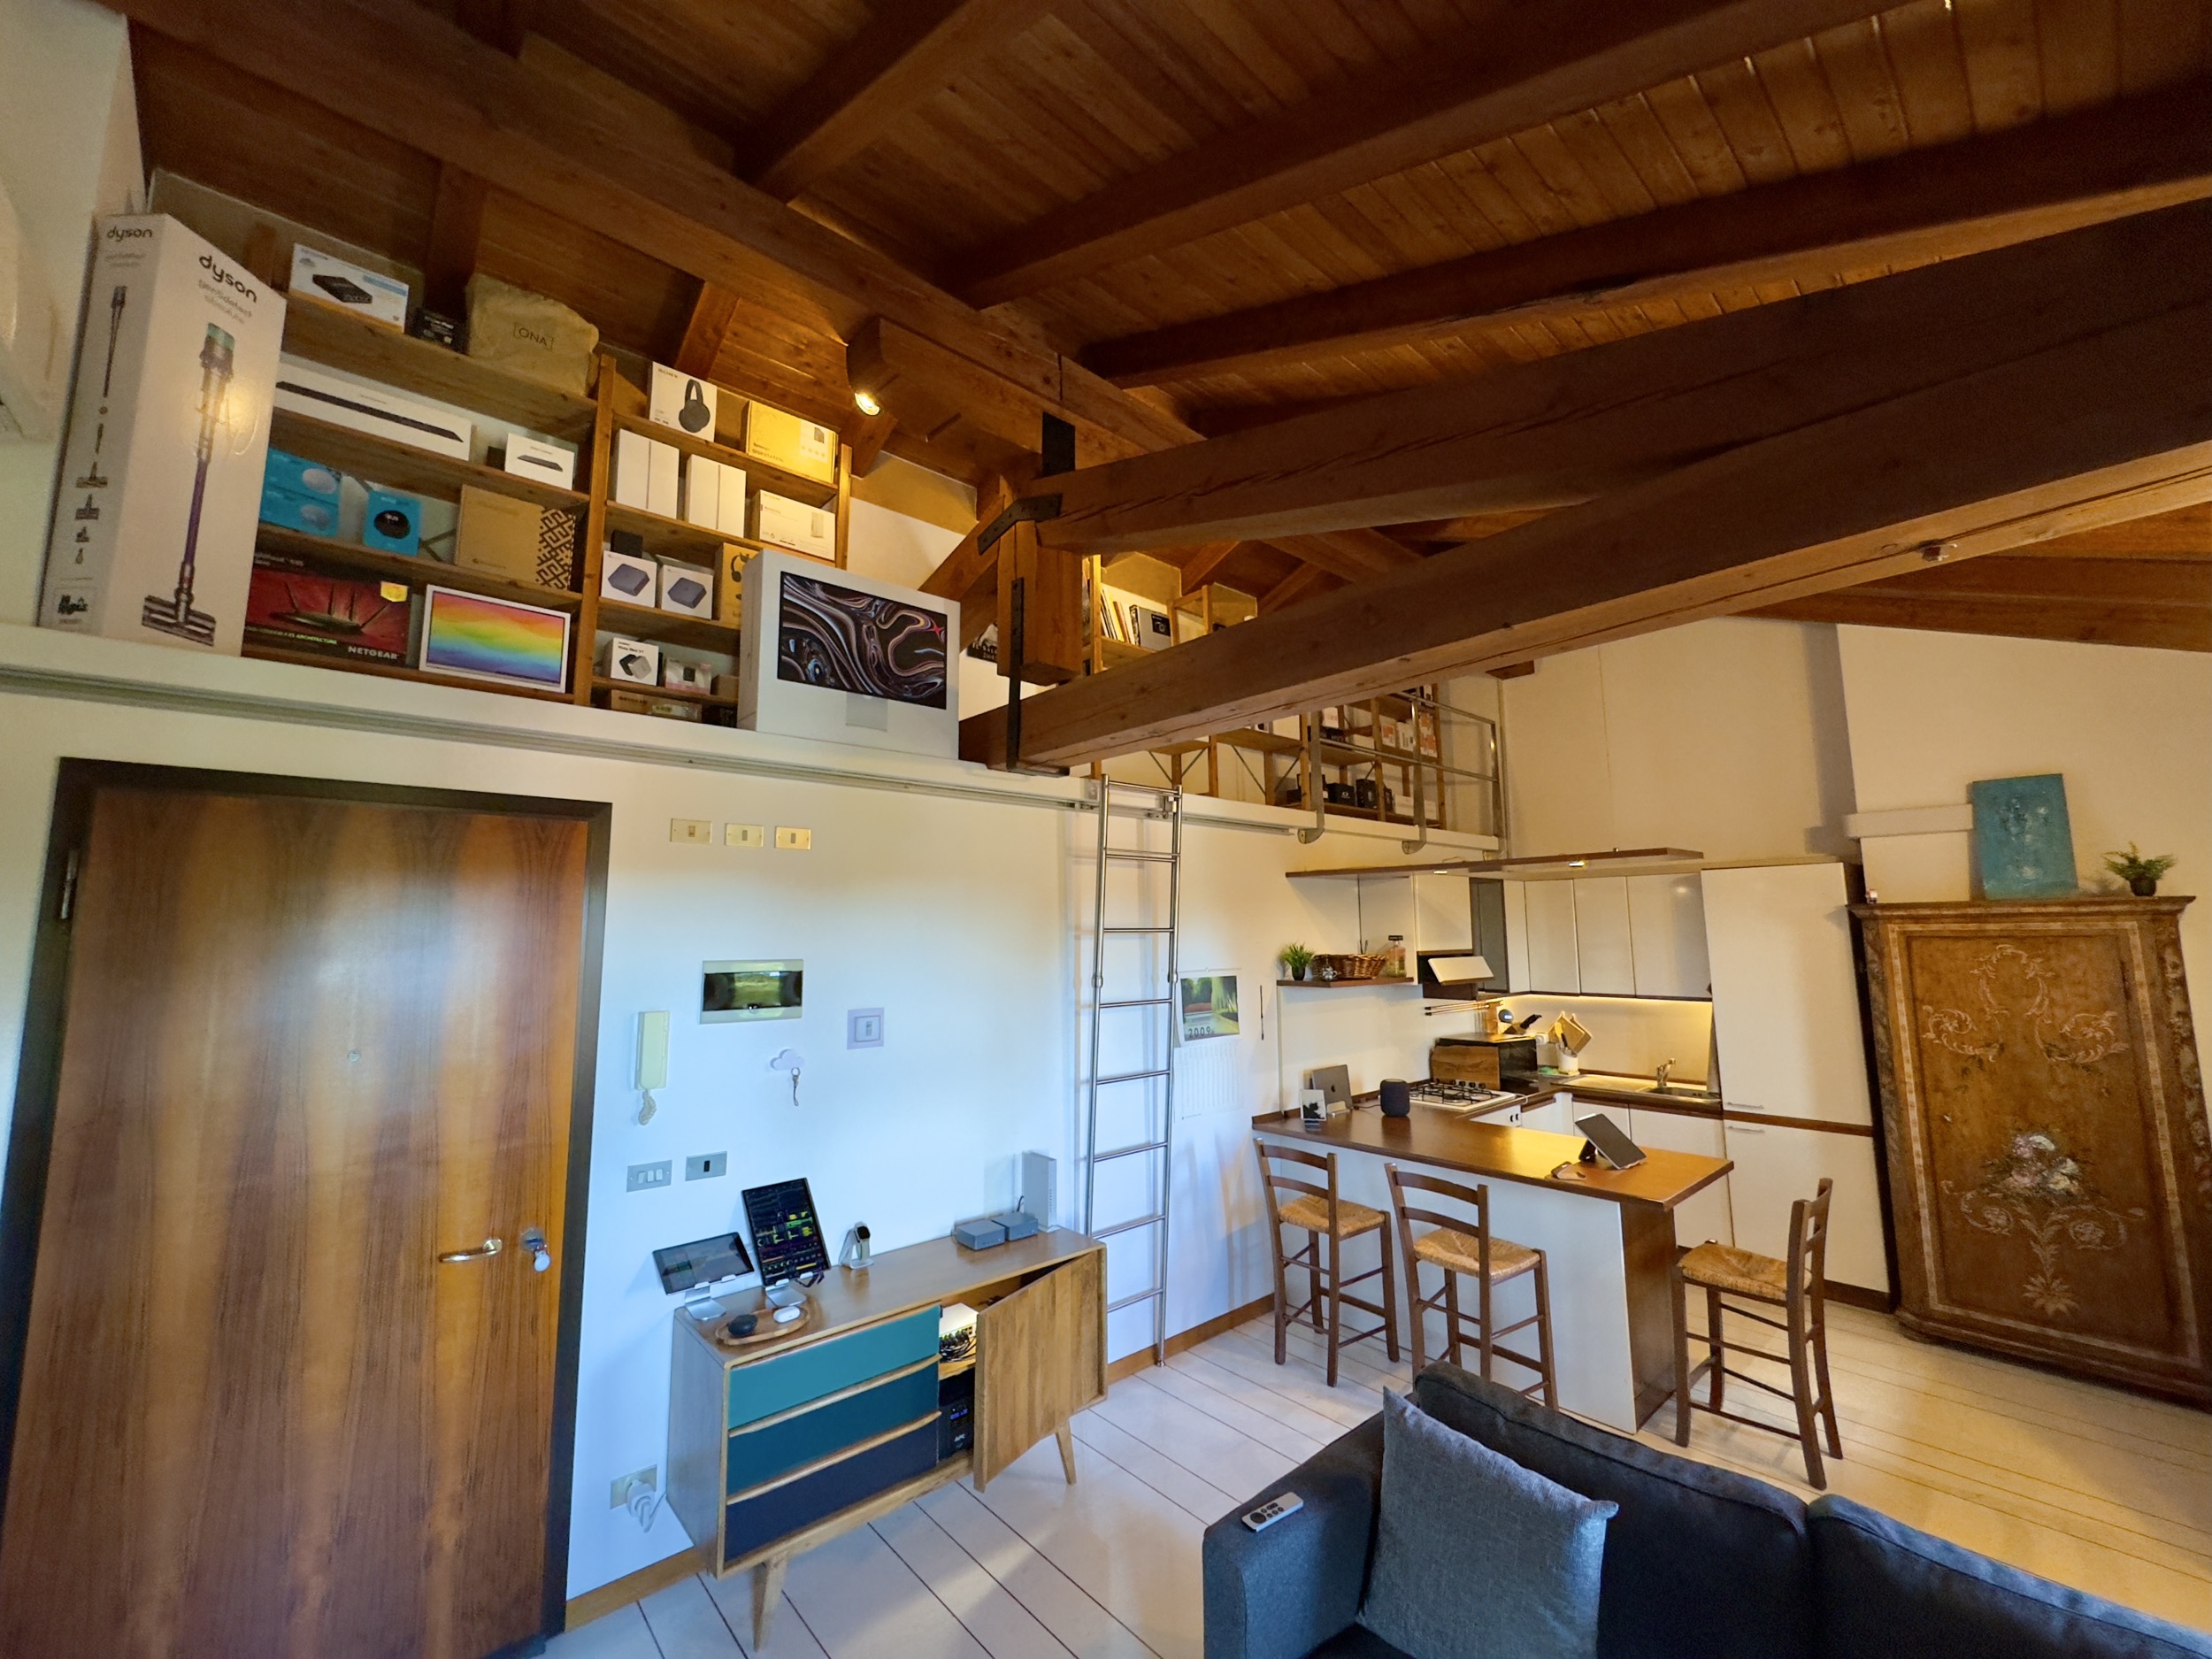
Lastly, I organized all the “tech stuff” boxes and placed them in an empty space of the house. Now, if I need to resell something or find components, they’re within reach.
This is all. Thank you for reading, and if you have any questions or curiosity, just leave a comment.