I have to admit, it hasn’t been long since my last post about my “home setup,” but during the summer I have more free time and I took the opportunity to make a few small improvements.
In this post I’ll explain two simple modifications I made (so not a “major release”)
Shelly EM + 50 amp clamp:
- monitor home energy consumption with the Shelly EM, jump to chapter
- keep a widget on the Home Screen of iOS/macOS to view real-time consumption/data, jump to chapter
- the detailed dashboard on Grafana, jump to chapter
Synology DS124 NAS + 1 TB SSD:
- my setup with this Synology NAS, jump to chapter
- monitoring the NAS with SNMP, Prometheus and Grafana, jump to chapter
First, here are the previous “chapters” of my home setup, so you can follow “the path” and understand how I’ve arrived at this point:
| Date | Title and Link |
|---|---|
| Jan 14, 2022 | My hardware and software setup for a new house |
| Jun 02, 2022 | My network home setup - v2.0 |
| Jun 02, 2022 | My network home setup - v2.0 |
| Aug 14, 2022 | My network home setup - v3.0 |
| Dec 12, 2022 | Some custom push notifications that improved my life |
| Dec 19, 2022 | Retrieve a scheduled report of your Grafana dashboards via mail |
| Jan 5, 2023 | My network home setup - v4.0 |
| Sep 14, 2023 | My network home setup - v4.5 |
| Aug 08, 2024 | My home setup v5.0 |
| This post | The details of this last update |
Intro and final photos
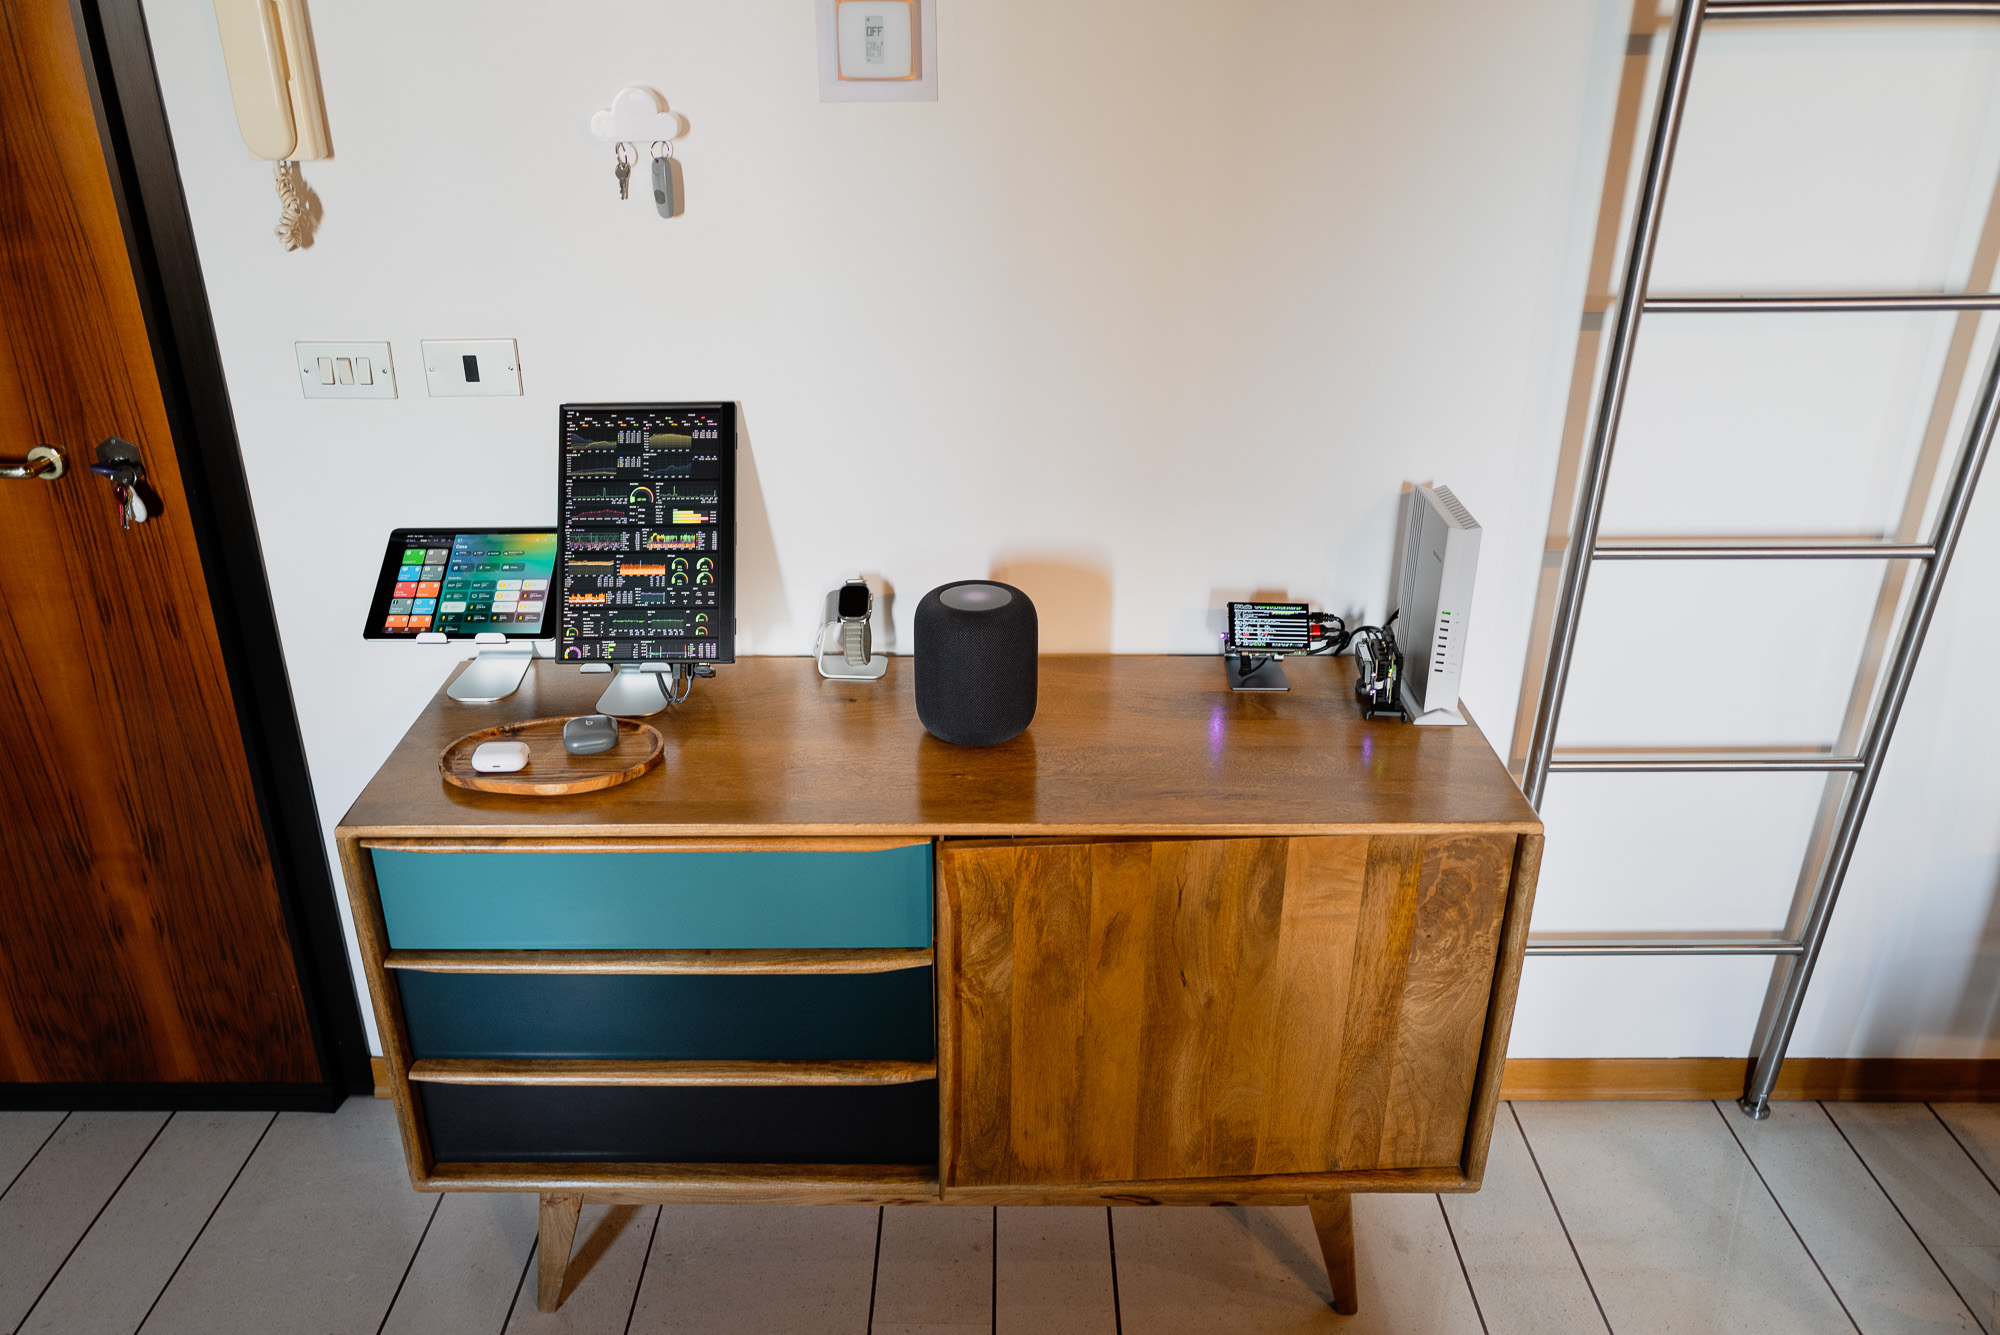
As usual, I’ll include a few preview images of the final result so you can decide if it’s worth continuing to read.
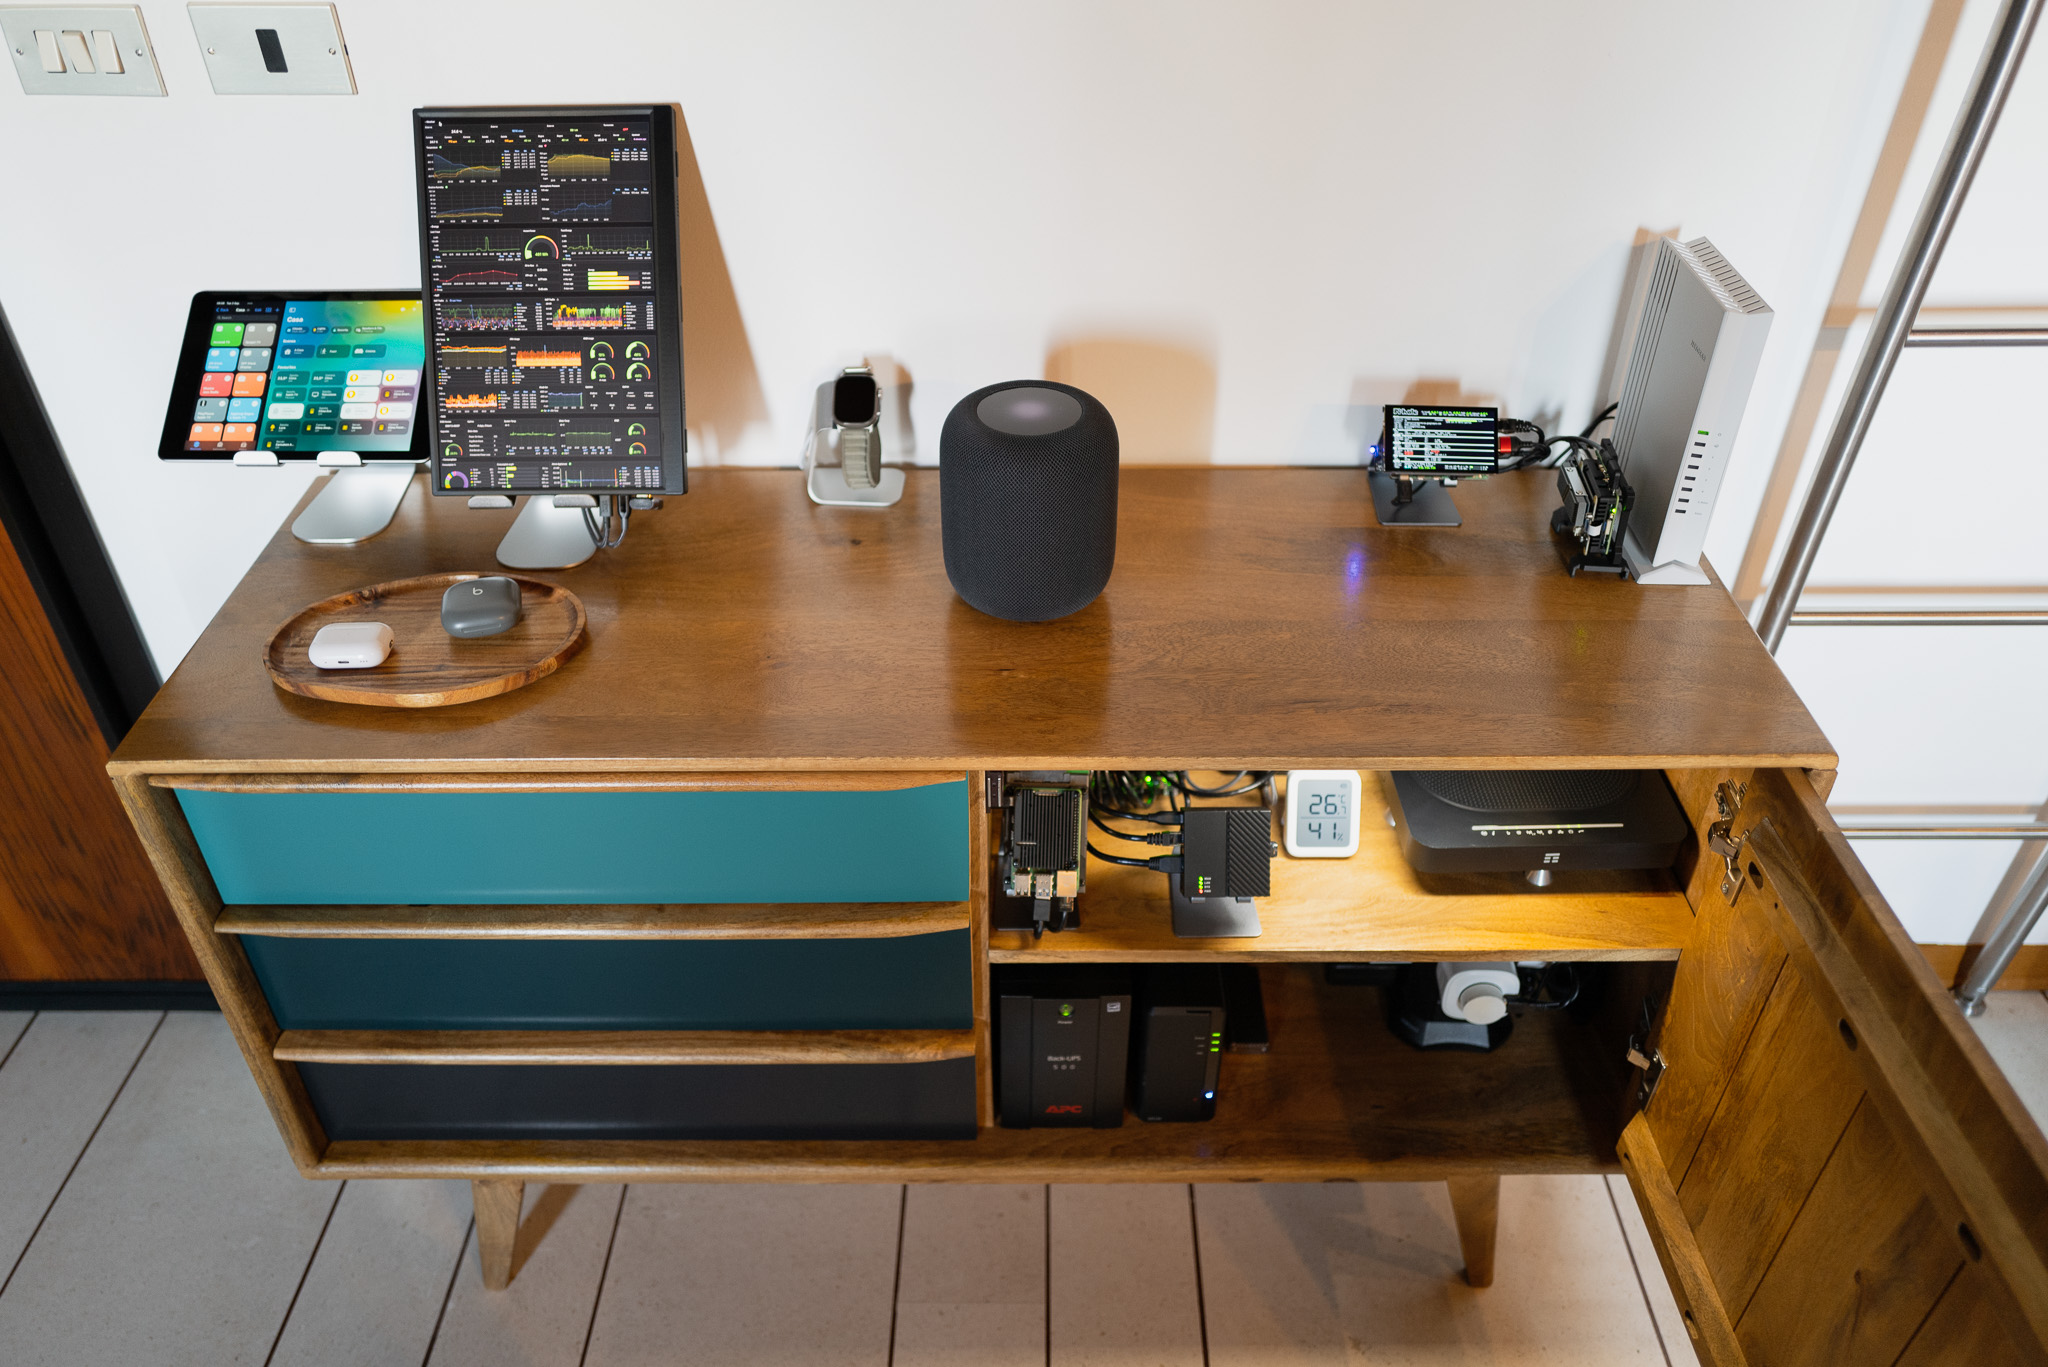
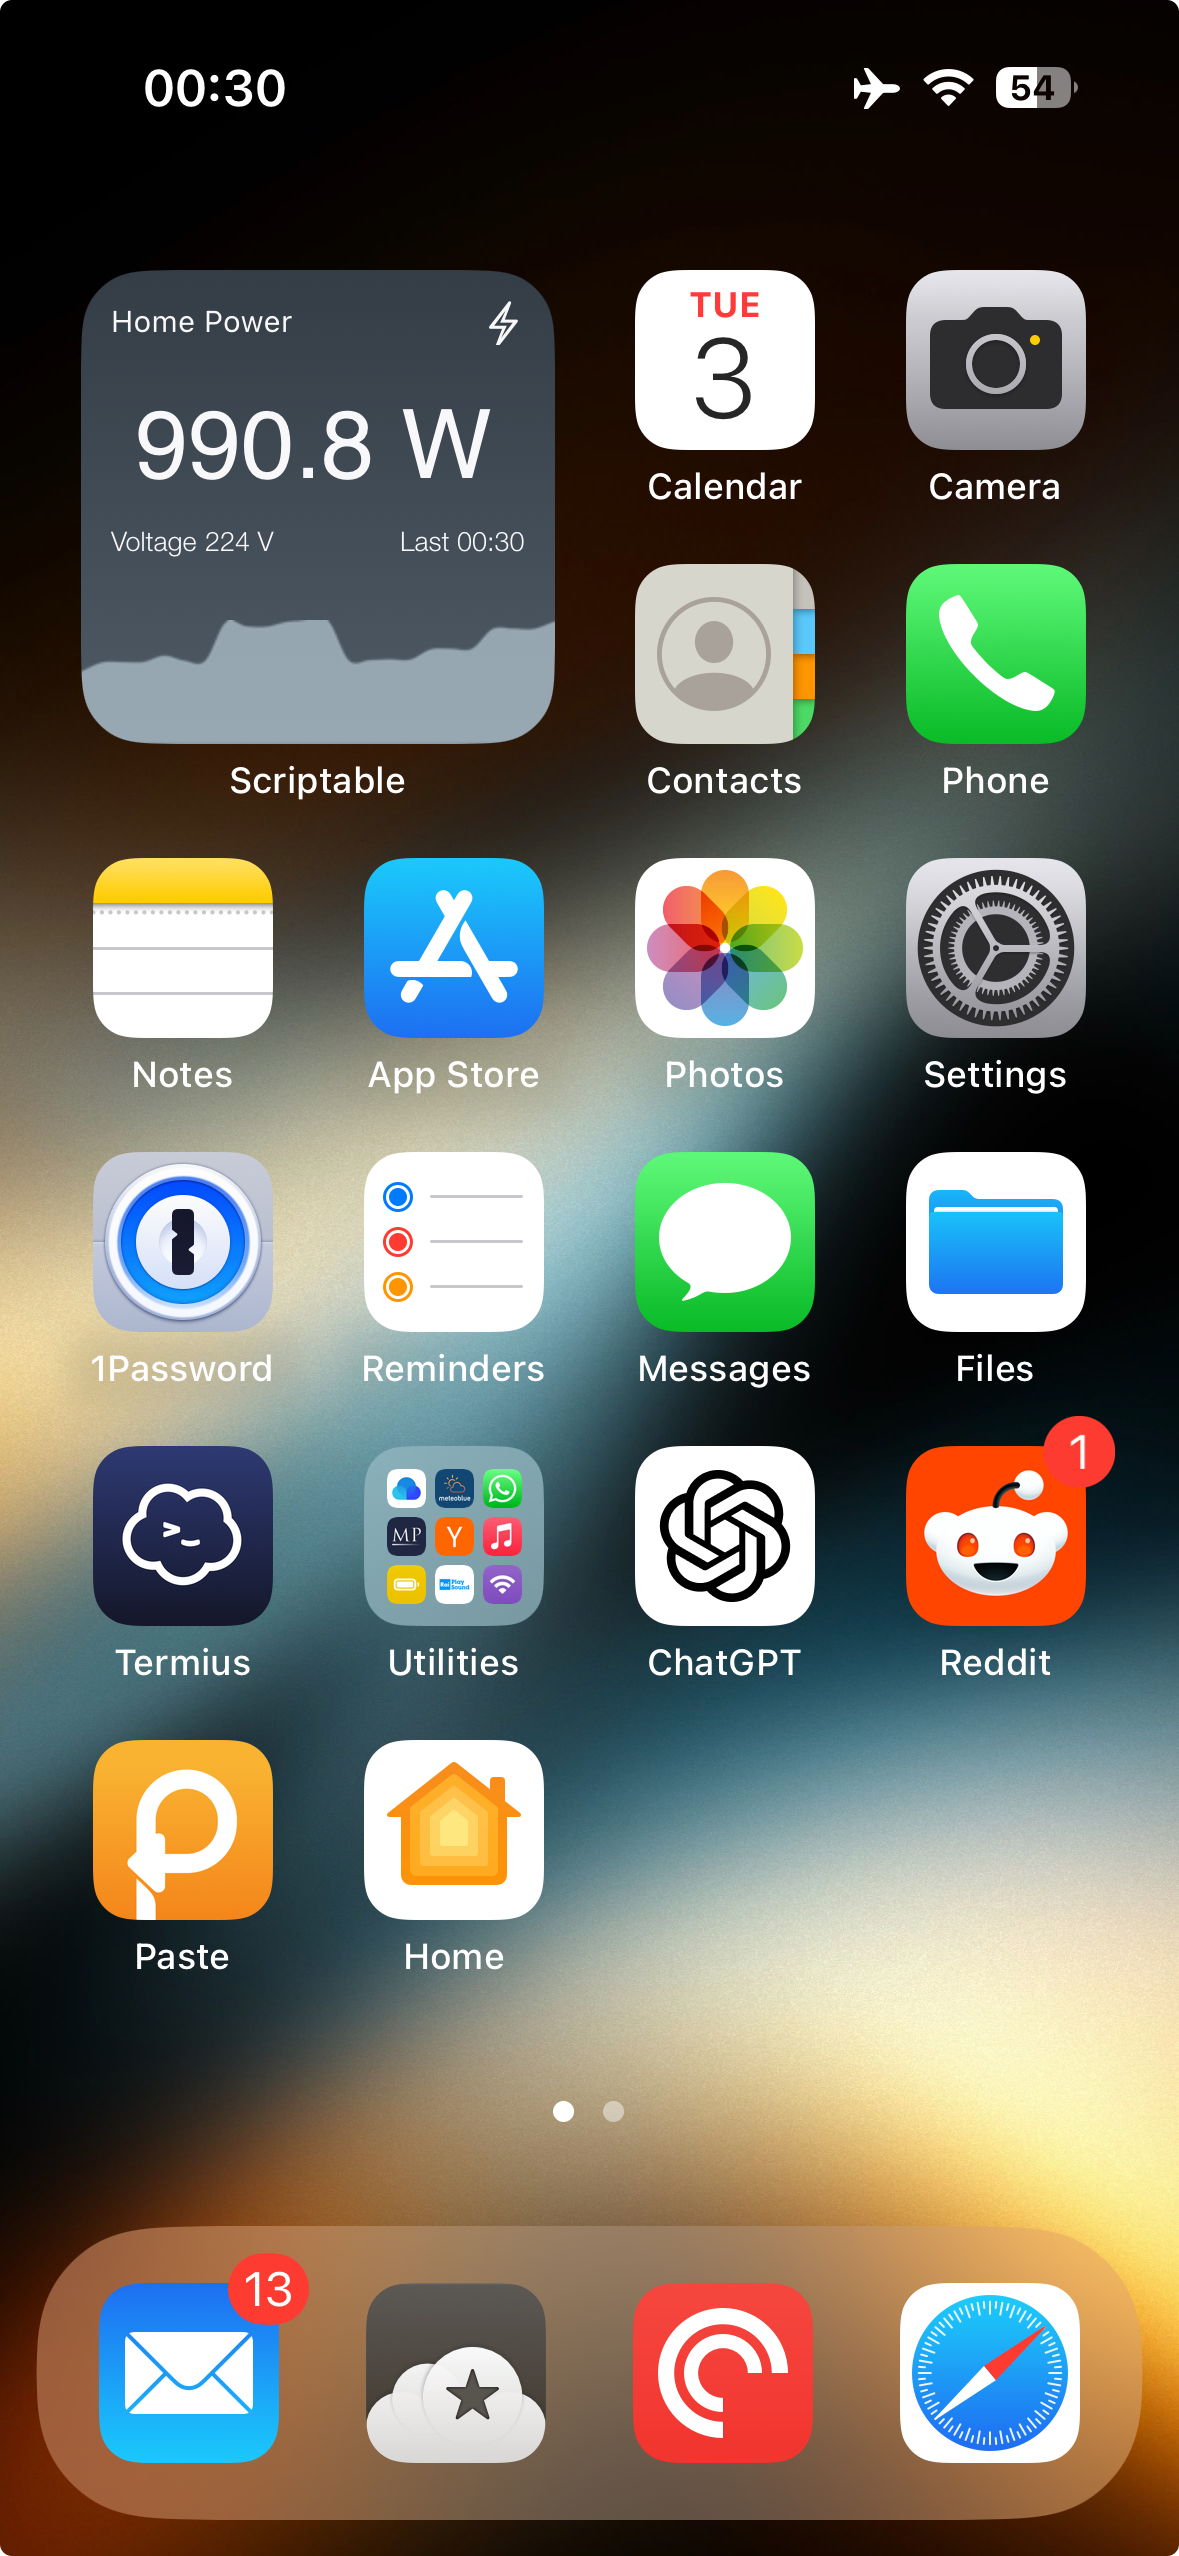
Widget and Shelly EM section with the consumption:

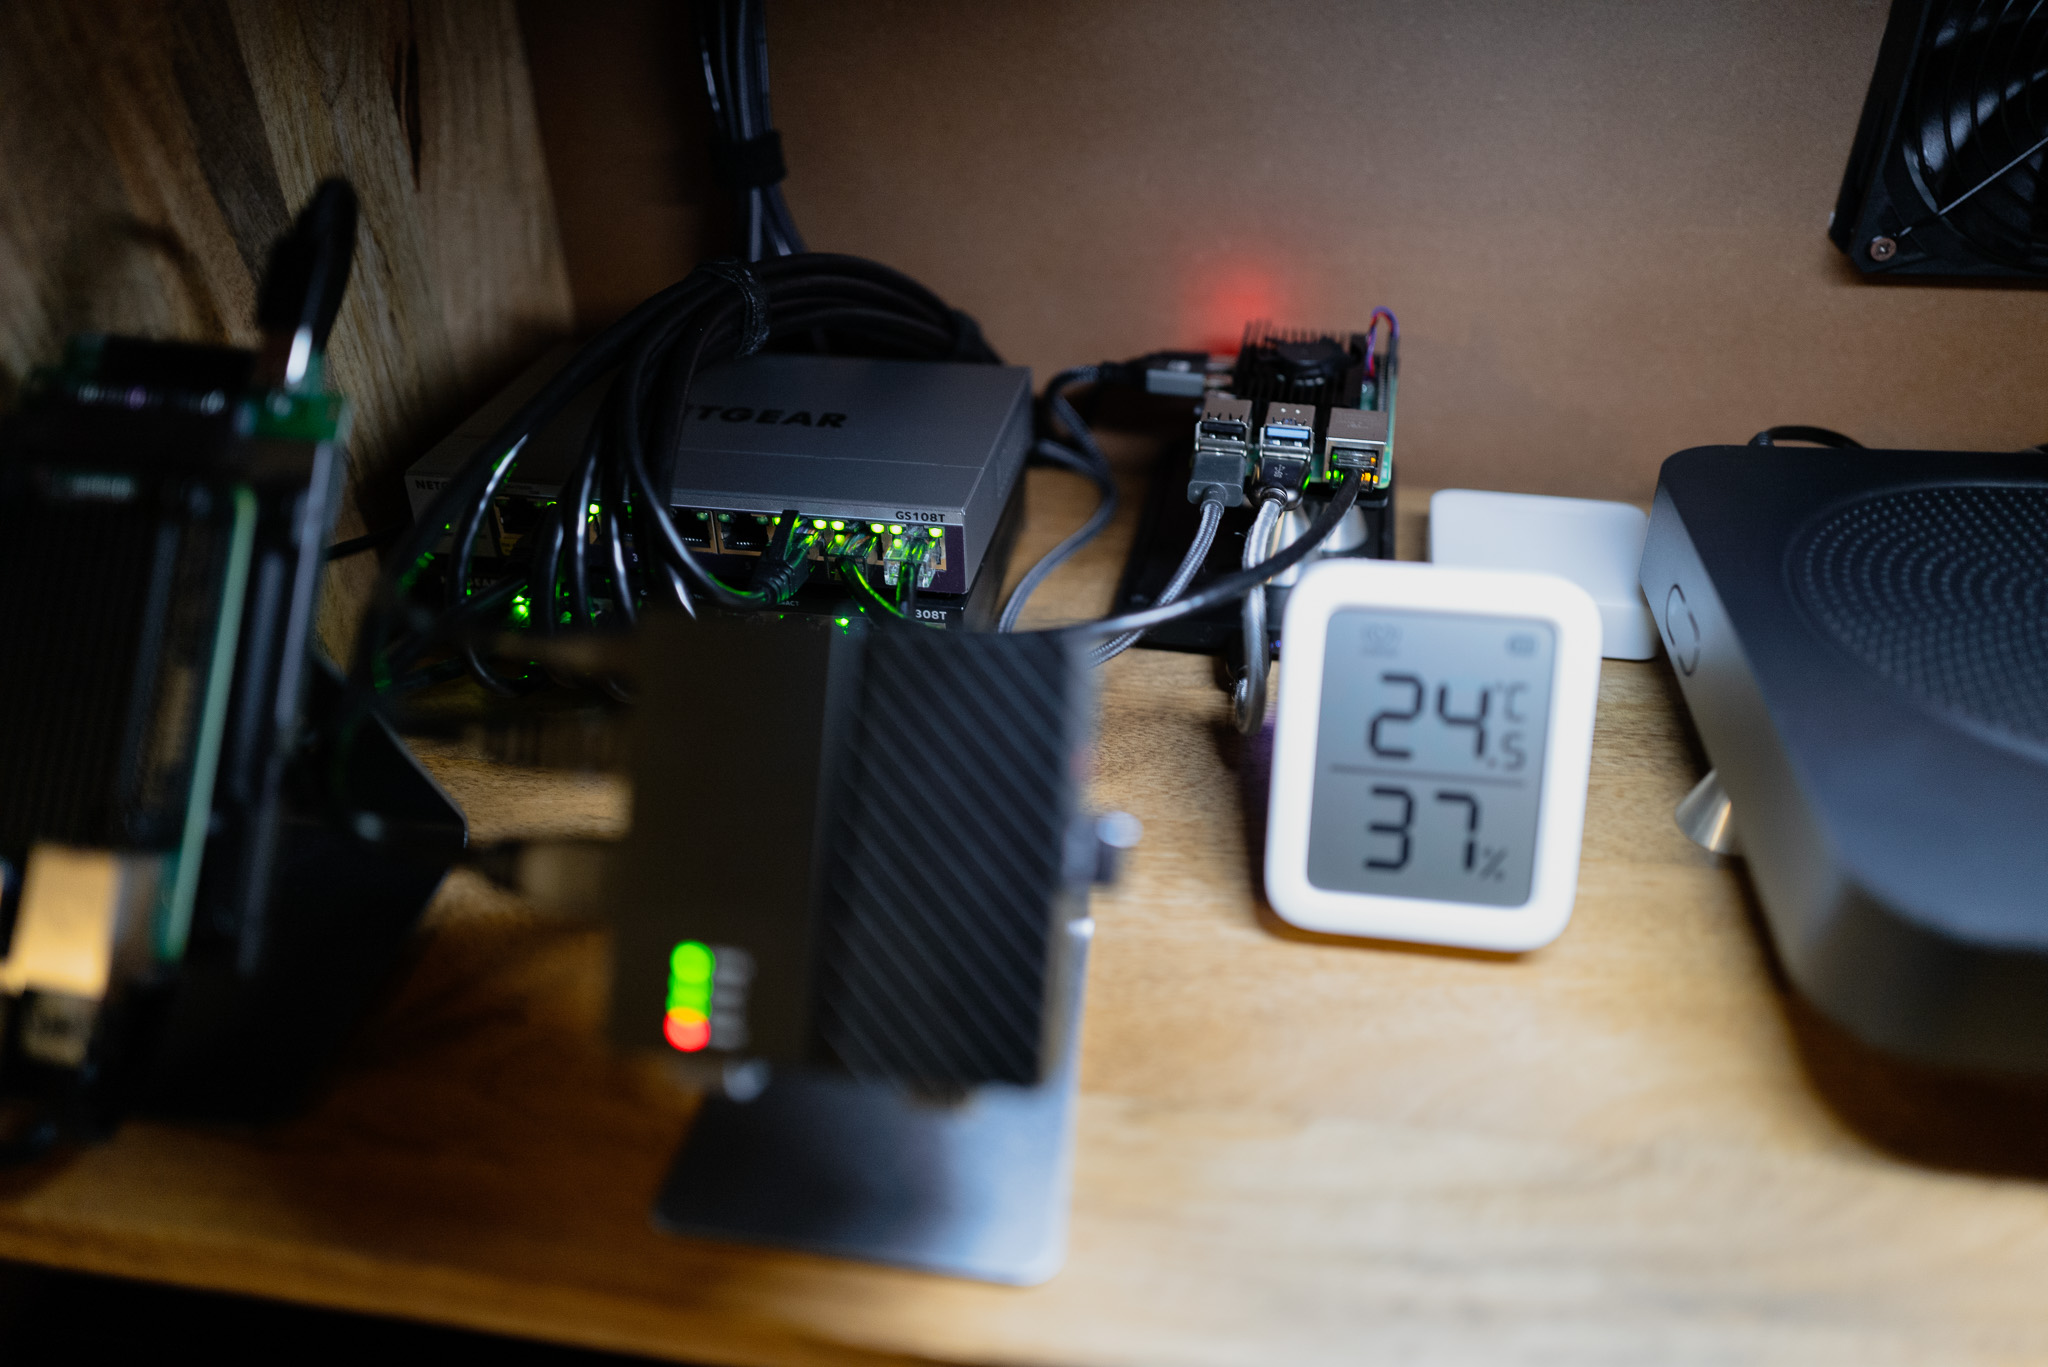
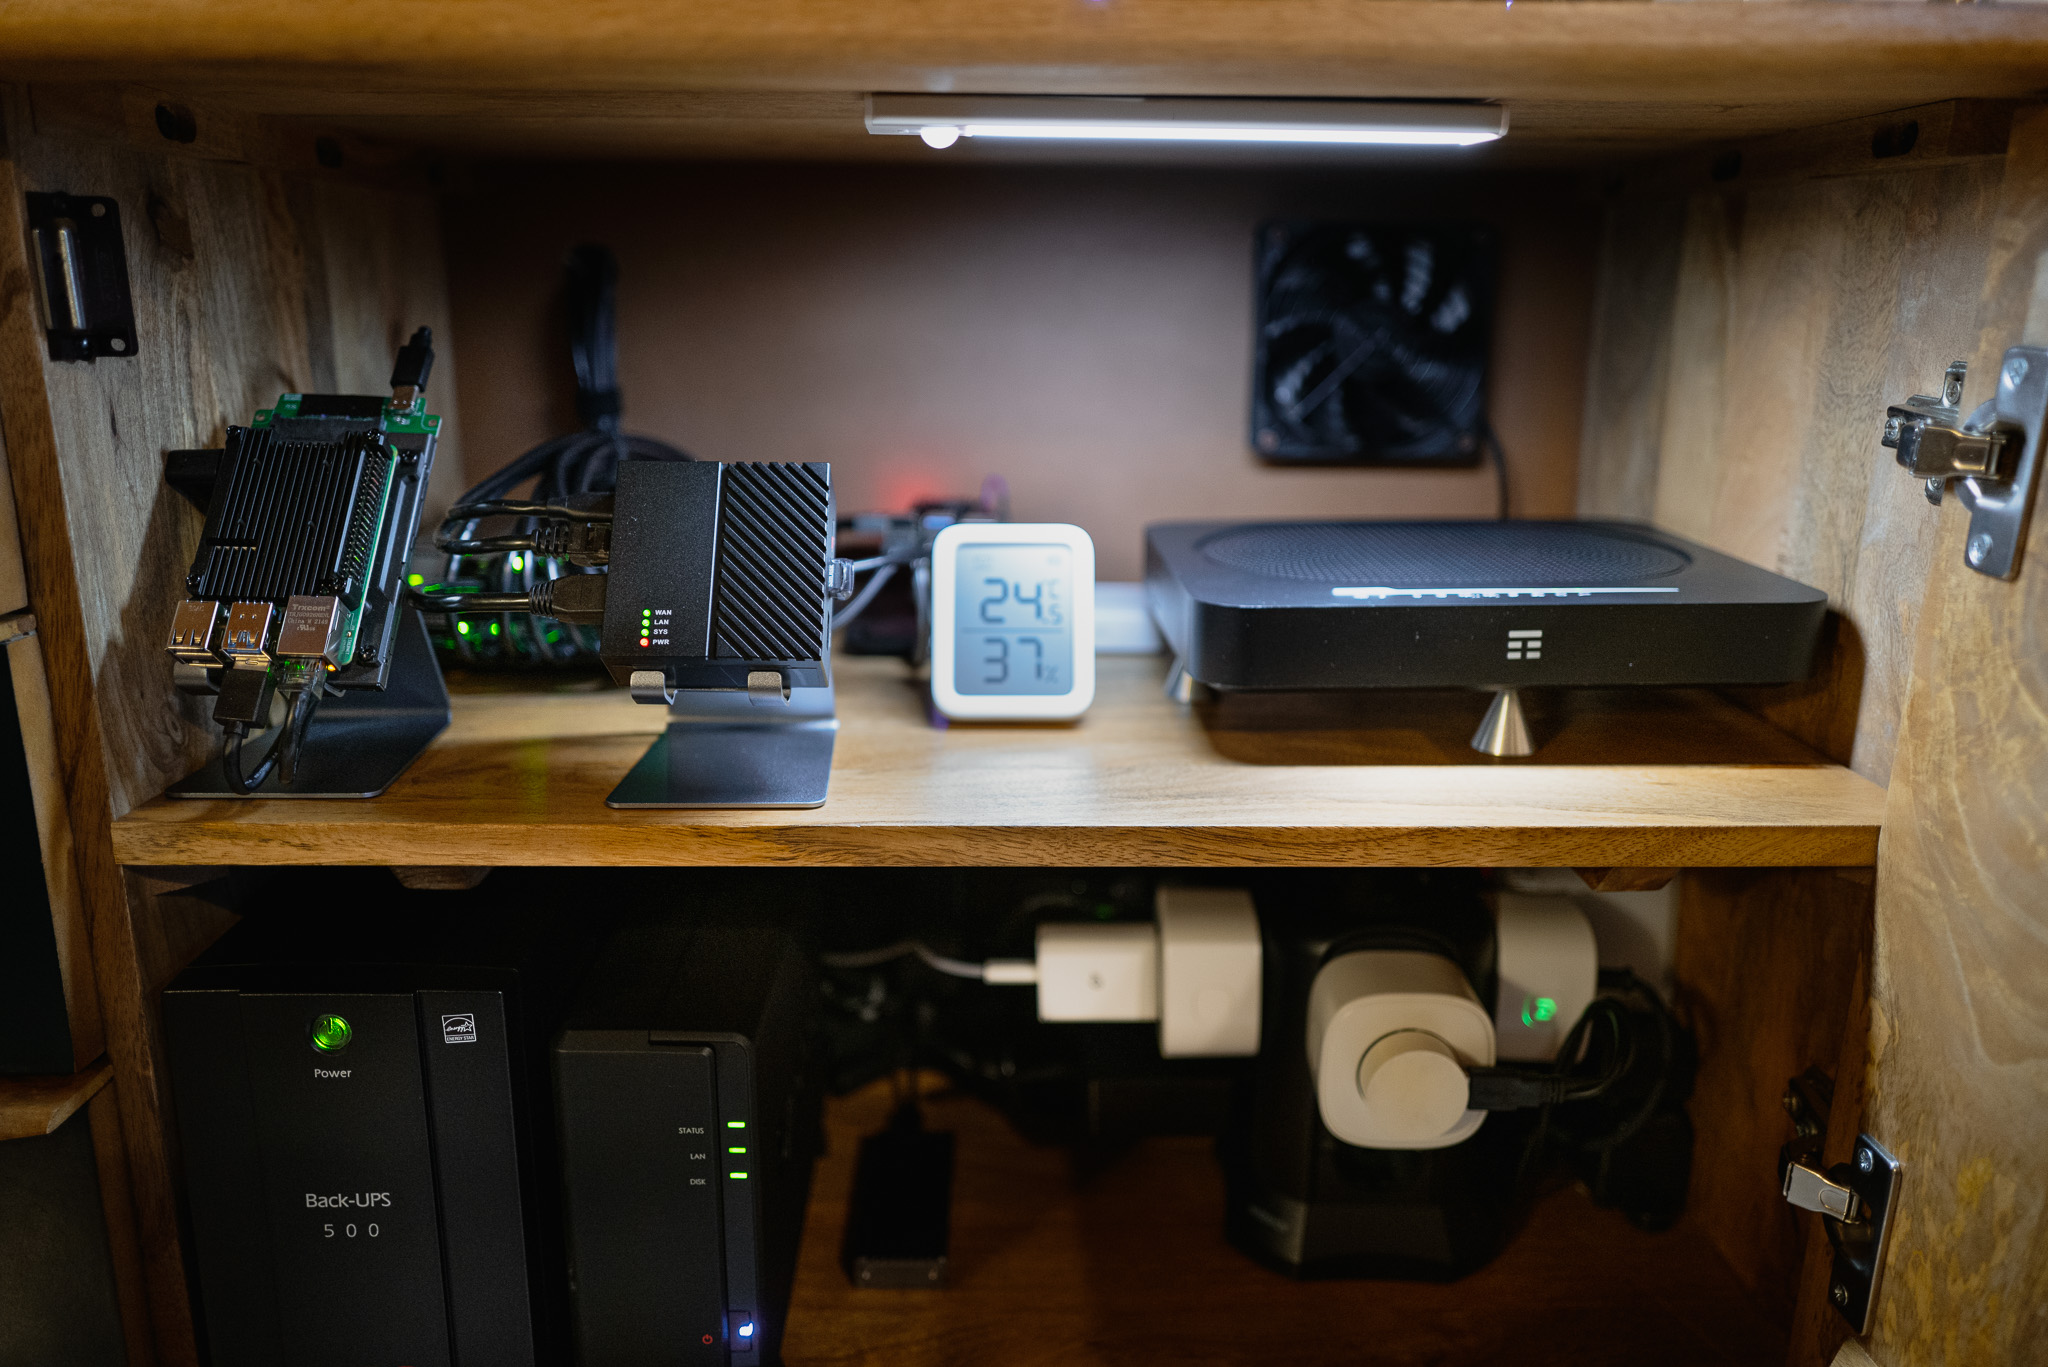
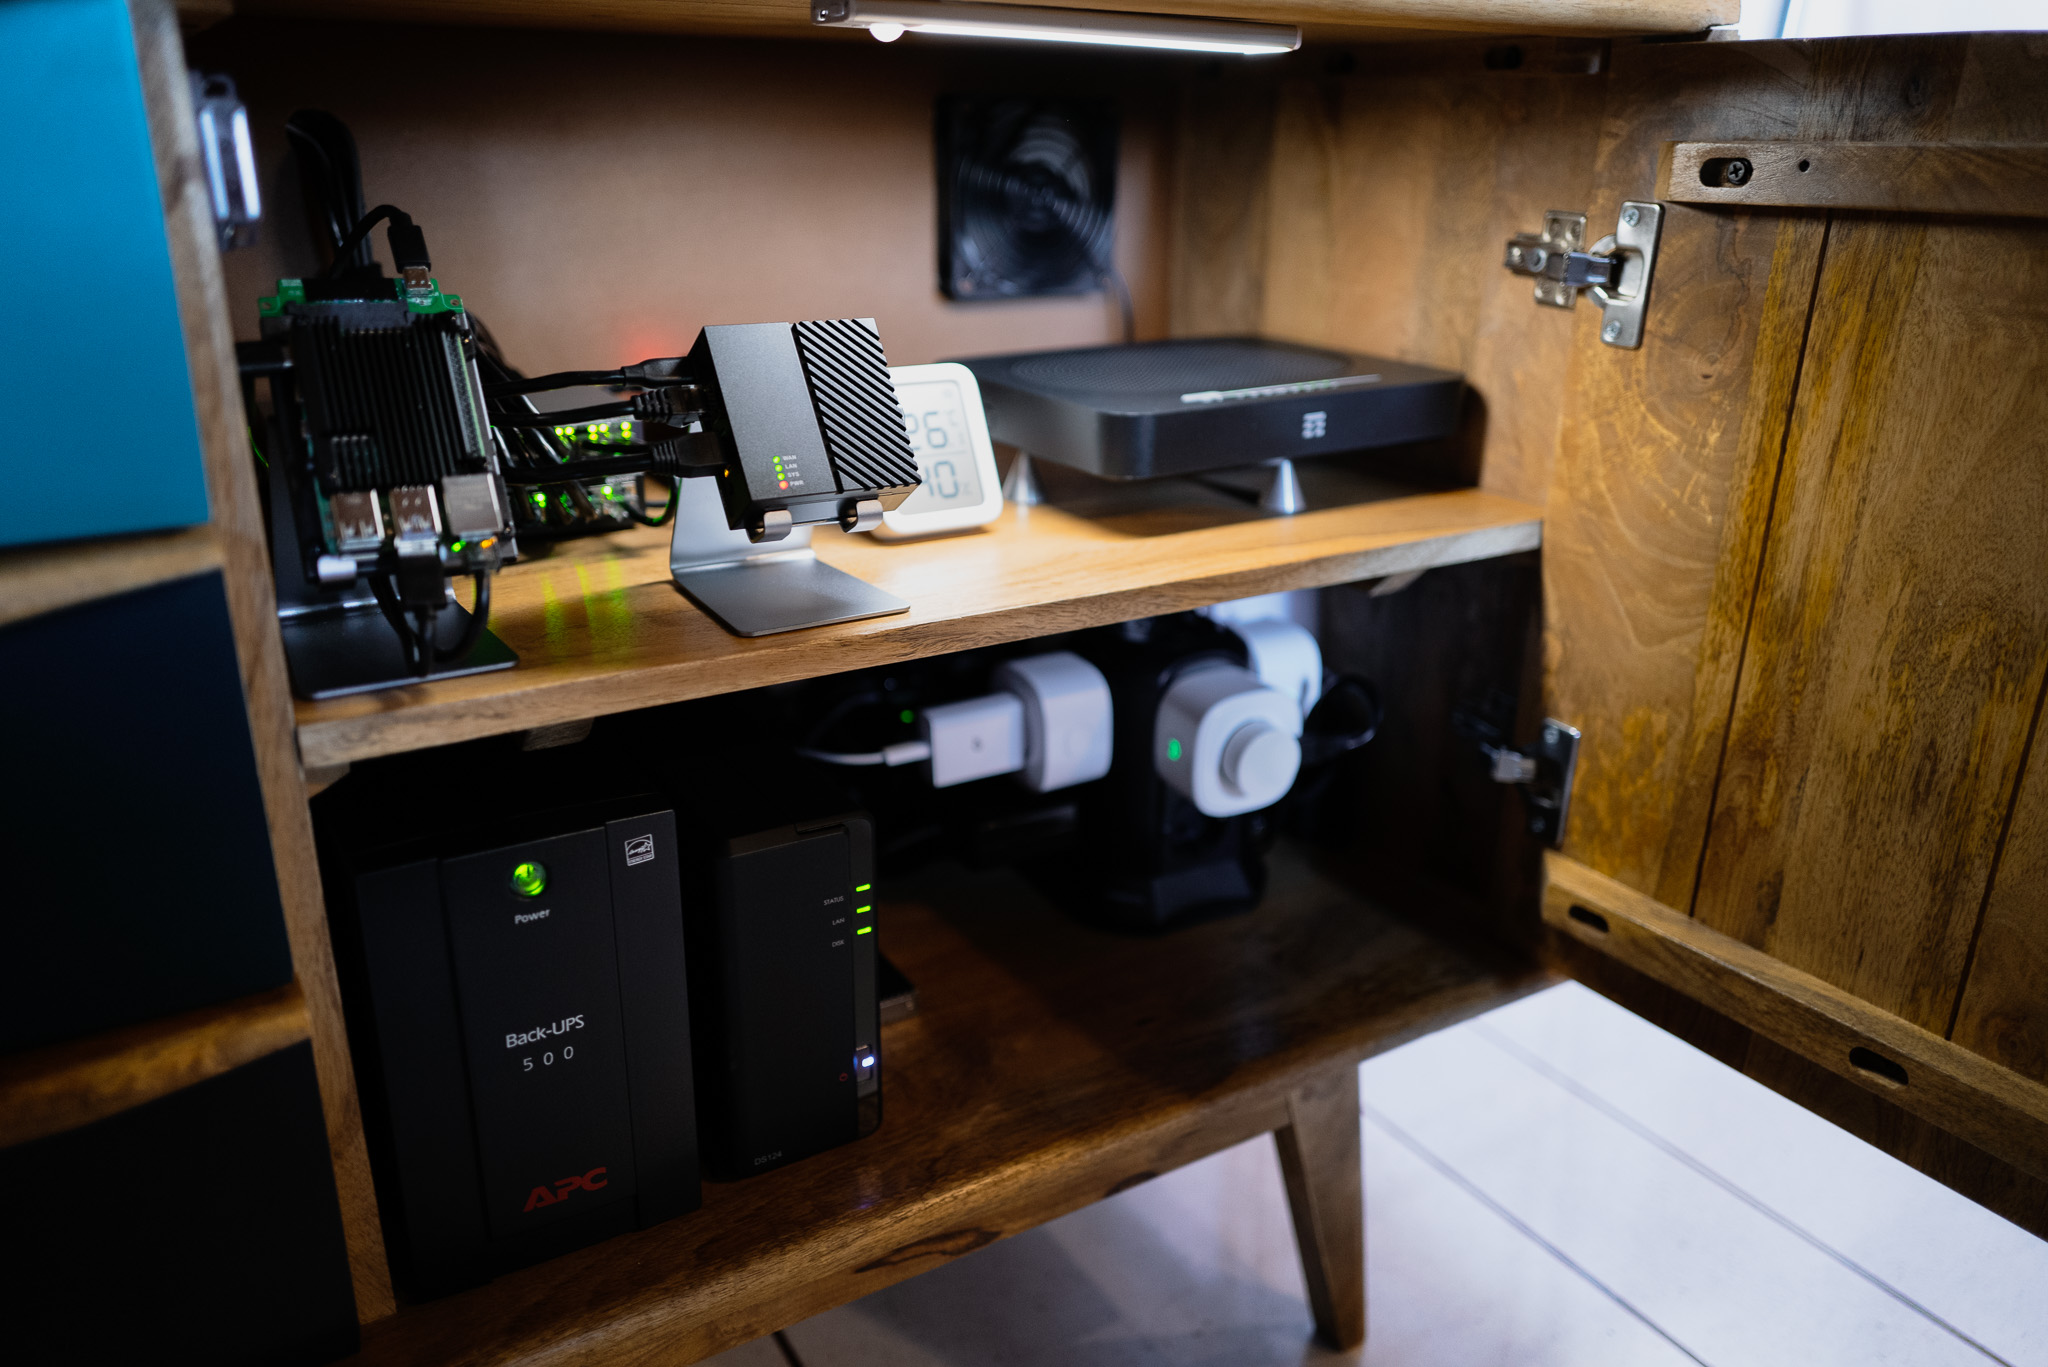
The Synology DS124 and the overall setup:
Shelly EM
First I took a look at my home electrical panel to see if it could be easily installed. Once I realized it was, I bought a Shelly device on Amazon, specifically a Shelly EM + 50A amperometric clamp for about €60.
I installed the amperometric clamp on the cable coming from the energy meter and going to the electrical panel inside the house..
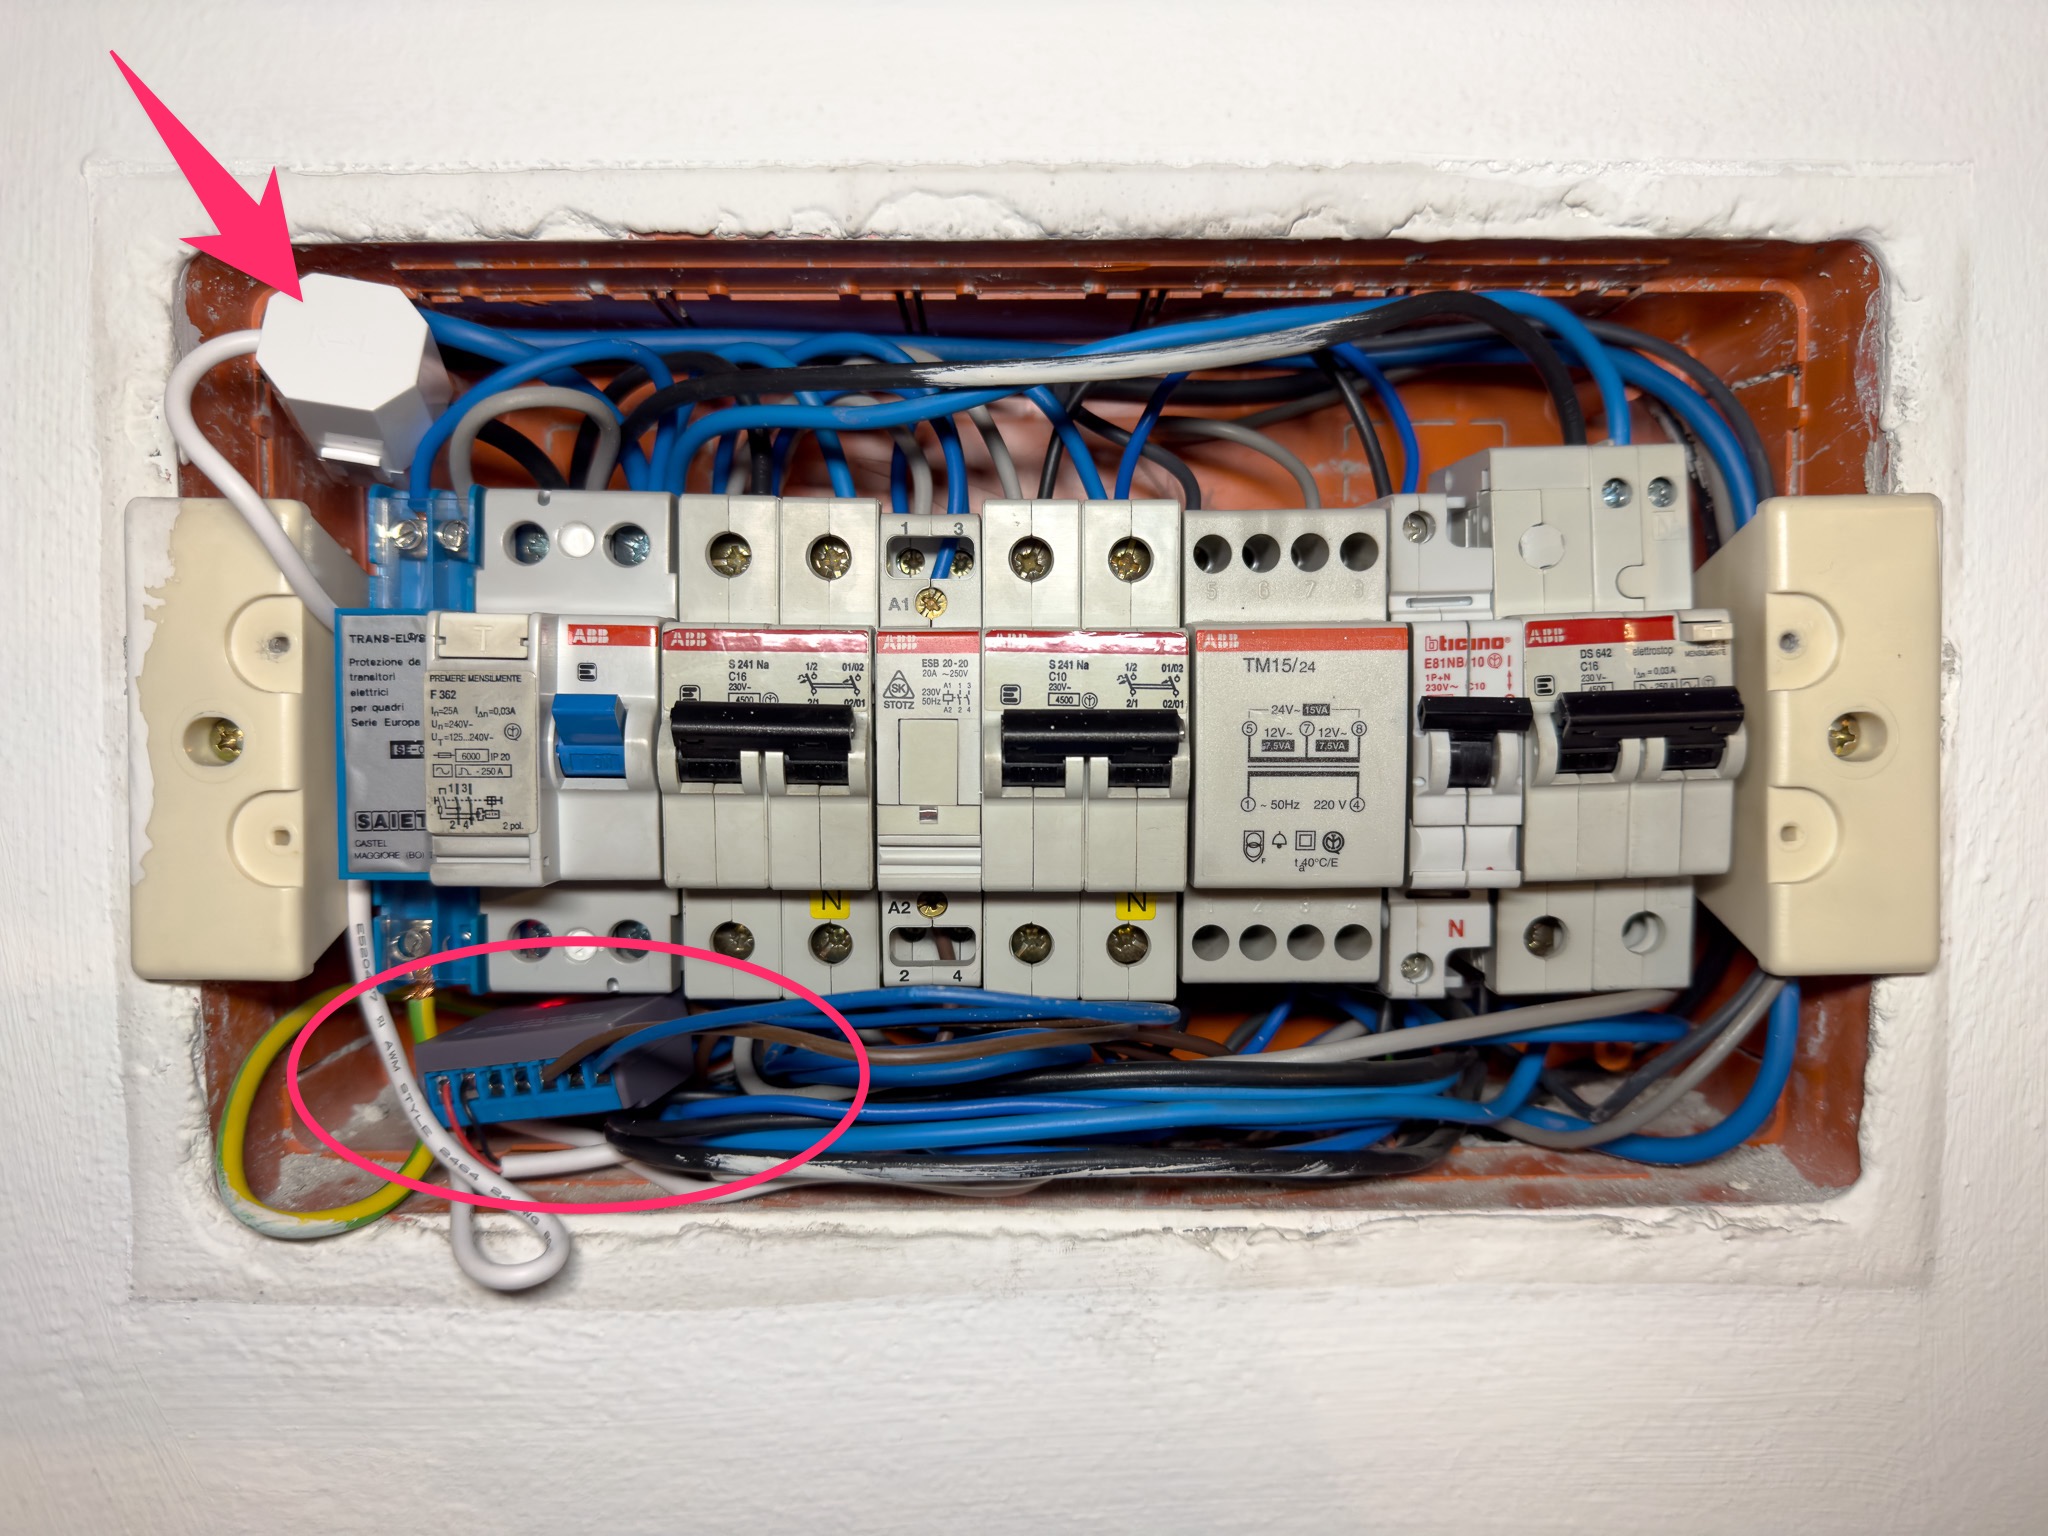
The process is quite simple: you connect the two power cables to the Shelly from the electrical panel, then close the clamp making sure to follow the indicated direction on it. I also didn’t use the second channel (this Shelly can monitor two electrical lines) or its relays (it has two relays in case you need to activate something, open, or close a circuit).
Widget for iOS
The Shelly app works very well, sends data and updates in real-time, but:
- the user interface is ugly
- you have to open the app to see the data
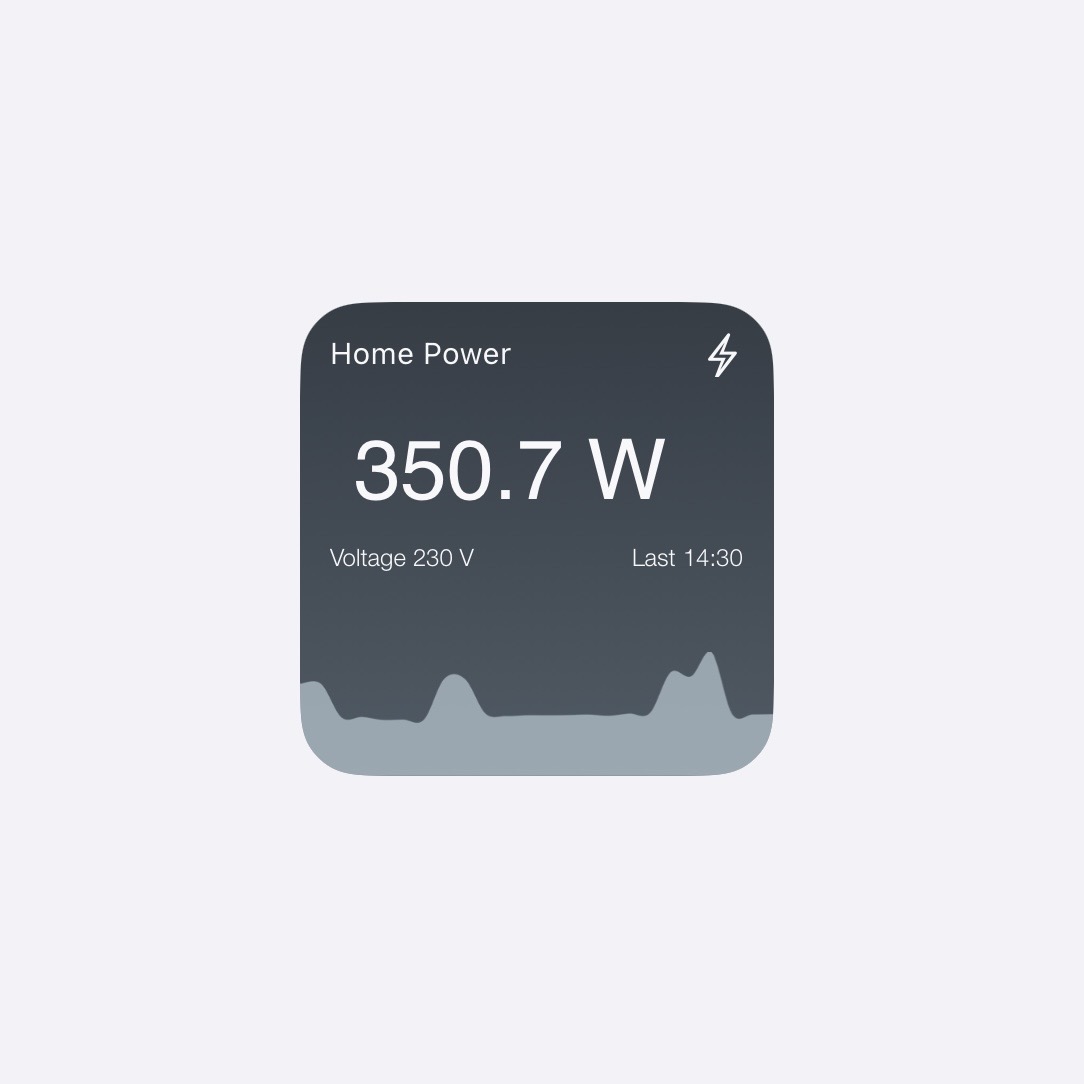
So, I tried to find out if it was possible to have a widget that shows the consumption ‘at a glance’ on the Home Screen of the iPhone or Mac, and once I realized it was possible, I gave it a try.
And I’m pretty satisfied with the result:
How does it work and what’s behind it?
The Shelly has its own data page, in json format, at http://your-shelly-ip/status. In my case, since it’s installed and isolated in the IoT VLAN, the address is http://192.168.50.217/status (with a fixed address assigned by OpenWrt).
The energy data are displayed in this way:
{"wifi_sta":{"connected":true,"ssid":"Magnifico_IoT","ip":"192.168.50.217","rssi":-35},"cloud":{"enabled":true,"connected":true},"mqtt":{"connected":false},"time":"12:11","unixtime":1724148671,"serial":6002,"has_update":false,"mac":"ExxxxxE","cfg_changed_cnt":3,"actions_stats":{"skipped":0},"relays":[{"ison":false,"has_timer":false,"timer_started":0,"timer_duration":0,"timer_remaining":0,"overpower":false,"is_valid":true,"source":"input"}],"emeters":[{"power":84.61,"reactive":-225.31,"pf":-0.35,"voltage":224.50,"is_valid":true,"total":127782.1,"total_returned":0.0},{"power":0.00,"reactive":0.00,"pf":0.00,"voltage":224.50,"is_valid":true,"total":0.0,"total_returned":0.0}],"update":{"status":"idle","has_update":false,"new_version":"20230913-114150/v1.14.0-gcb84623","old_version":"20230913-114150/v1.14.0-gcb84623","beta_version":"20231107-164916/v1.14.1-rc1-g0617c15"},"ram_total":51064,"ram_free":35296,"fs_size":233681,"fs_free":157879,"uptime":644966}
These data can be read and saved in a small history file, and then read by a JavaScript that will render a graphical timeline and the data.
This is possible thanks to Scriptable app, which allows you to create widgets and scripts in JavaScript. So I created (a first version) of the widget from scratch, and here’s the result:
But, after I posted it on the r/Scriptable subreddit, the user u/lollokara replied to the post saying that he also uses a similar widget, and he shared his repository with me.
He uses Home Assistant to extract and save data from his Shelly EM. I don’t use Home Assistant—and I don’t want to— so I went to the “source repository”, from where he built his version: Nodman/scriptables: Collection of my small scriptable projects, and I tried to figure out if it was possible to integrate this widget with the scraping and history functions that I use.
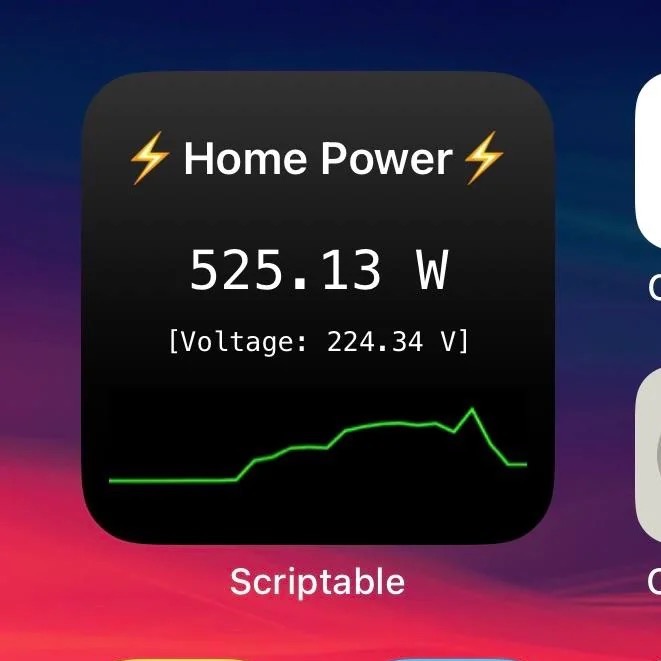
And yes, after quite a few attempts, I managed to do it. At first, the curve wasn’t smooth, and there were some graphical details that could be improved, so I worked on it a bit more, and the final result is this (there’s a small issue with the line sharpness, but is due to how iOS renders the pixel):
I used his functions to render the curve with a few modifications and drew (a lot of) inspiration from his layout/design.
Additionally, since the scripts in that repository come with various themes, my version also allows theme changes (though this isn’t something I’m particularly interested in these).
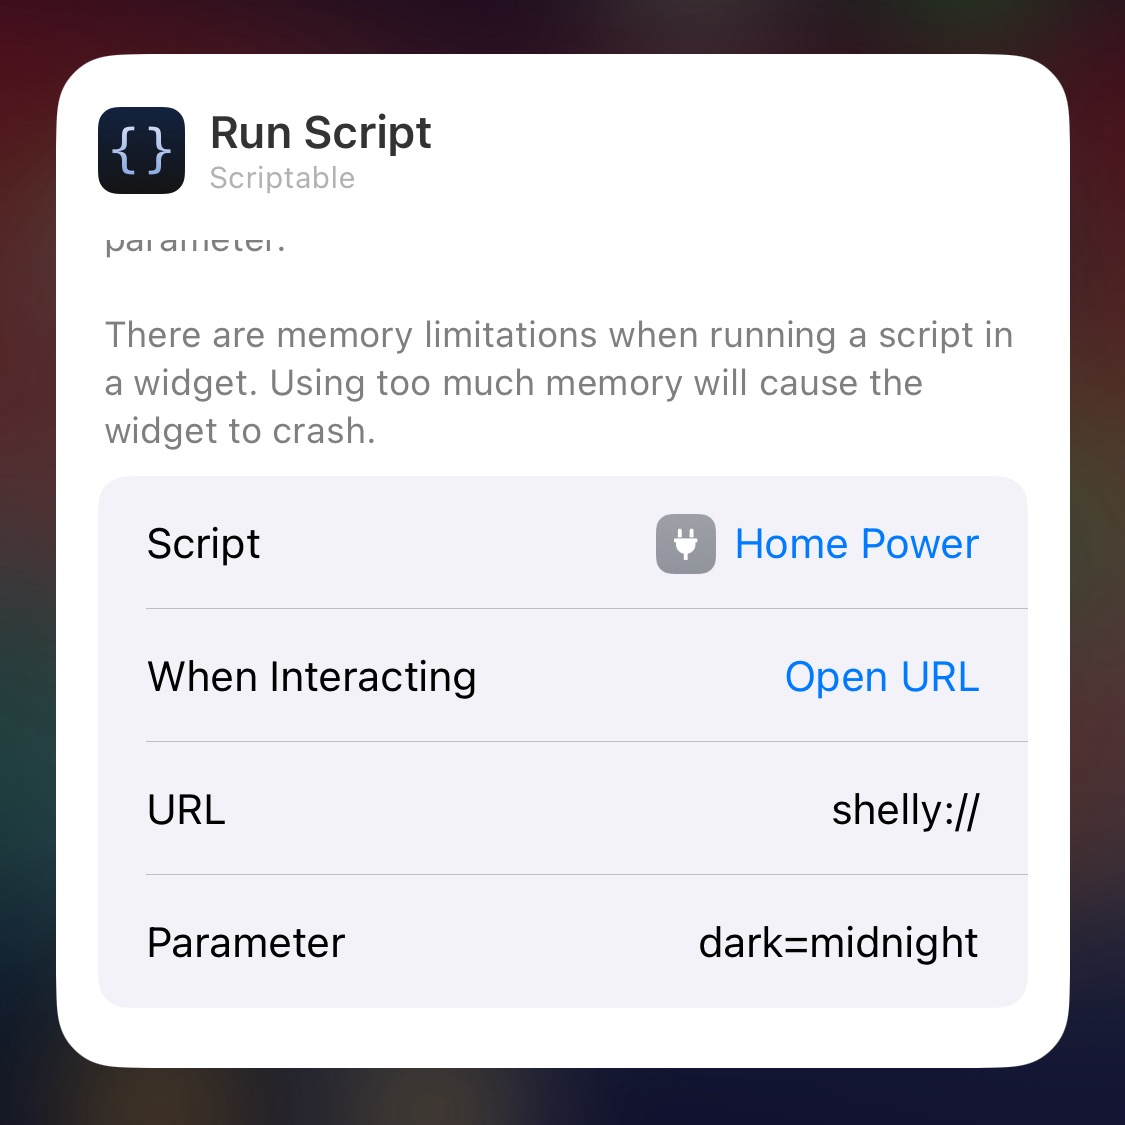
And by adding these parameters to the widget’s configuration, a tap on the widget directly opens the Shelly app:
Very handy. The parameters to enter in the widget settings are simply: ‘Open URL’ with the URL shelly://
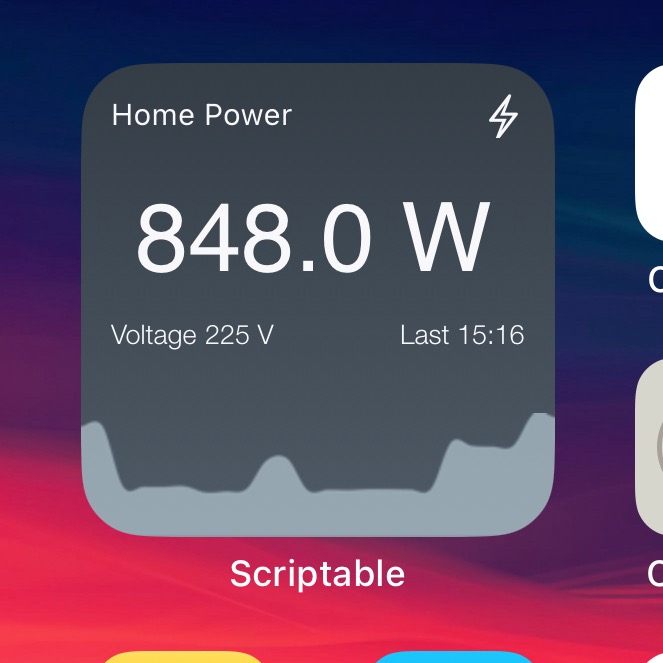
I use the same widget on macOS (on MacBook and Mac Mini) as well, and works perfectly:
Disclaimer
You might be wondering, “How can he see an address in his home LAN over 5G?” Well, as I’ve mentioned other times, my OpenWrt router has a WireGuard server, and all my devices are configured to connect ‘on demand’ to the home server from any network I’m (only on my subnets 192.168.1.0, .20 and .50).
So, I can always ‘see’ my home network (as if I were always on my home LAN), and consequently, the widget always works because the Shelly address http://192.168.50.217/status is always reachable, also with cellular connection (I also use the home’s Pi-Hole as DNS server. always).
Grafana + Prometheus
The most interesting part is, obviously, viewing these data on Grafana!
Prometheus exporter
So, I tried to figure out the best way to send the data to the Prometheus database, and I decided to use another exporter: the json_exporter.
As explained in the GitHub page, this exporter scrapes the selected points (addresses) and extracts, according to your “instructions”, the data it finds. To make it work, as with any Prometheus exporter, you need to:
- download and install the executable
- add the service to launch it at startup
- add the configuration in Prometheus
- create the file that indicates which parameters to extract from the remote endpoint
At this last point, I encountered some minor issues that I couldn’t resolve. Everything works perfectly, but the metrics extracted by the exporter are not all the ones provided by the Shelly status page, despite having indicated them.
More precisely, I can’t see in the Prometheus metrics these data:
      # Hardware Info
      - name: Shelly_em_system_metrics
        type: object
        path: '{ . }'
        help: Shelly EM System Metrics
        values:
          RAM_Total: '{.RAM_total}'
          RAM_Free: '{.RAM_free}'
          Fs_Size: '{.fs_size}'
          Fs_Free: '{.fs_free}'
          System_Uptime: '{.uptime}'
I tried replacing { . } as the root path with { $ } and testing different configurations, but Prometheus still doesn’t see these data.
They aren’t crucial data, but since Shelly provides them, why not use them?! It’s a bit of a shame. So, if you have any advice or idea, I’d be grateful.
Grafana
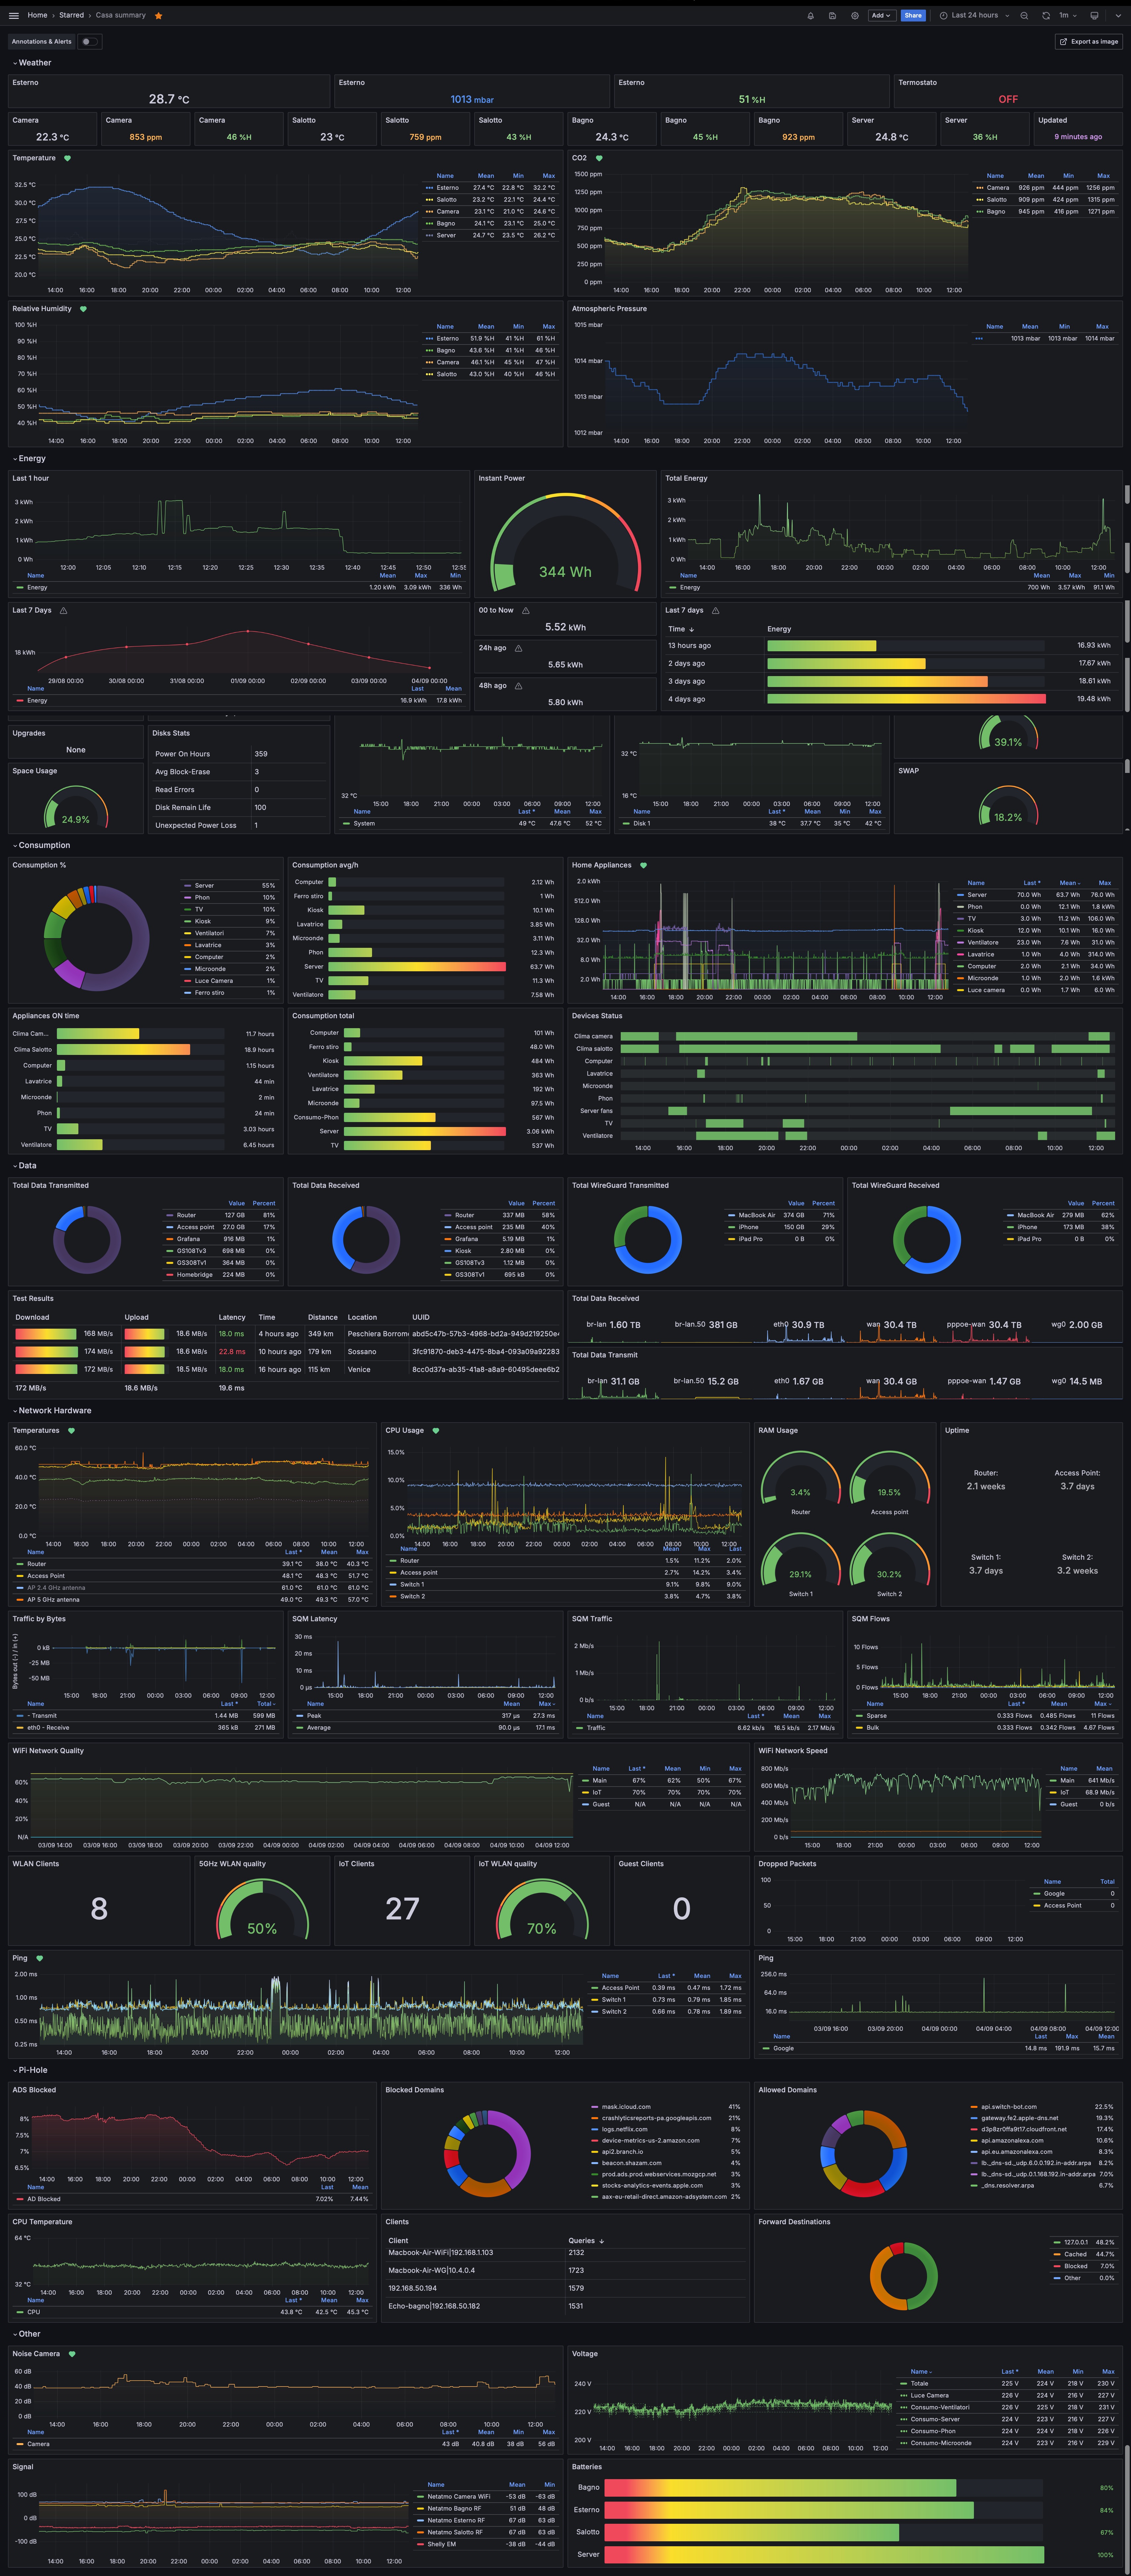
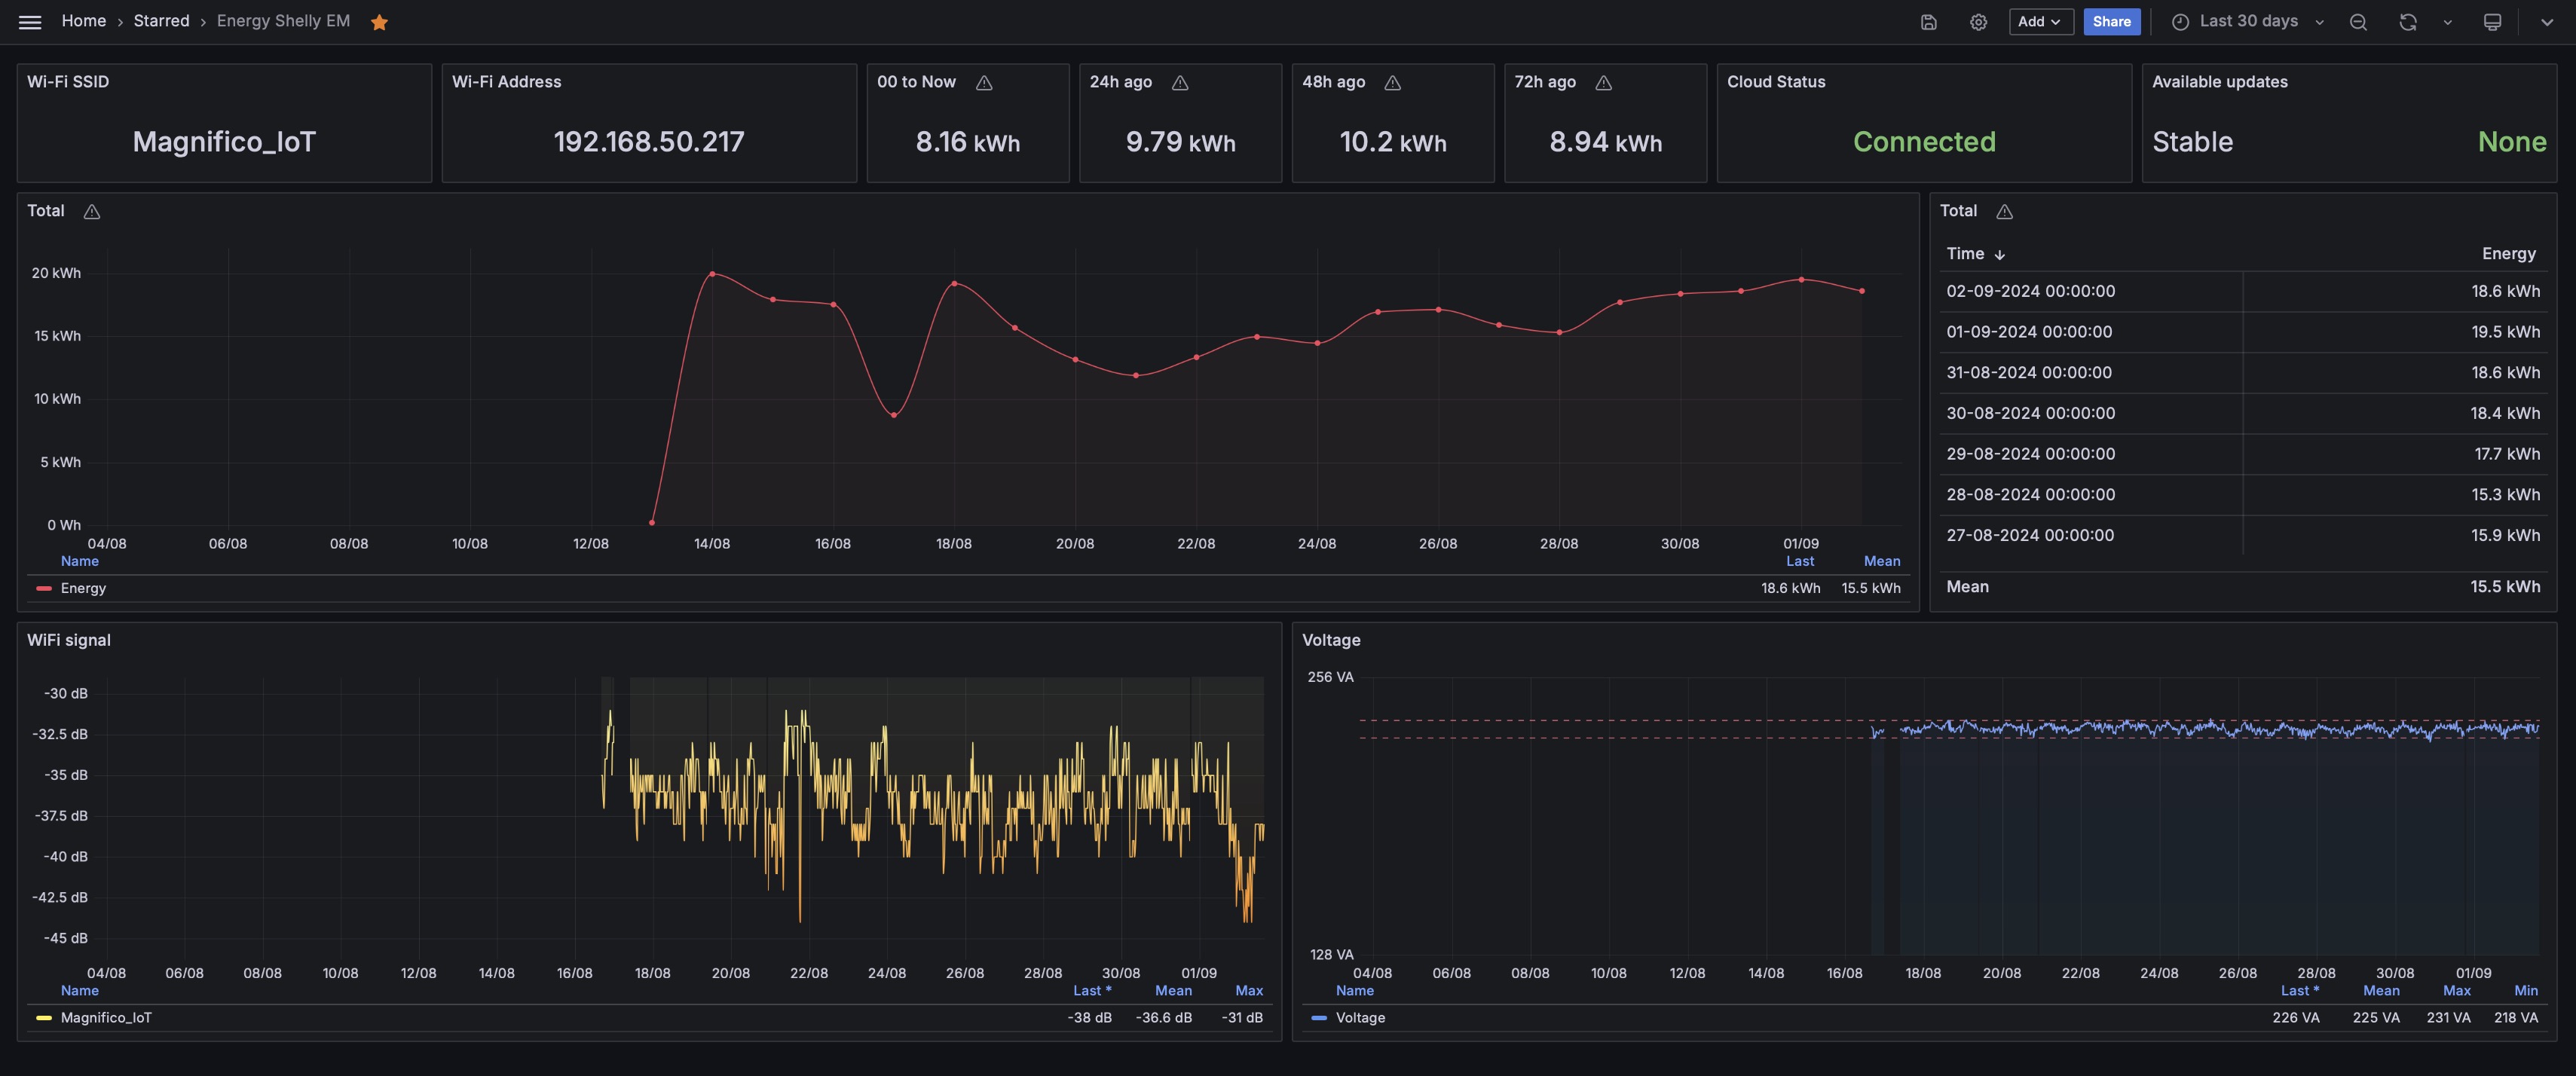
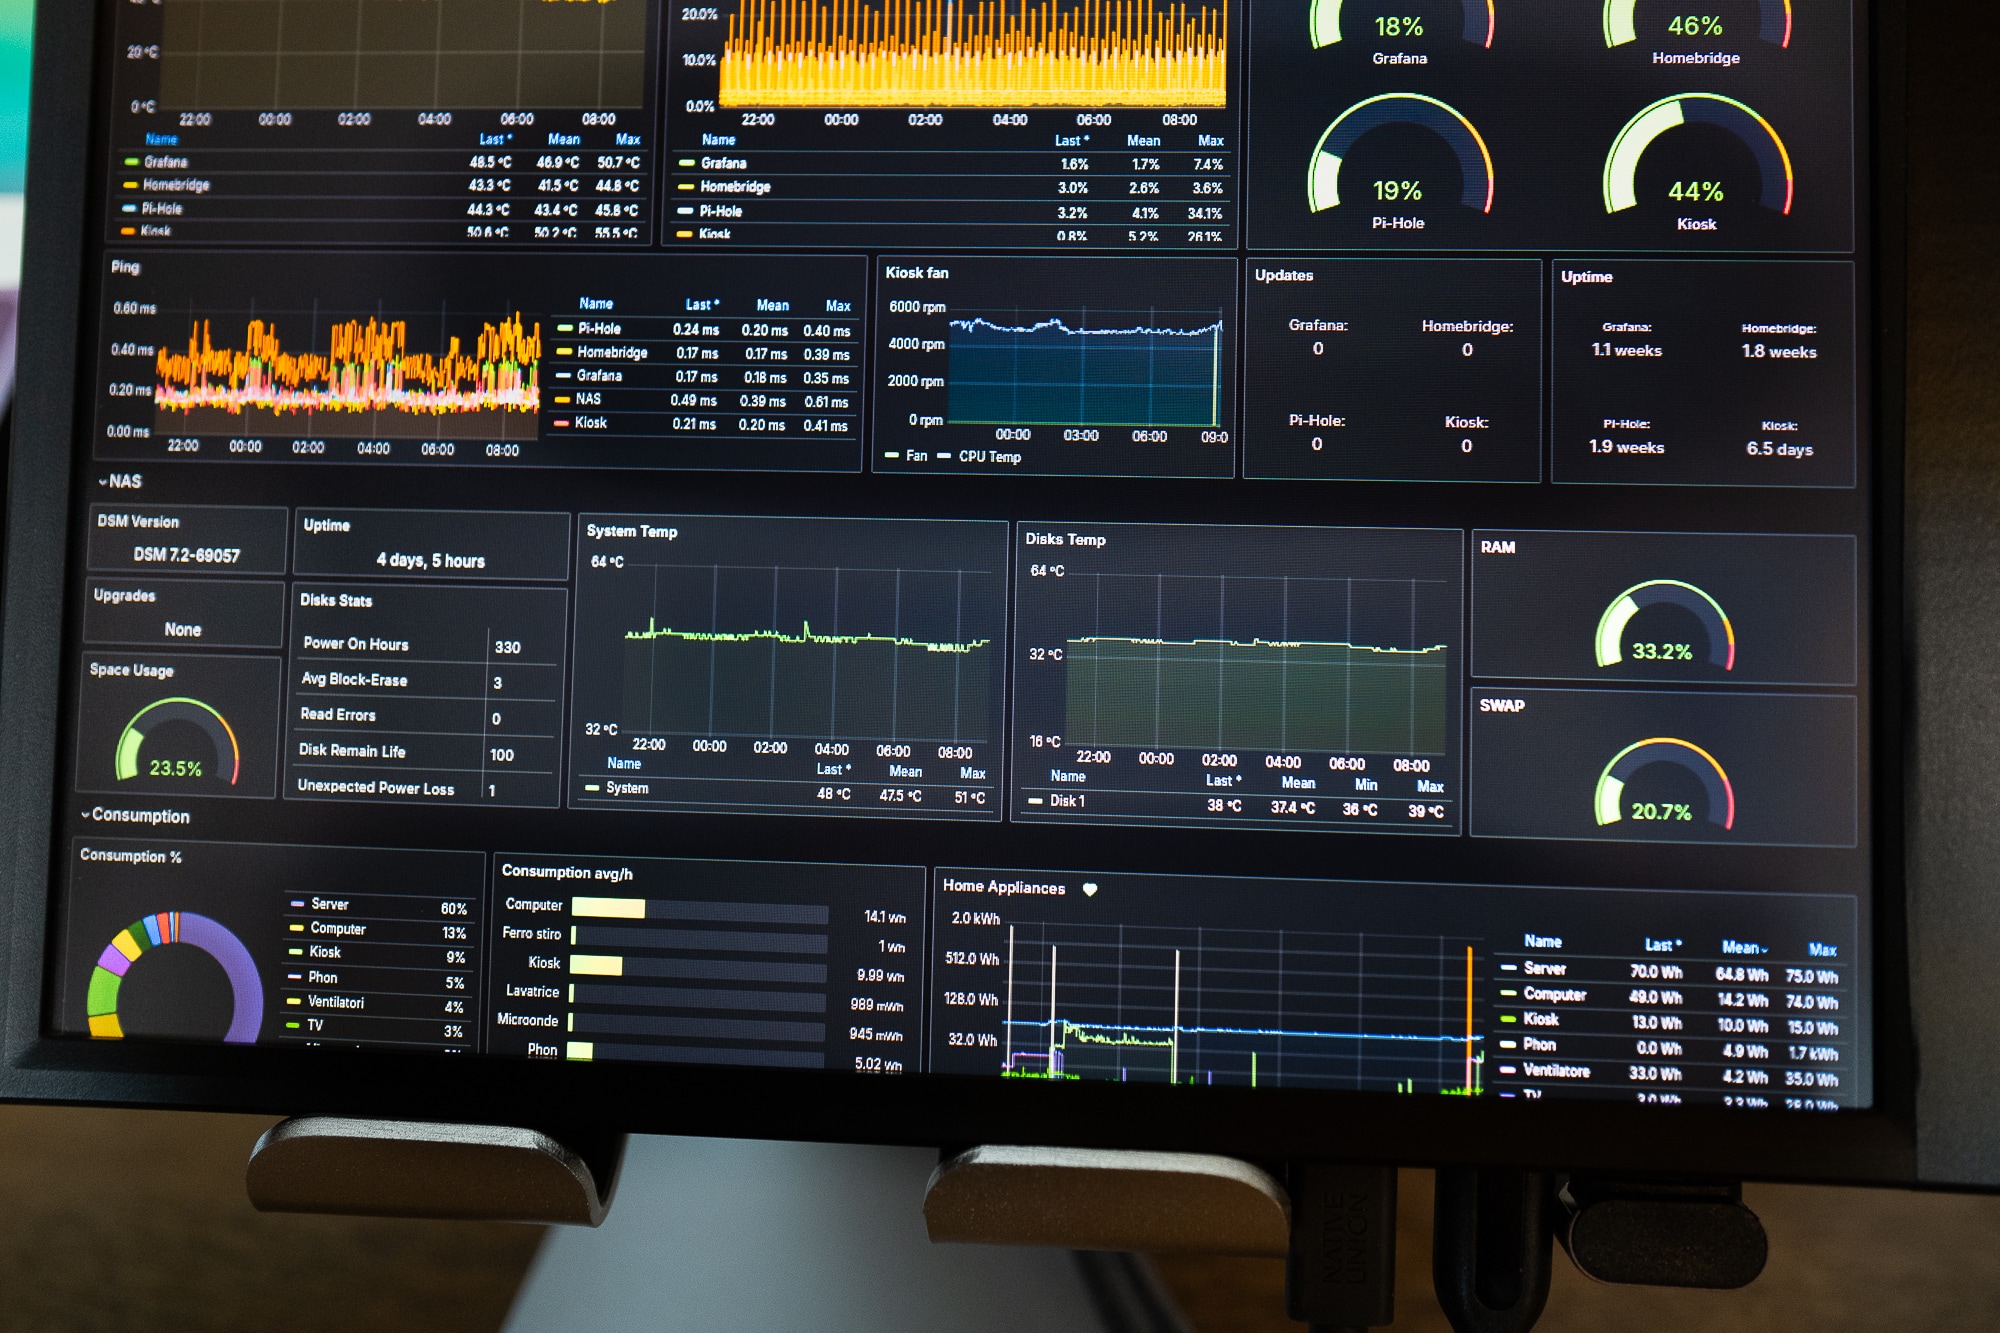
In Grafana, I set up a separate dashboard for the Shelly and added some useful info to the summary dashboard so that the consumption is always easy to see on the kiosk display (see the intro photos):
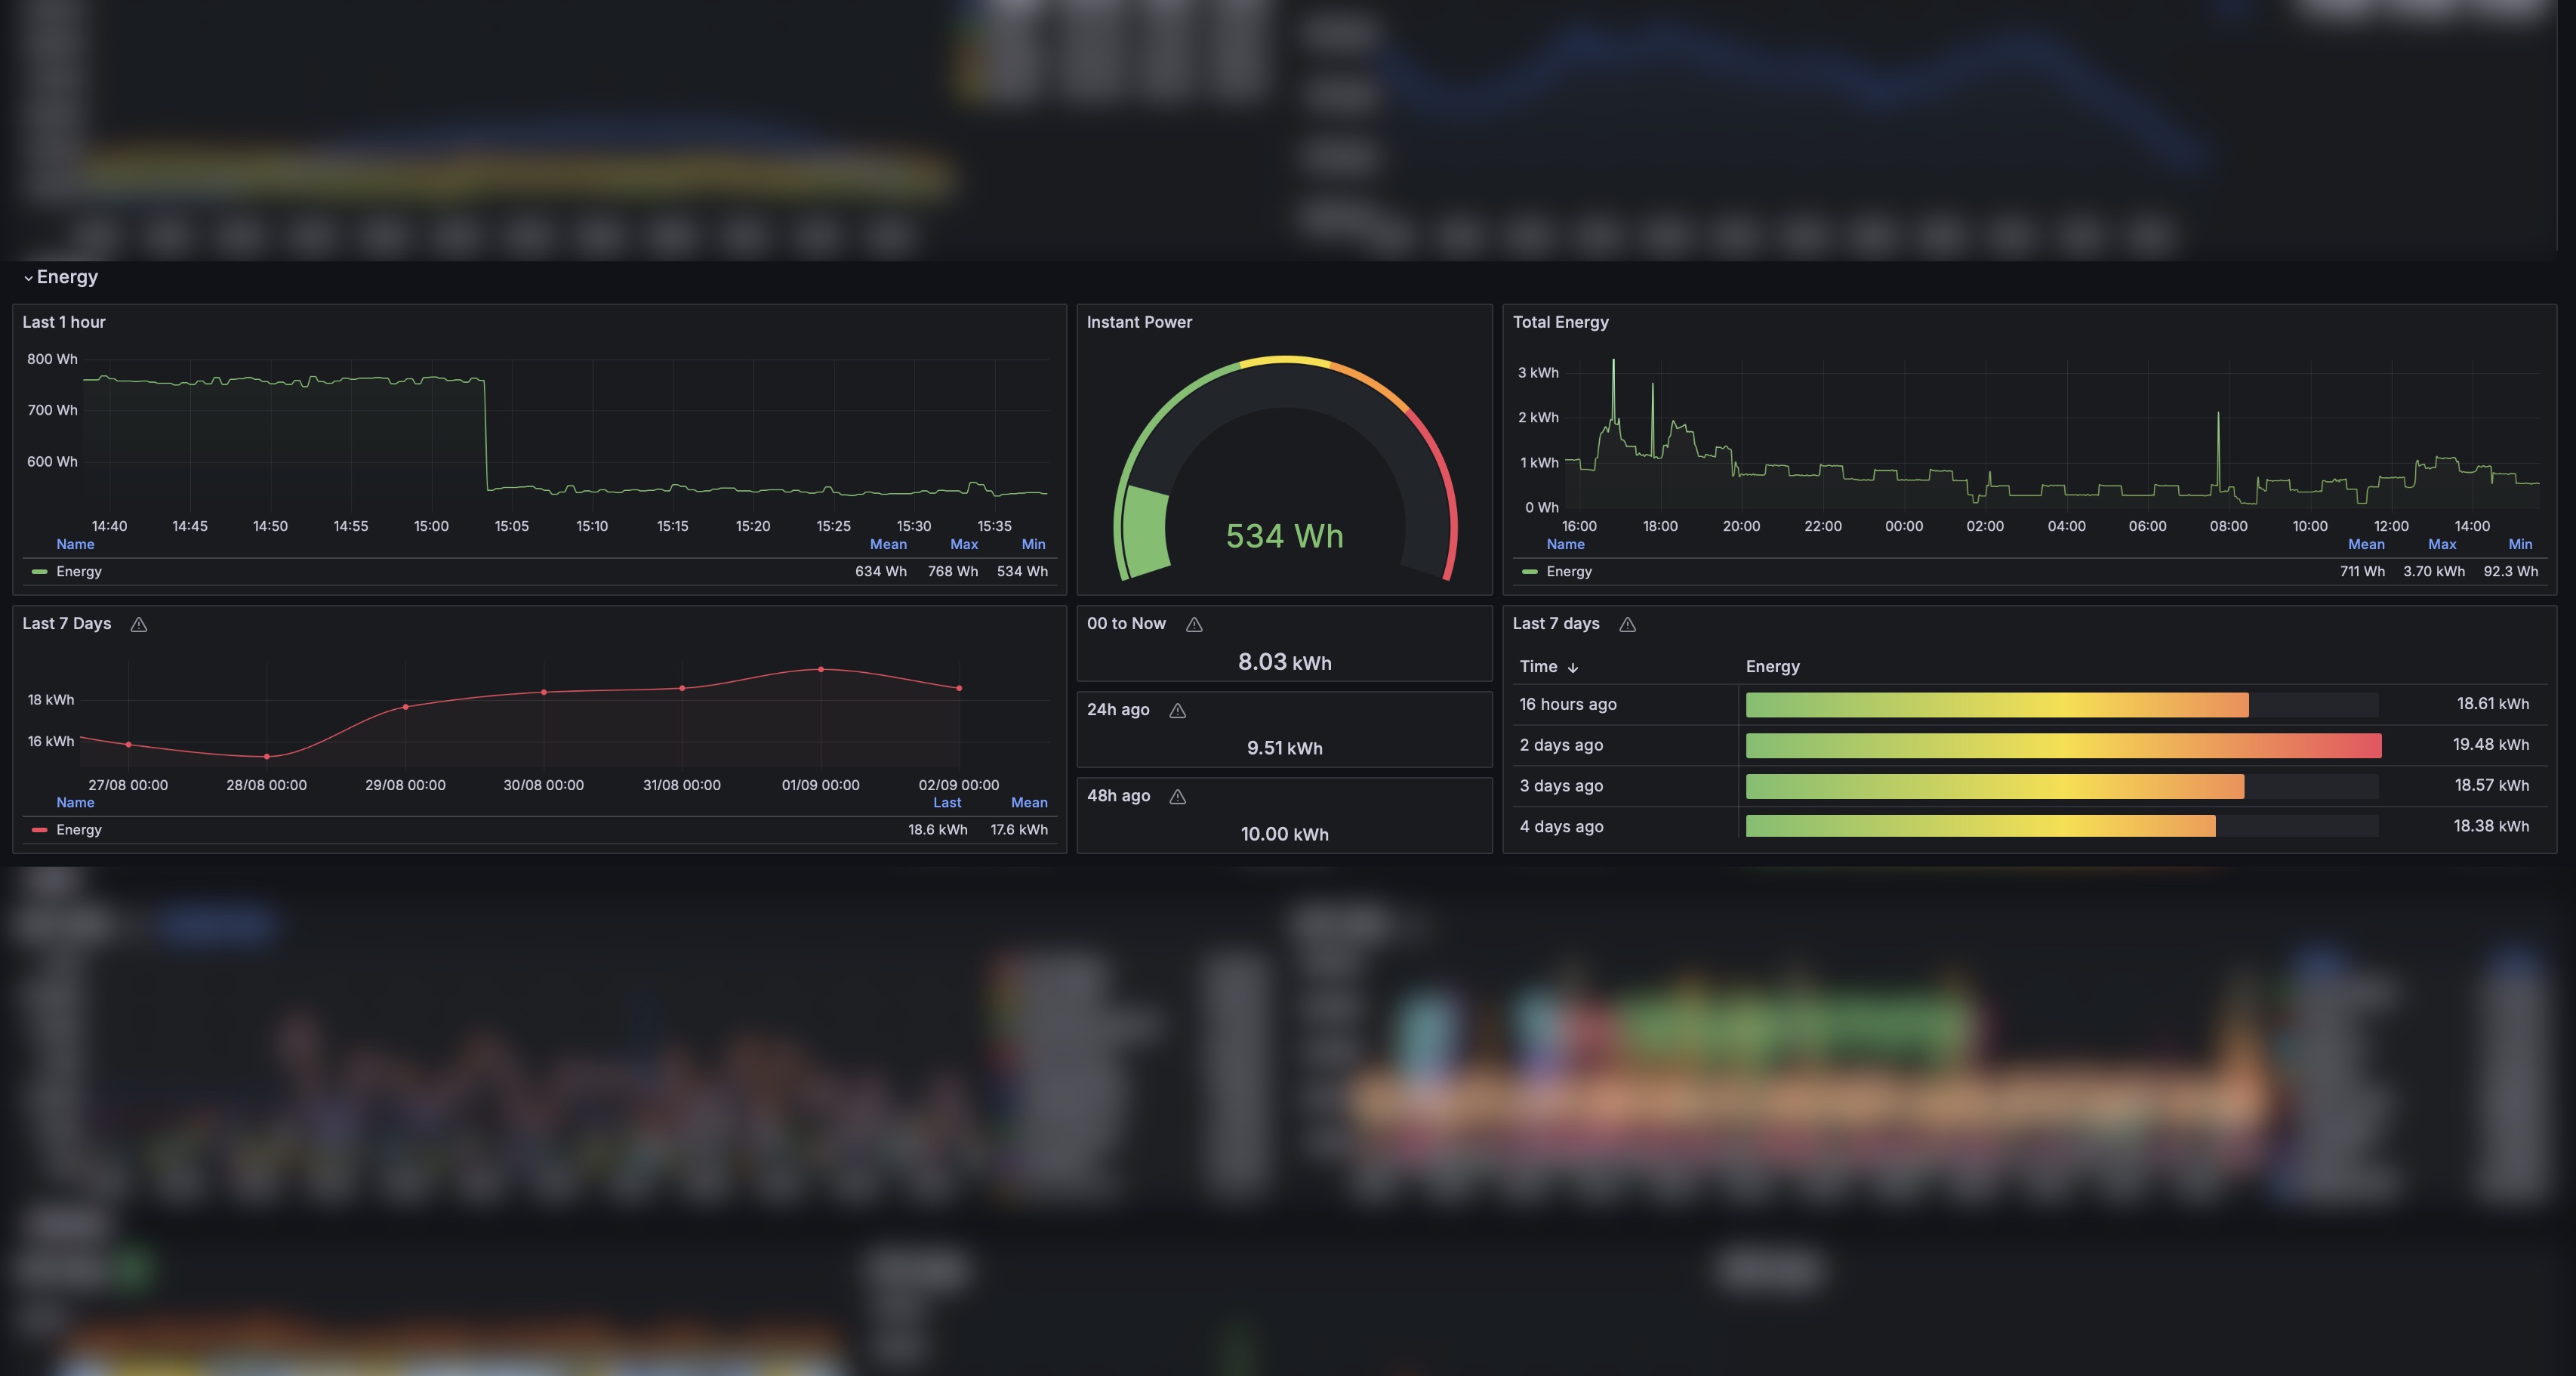
And its dashboard:
The more useful panels to me are:
- last 1h consumption timeline
- istant consumption gauge
- last 24h consumption timeline (or whatever the dashboard is using as time-frame)
- comparing consumption from midnight until now with the same period 1, 2, X, days ago
- the trend of consumption in the last week
- the specific amount of kWh used each day of the last week
But I just installed the Shelly, so over time I will better understand which informations are more useful to me and build the panels accordingly.
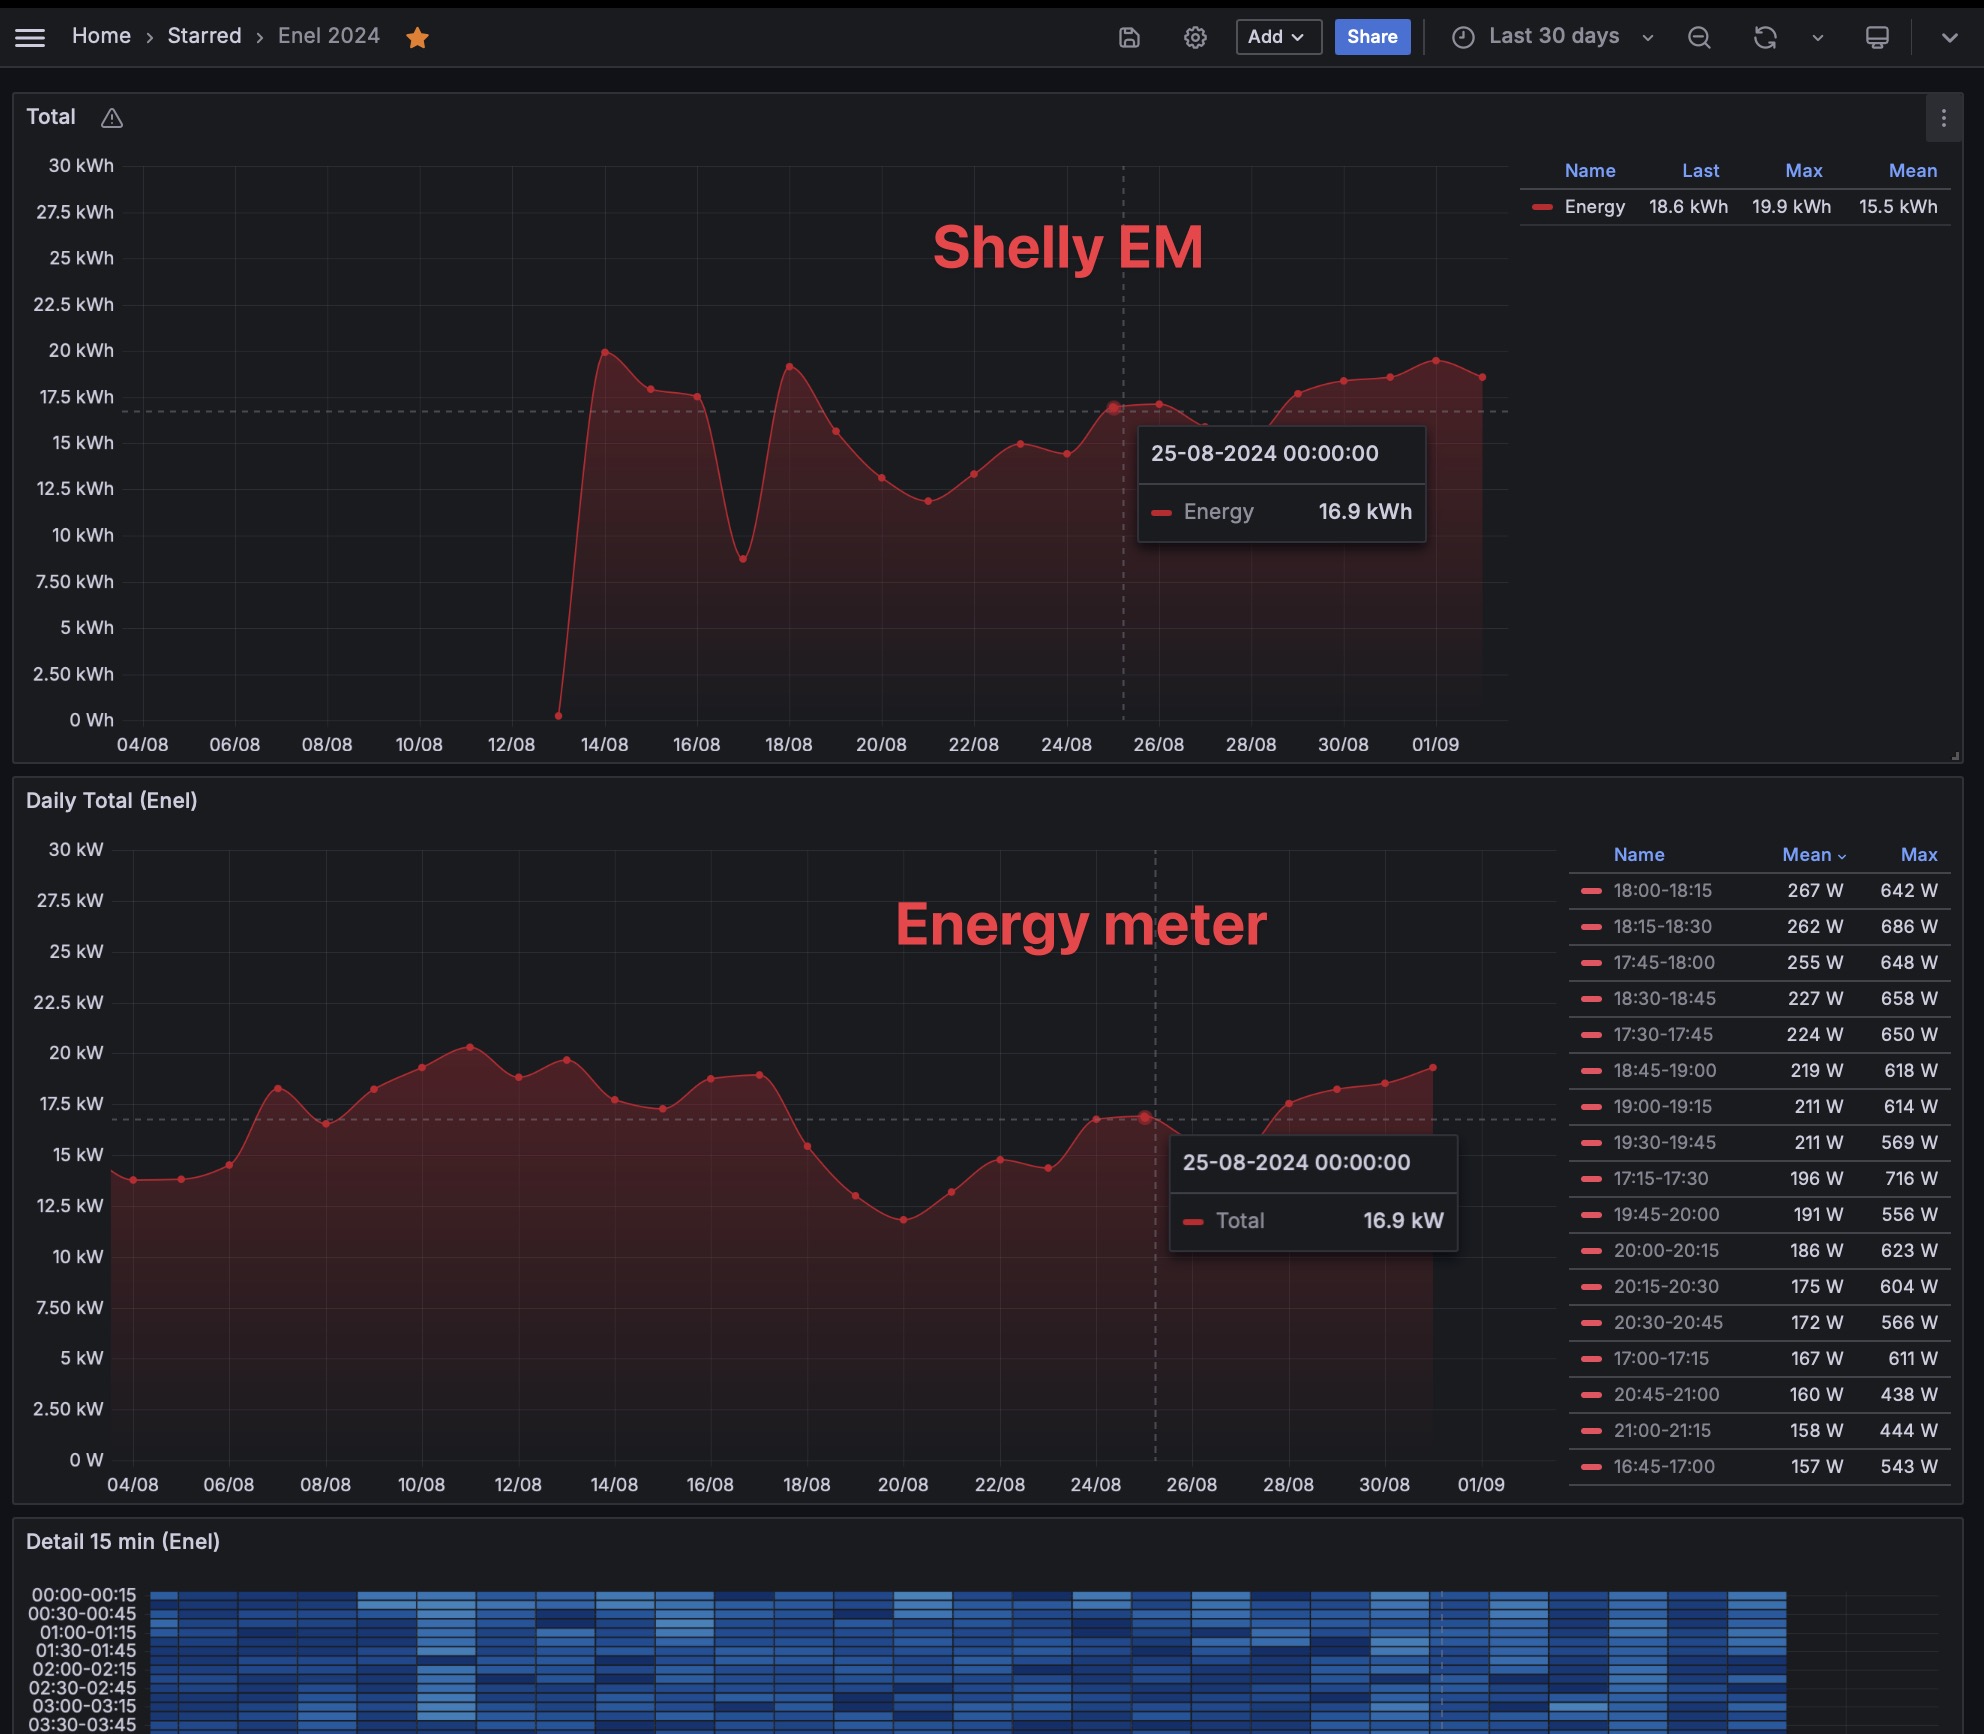
Oh, lastly: I always have the data exported from the energy meter of my provider, as I had explained here. And I realized that this Shelly has a very low discrepancy with the “real consumption”.
NAS Synology
I’ve always been pretty skeptical about NAS because I usually store my small amount of data on external drives that I connect directly (and power on) when needed. In a NAS, instead, the disks (especially older 3.5” platter HDDs) are always spinning, which makes them more prone to breaking.
These are the amount of data I have on my Macs:
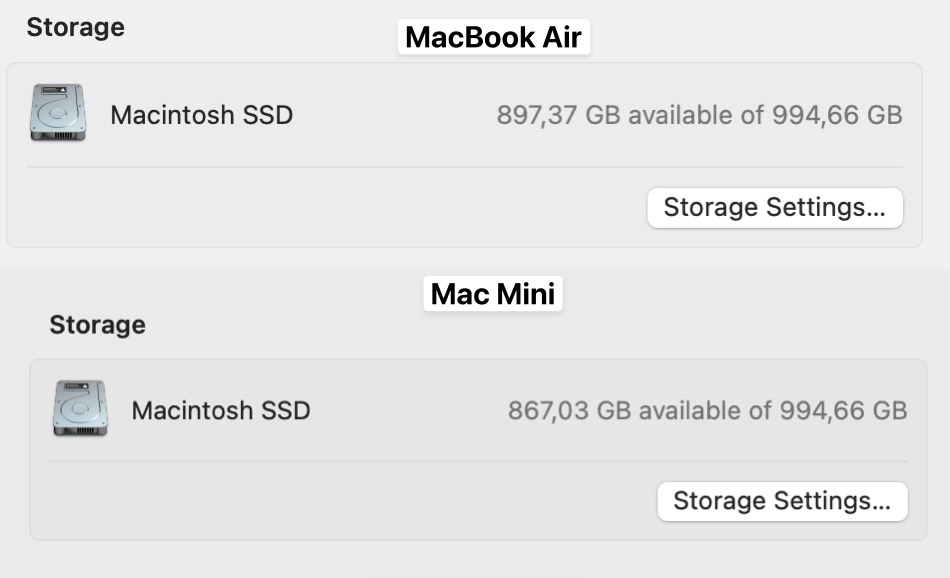
So, now that SSD prices have gone down, I’ve decided to give NAS a try, especially since I can easily fit everything with 1 or 2TB of SSD storage. Translated in terms of cost: around €80-90 for 1TB and €130-140 for 2TB.
I started to search for the best NAS to suit my needs, with these characteristics:
- Brand: Synology, because I already know them quite well and I don’t want to go crazy with home made solutions
- One bay: I don’t need two bays because I don’t back up a disk onto a disk next to it and that shares the same power supply, I don’t think is very safe.
- Not powerful: it will run nothing, aside a backup and a photos app
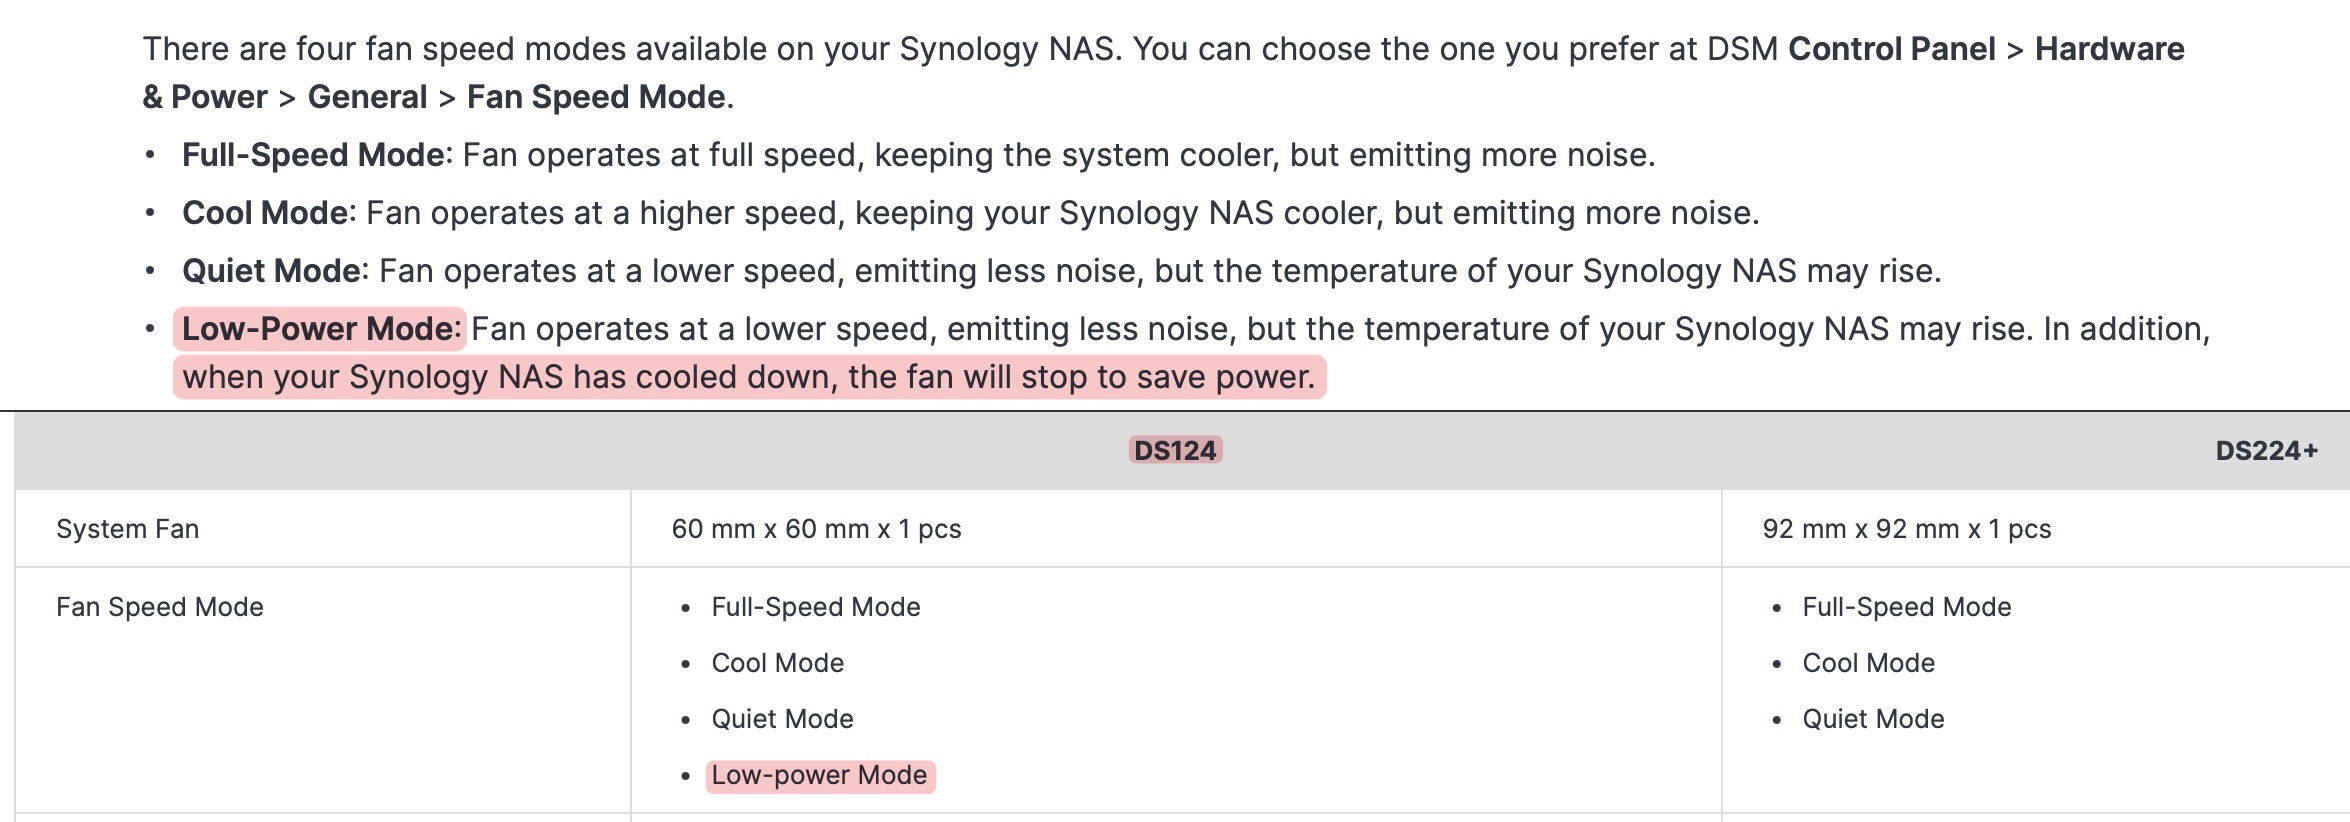
- Silent: I hate the fan noise
With these specs there were:
| Model | Specs |
|---|---|
| Synology DS 120j | 2 cores CPU @ 800MHz and 500Mb of RAM for about 130€ |
| Synology DS 124 | 4 cores CPU @ 1.0GHz and 1024Mb of RAM for about 180€ |
I chosen the DS124 because the hardware differences are huge and the price is not that high.
Then I bought a 1TB SSD WD Red for NAS, but when I realized that it would be shipped in one month, I changed the order for a Crucial MX500 1TB.
Software
There’s nothing special here, since I used the Synology DSM OS, but I haven’t enabled the shared drive and other “connected” stuff, since I will use it always through the VPN, I don’t want to expose it on the internet.
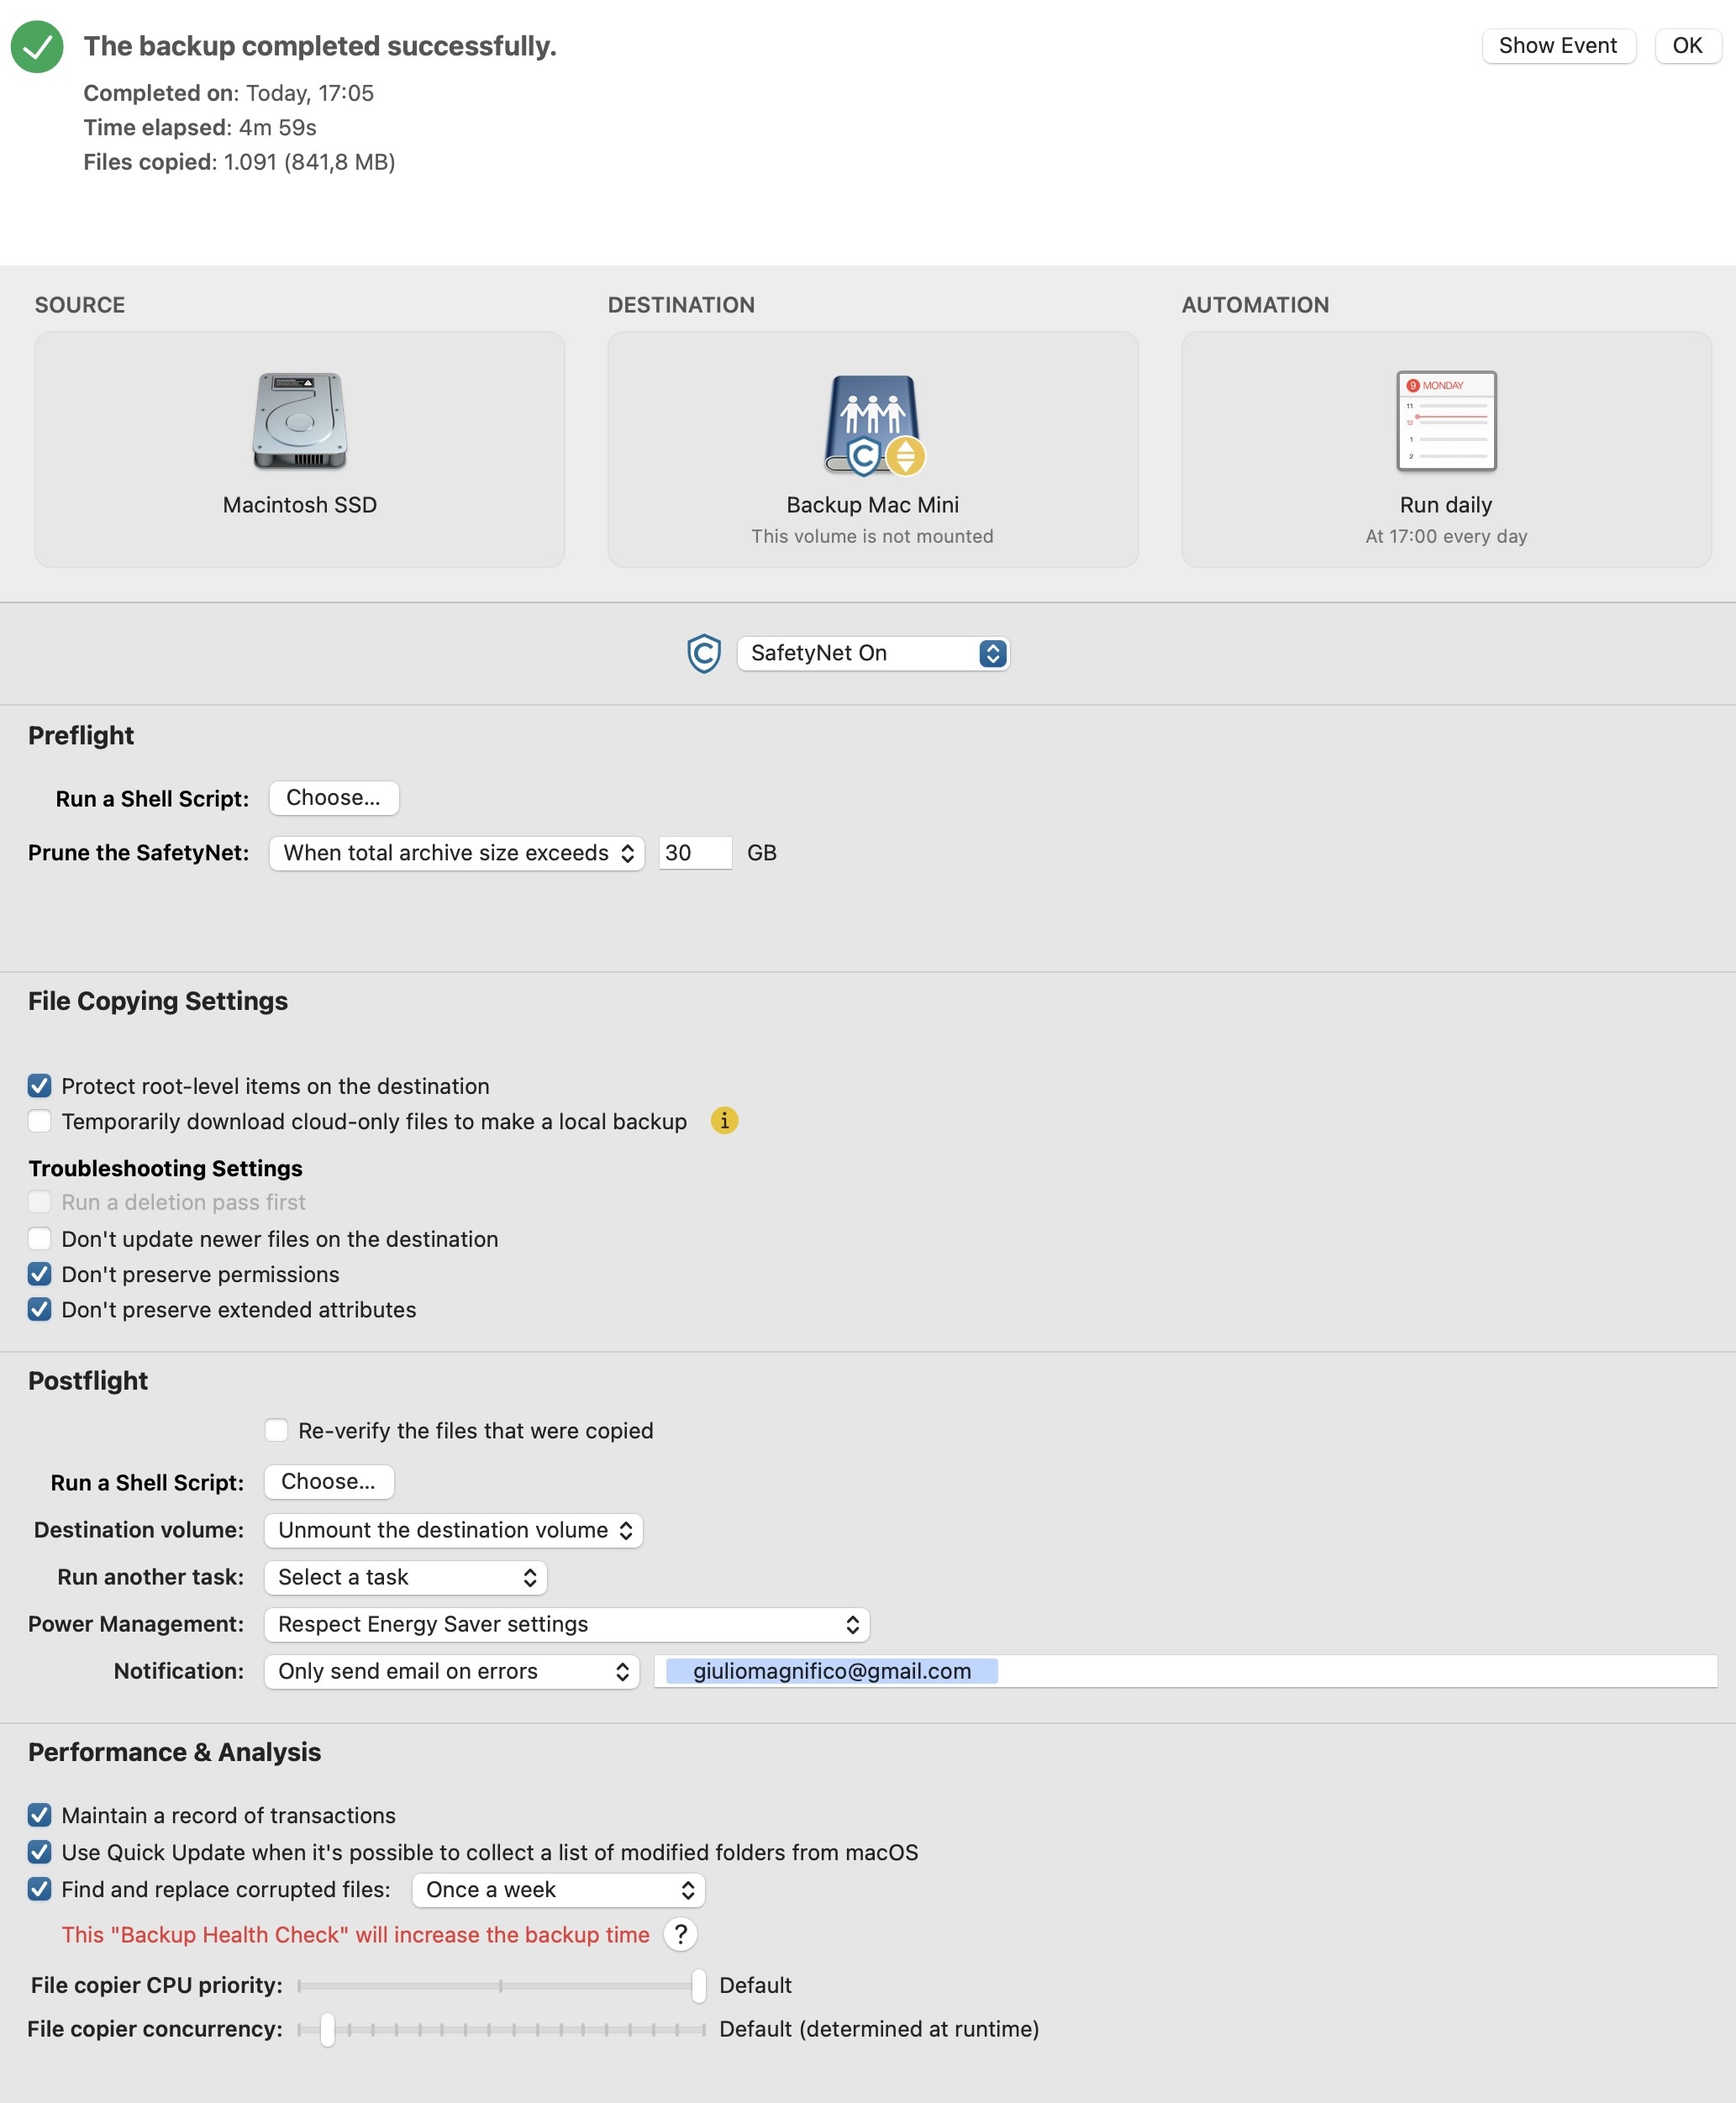
Then I activated the backup of the Mac Mini on it using Carbon Copy Cloner:
And the Synology Photos app because I want to keep all my “everyday” photos there. Until now were on Google Photos (they are only photos taken with the phone and various memories, it is not my Lightroom library).
So I used Google Takeout to download all the photos: 4 archives of 50GB each. Unfortunately, Google Photo doesn’t give you the option to see the photos not in albums, so I had to do quite a bit of manual sorting and lost 4/5 nights, but in the end, I managed to catalog everything and much better than before (because thousands of photos weren’t in any album).
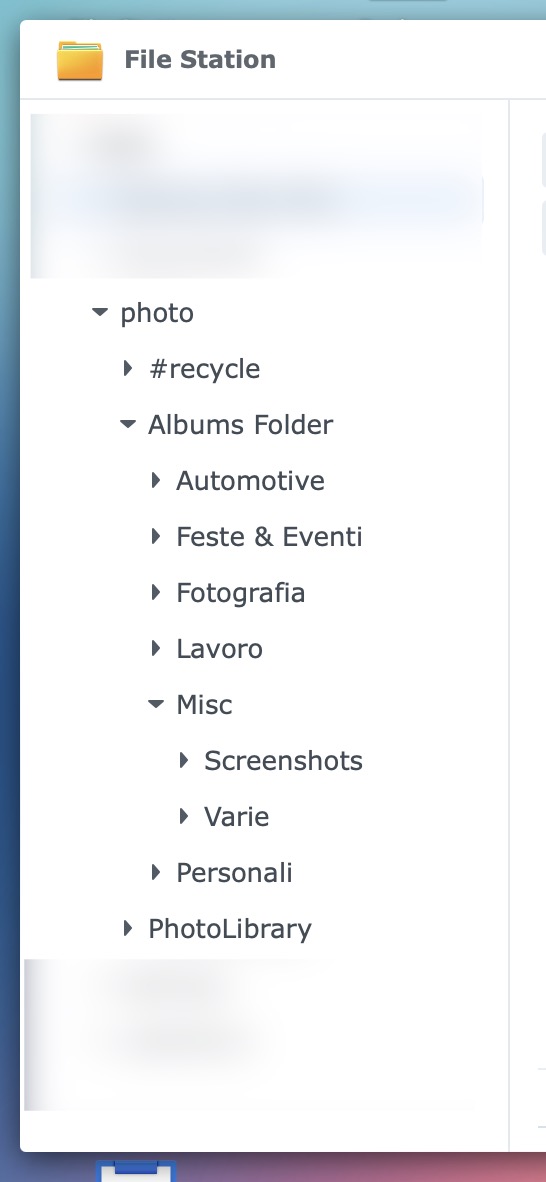
Now my Synology Photos library is organized in this way:
And the view Synology Photos app:
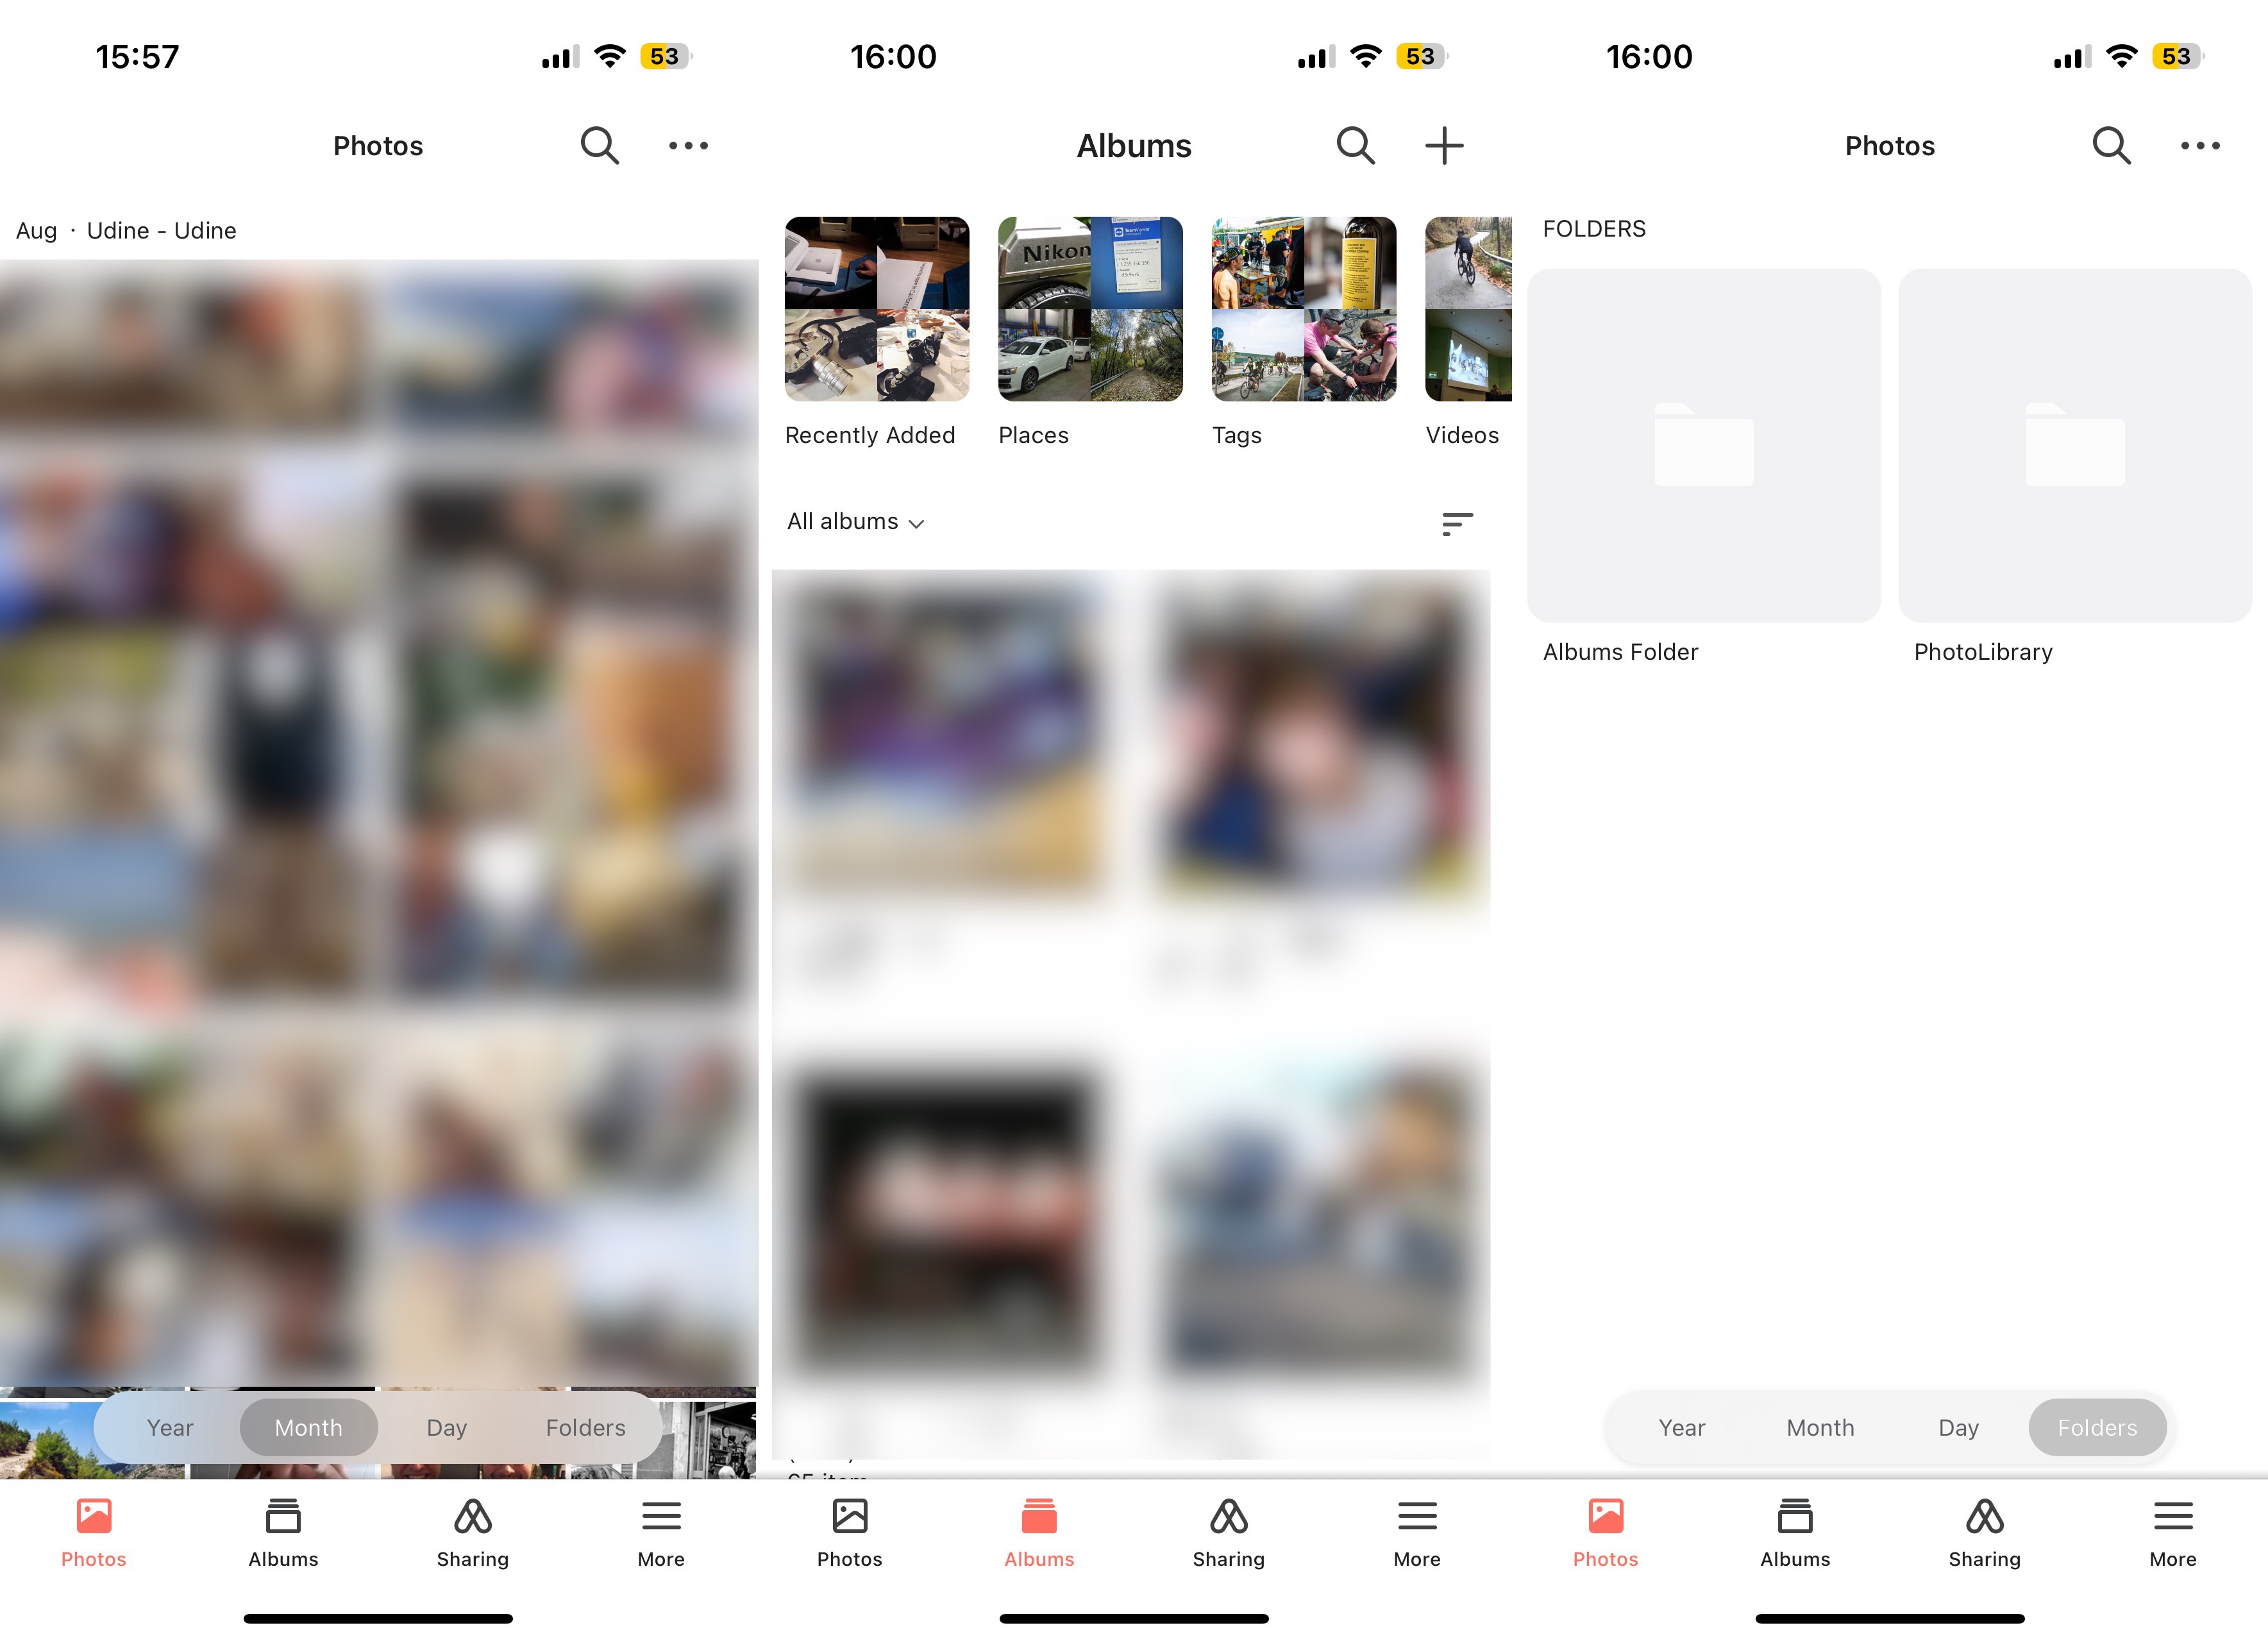
In short, I decided to directly upload the folders containing the photos of an event to the Synology, which are visible in the Synology Photo app in the “folder” view, and then I create an album from each folder, just in case I want to have an album that’s more easily accessible from the “Album” tab in the app.
Then I configured the app to automatically upload the photos from iPhone not inside the “Albums” folder but in the “Photolibrary” folder, so if I upload some photos that I forget to put in an album, I can easily find them in my library and organize them or delete.
Unfortunately, you can’t have a single library and let Synology Photos to manage it, because if you upload automatically a photo that you don’t organize immediately, it will be very difficult to find them later. Since there is no view “for photos not in an album”, just as there isn’t on Google Photos (and I don’t understand why).
Backup
Backing up an SSD inside a Synology, on the same Synology but on a disk beside, doesn’t make lot of sense for me. Because it would be always active with power (and this can wear off it) and if something happens to the Synology, this can affect both disks, damaging also the backup.
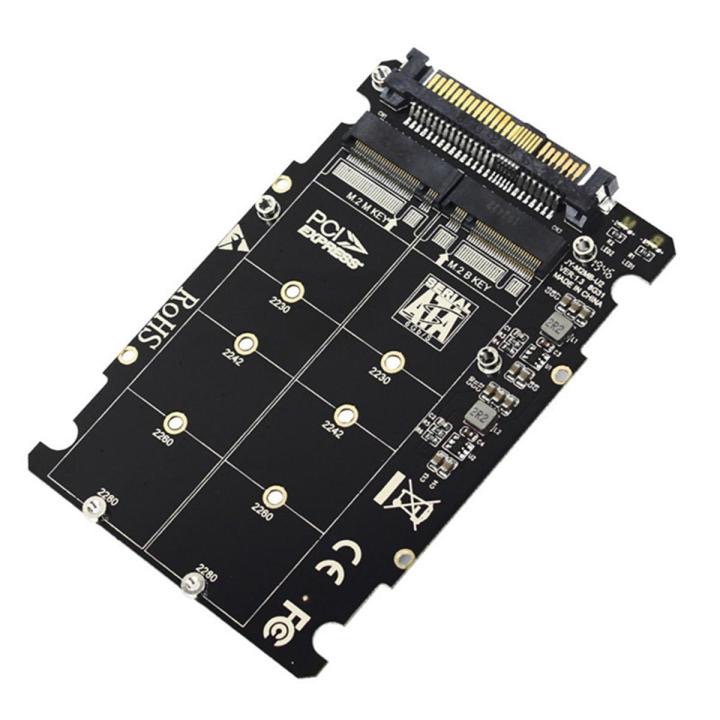
So I took a spare M.2 SSD I had at home, connected it via USB3, and thanks to the Hyper Backup app, I do automatic backups once a day on it, preventing it from wearing out and heating up by staying powered on inside the Synology.
Meanwhile, for the MacBook Air backup, I still use an external USB-C M.2 drive with incremental backup, which I always bring with me (inside the backpack).
For 2 reasons:
- To back up to the Synology, I would have to open the MacBook, but when I’m back to home I leave it in the backpack, and sometimes I don’t charge it for 3/4 days. And even when I charge it, I don’t “open the screen” and it stays in sleep. So it would never see the network drive.
- If I need to recover big files, when I’m out of home, I would have to do it via internet connection which is often slow and less reliable.
Grafana + Prometheus
Could I haven’t monitored the NAS with Grafana and Prometheus? Obviously not, so I did it.
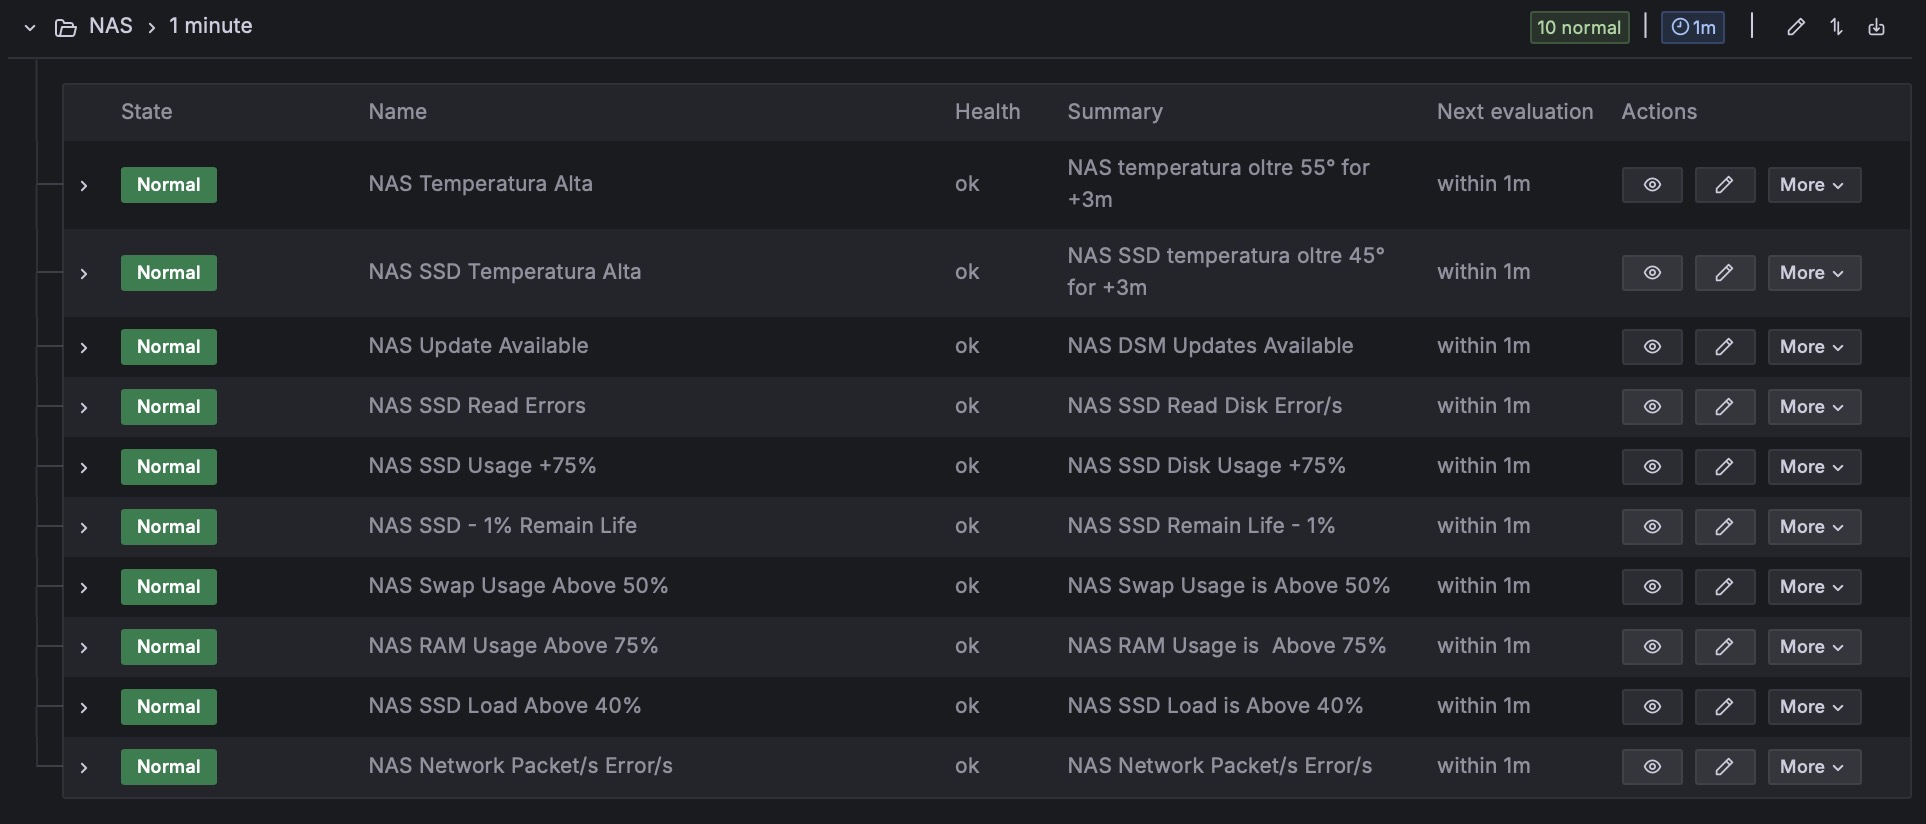
However, I encountered some “hassles” while trying to monitor the Synology DS124. I explain: using the snmp_generator the generated file ‘snmp.yml’ initially could read very little information, so I had to manually add/implement all the various OIDs, partly on my own (using ‘snmpwalk’) and partly searching online. In the end, I succeeded and I went able to build a pretty detailed Grafana dashboard.
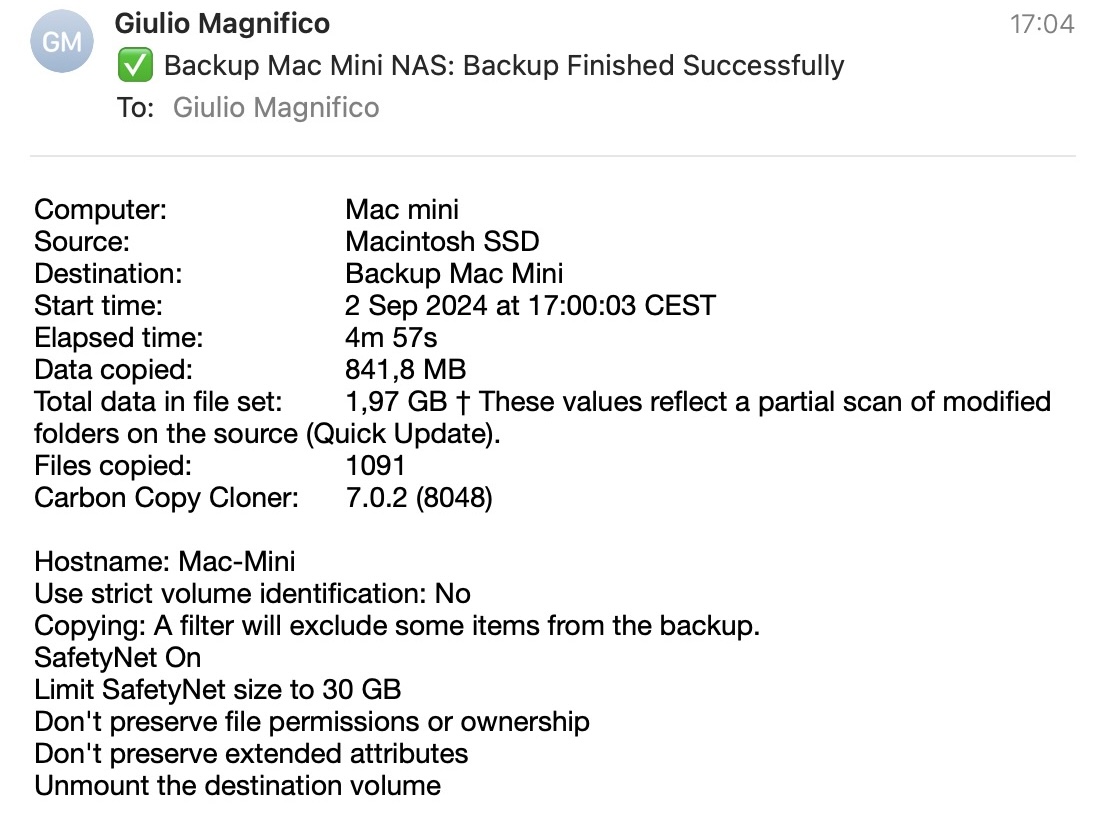
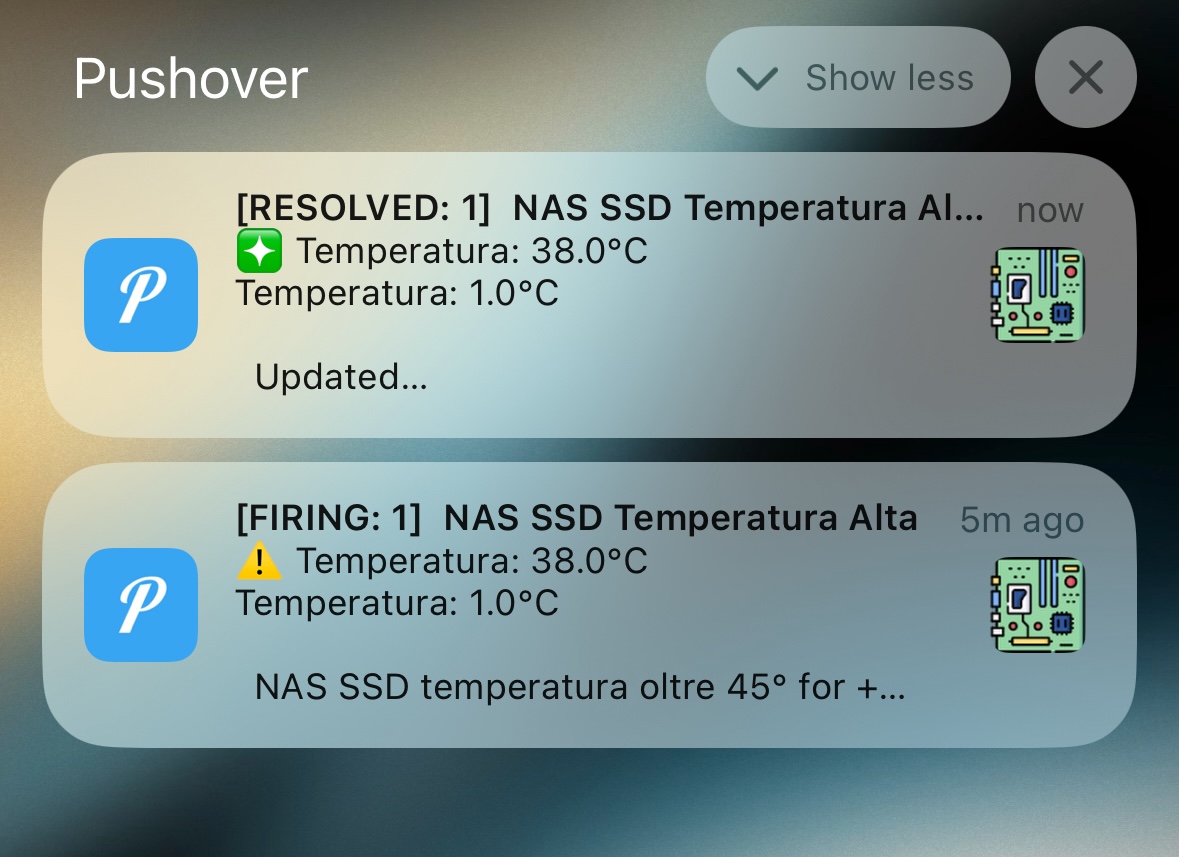
And in this way I can have all the notifications I want on my iOS/macOS devices:
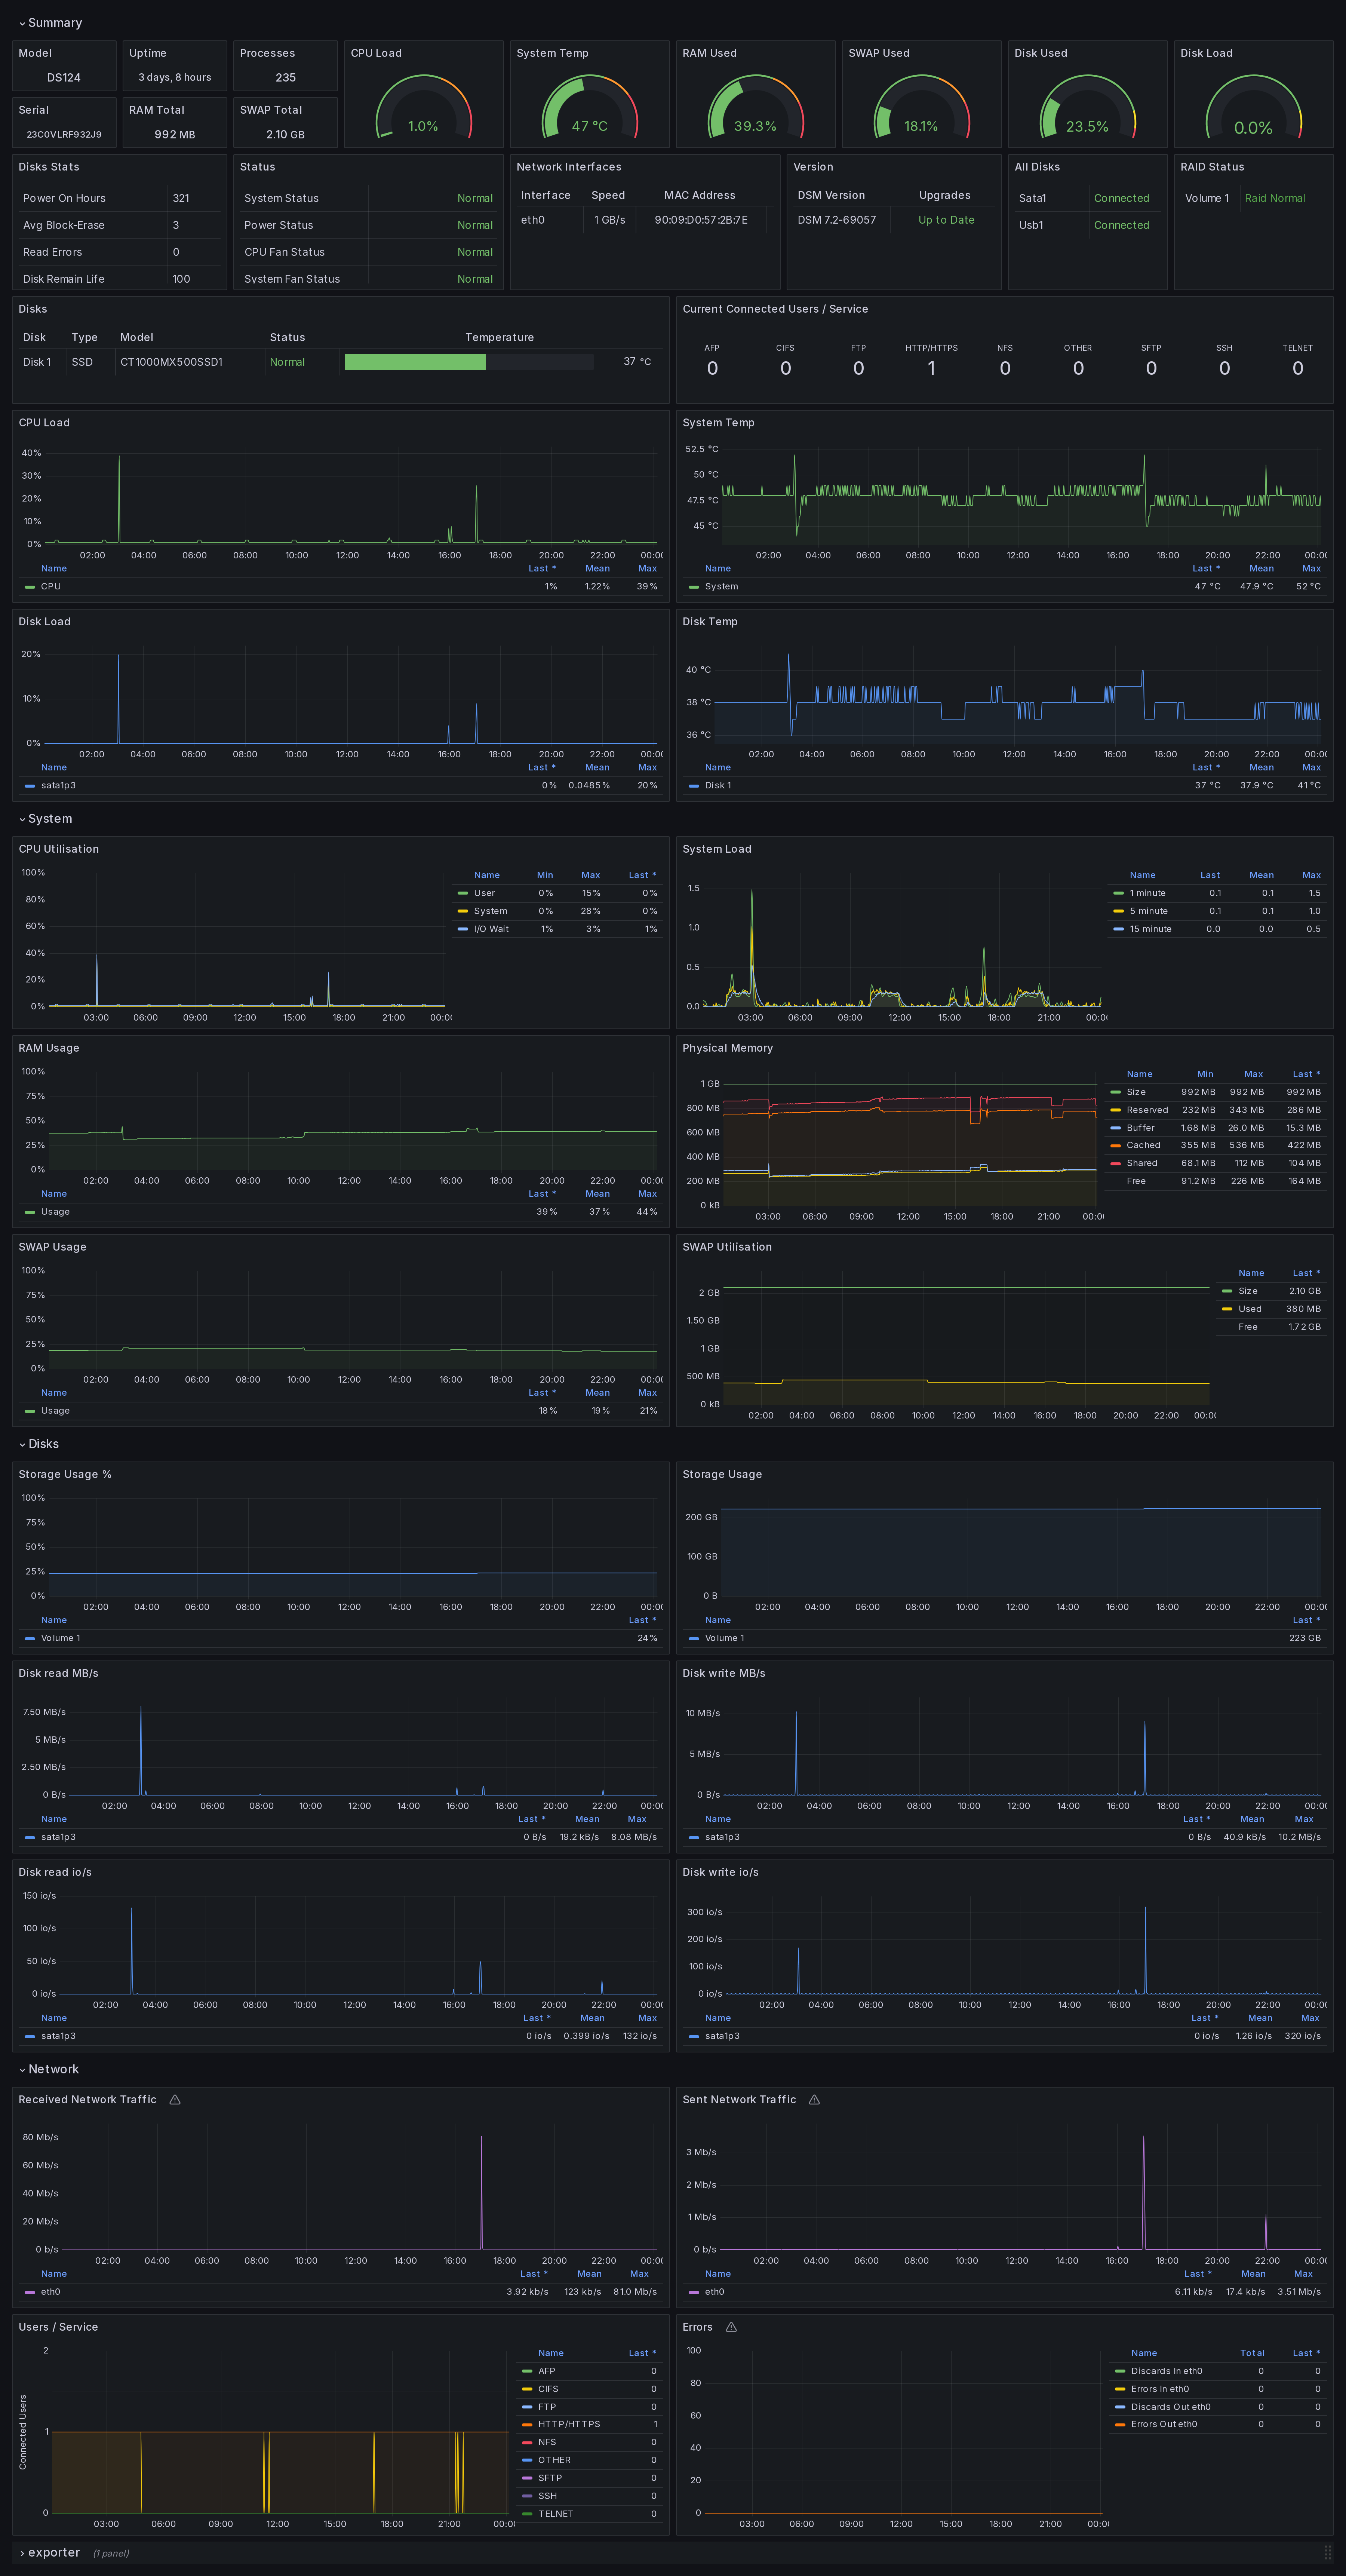
And the useful section in the summary dashboard for the kiosk display:
Conclusion
There’s no much else to say…oh, I almost forgot: the consumption.
The consumption of this Synology DS124 is obviously minimal having an ARM architecture: 3/4Wh when idle and 10/12Wh under load. So the consumption of my entire server (aka “home forniture”) increased from 56/58Wh to an average of 62/64Wh.
Hope that inspired you. If you have any questions, just ask me in the comments below.
Below I’ve also added detailed photos of the hardware inside the forniture and the full summary dashboard that I display/use on the kiosk.