I’m encountering a somewhat controversial dilemma…in a few words: I can either write about what I’ve done, or I can do something.
Let me put it this way: I’m often caught between doing (new) things and writing about them. Honestly, I’d rather dive into solving problems and making improvements than document what I’ve done, due to this, as soon as I solve one problem, my mind jumps to a next thing, which means I rarely stop to take my time to write about it. And I end up with a bunch of topics piling up, and it takes me weeks to sort them all out. So I’m sorry for the delay, but I’m really passionate about sharing, because I believe in an open internet where everyone helps each other as members of a (sort of) community. And also because It’s the way I’ve learned, continue to learn, and will learn.
Anyway, possibly due to the reasons mentioned earlier and the extended time lapse since the last “update post”, this marks quite a significant upgrade, both in hardware and software. Here’s a list of the new or improved tech bits:
- Summary photos
- I installed a Raspberry Pi 5 with an NVMe drive as a Grafana server: link to chapter
- I added a 14” touchscreen monitor to view the dashboards, driven by a Raspberry Pi 4B (which was the old Grafana server): link to chapter
- I unified many panels into a single dashboard, so I can always see everything at a glance on the display and get daily reports: link to chapter
- I added the monitoring of the logs of all network devices and Raspberry Pis in Grafana, using Loki and Promtail: link to chapter
- I integrated real electrical consumption data, updated every 15 mins, from my electricity provider using the Infinity plugin for Grafana: link to chapter
- I added the blackbox-exporter Prometheus exporter to monitor the state of this blog: link to chapter
- I added and monitored a new 8-port switch with OpenWrt: link to chapter
- I installed an external USB3 SSD to the Raspberry Pi 4 (the Pi-Hole/Unbound server): link to chapter
- I moved the older iPad Air 2 to the bathroom: link to chapter
- Conclusion
As usual, before diving into the details, here's a list of the steps in the evolution of my home setup for those who want to understand what brought me to this point:
- Jan 14, 2022 - My hardware and software setup for a new house
- Jun 02, 2022 - My network home setup - v2.0
- Aug 14, 2022 - My network home setup - v3.0
- Dec 12, 2022 - Some custom push notifications that improved my life
- Dec 19, 2022 - Retrieve a scheduled report of your Grafana dashboards via mail
- Jan 5, 2023 - My network home setup - v4.0
- Sep 14, 2023 - My network home setup - v4.5
- Now > the details of this last update.
…and a quick chapter with a few photos to give a visual understanding of what I’ll be writing about.
Summary photos
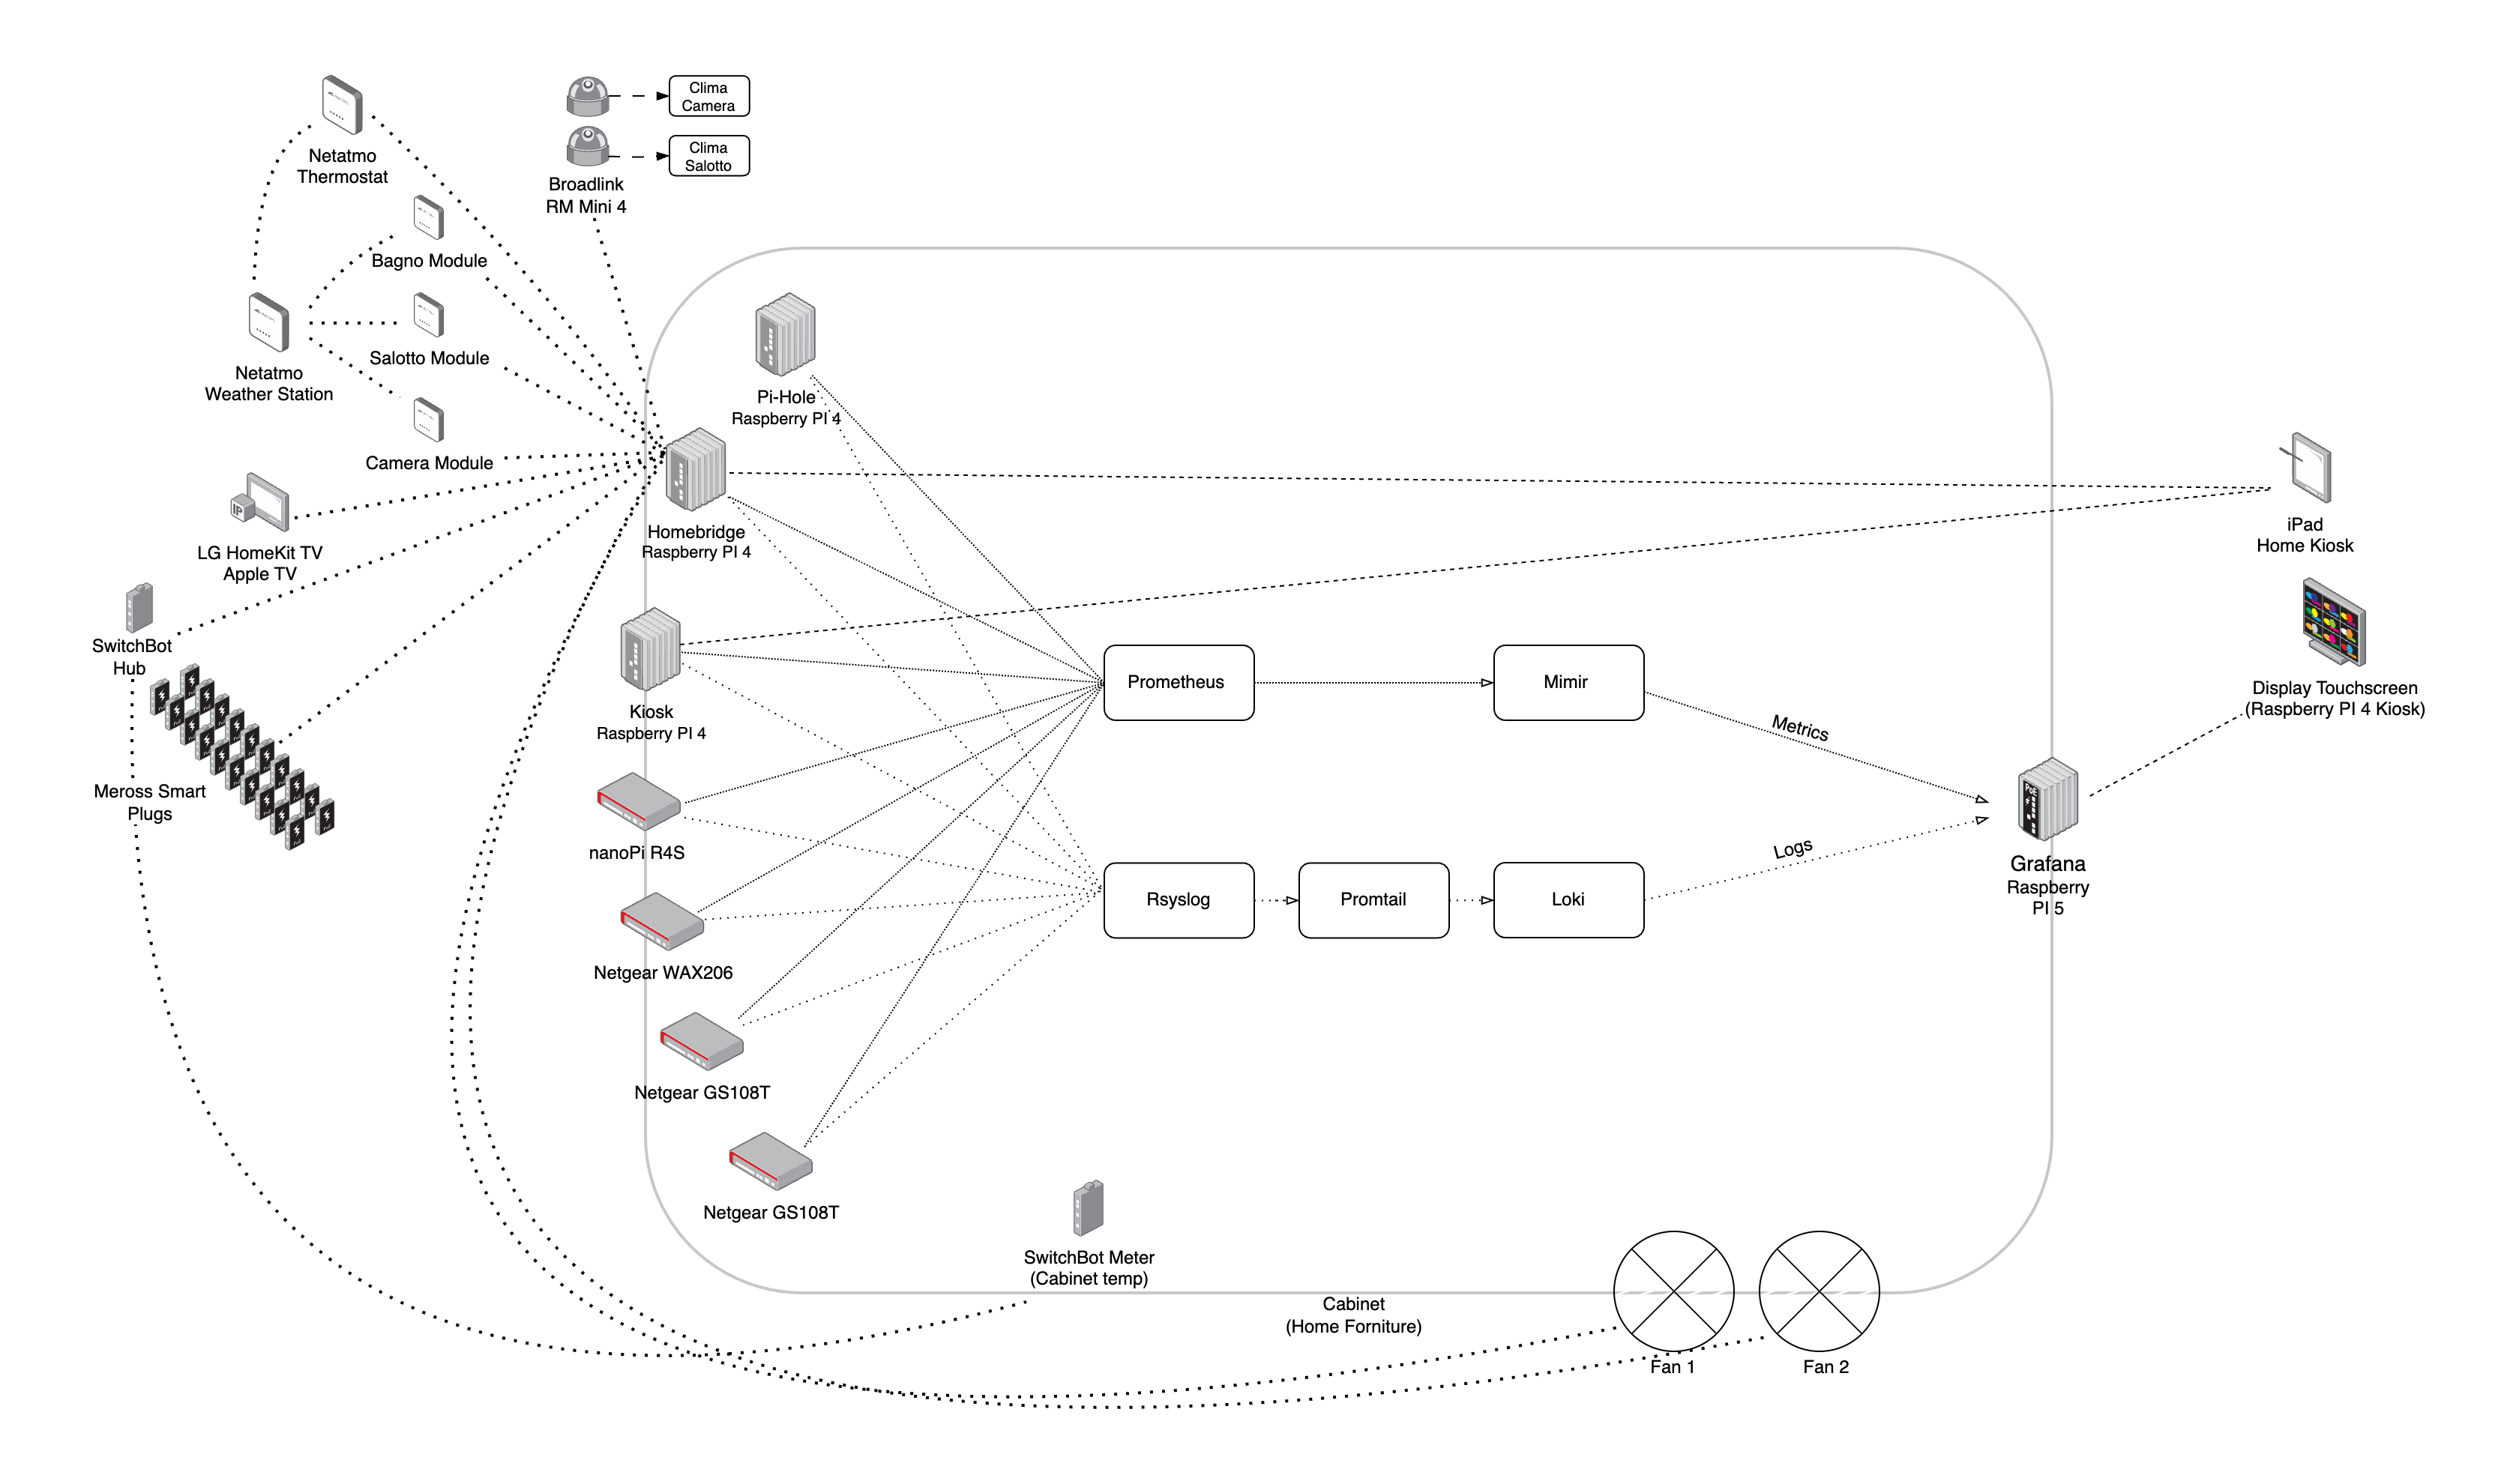
A semplified scheme of the newtwork:
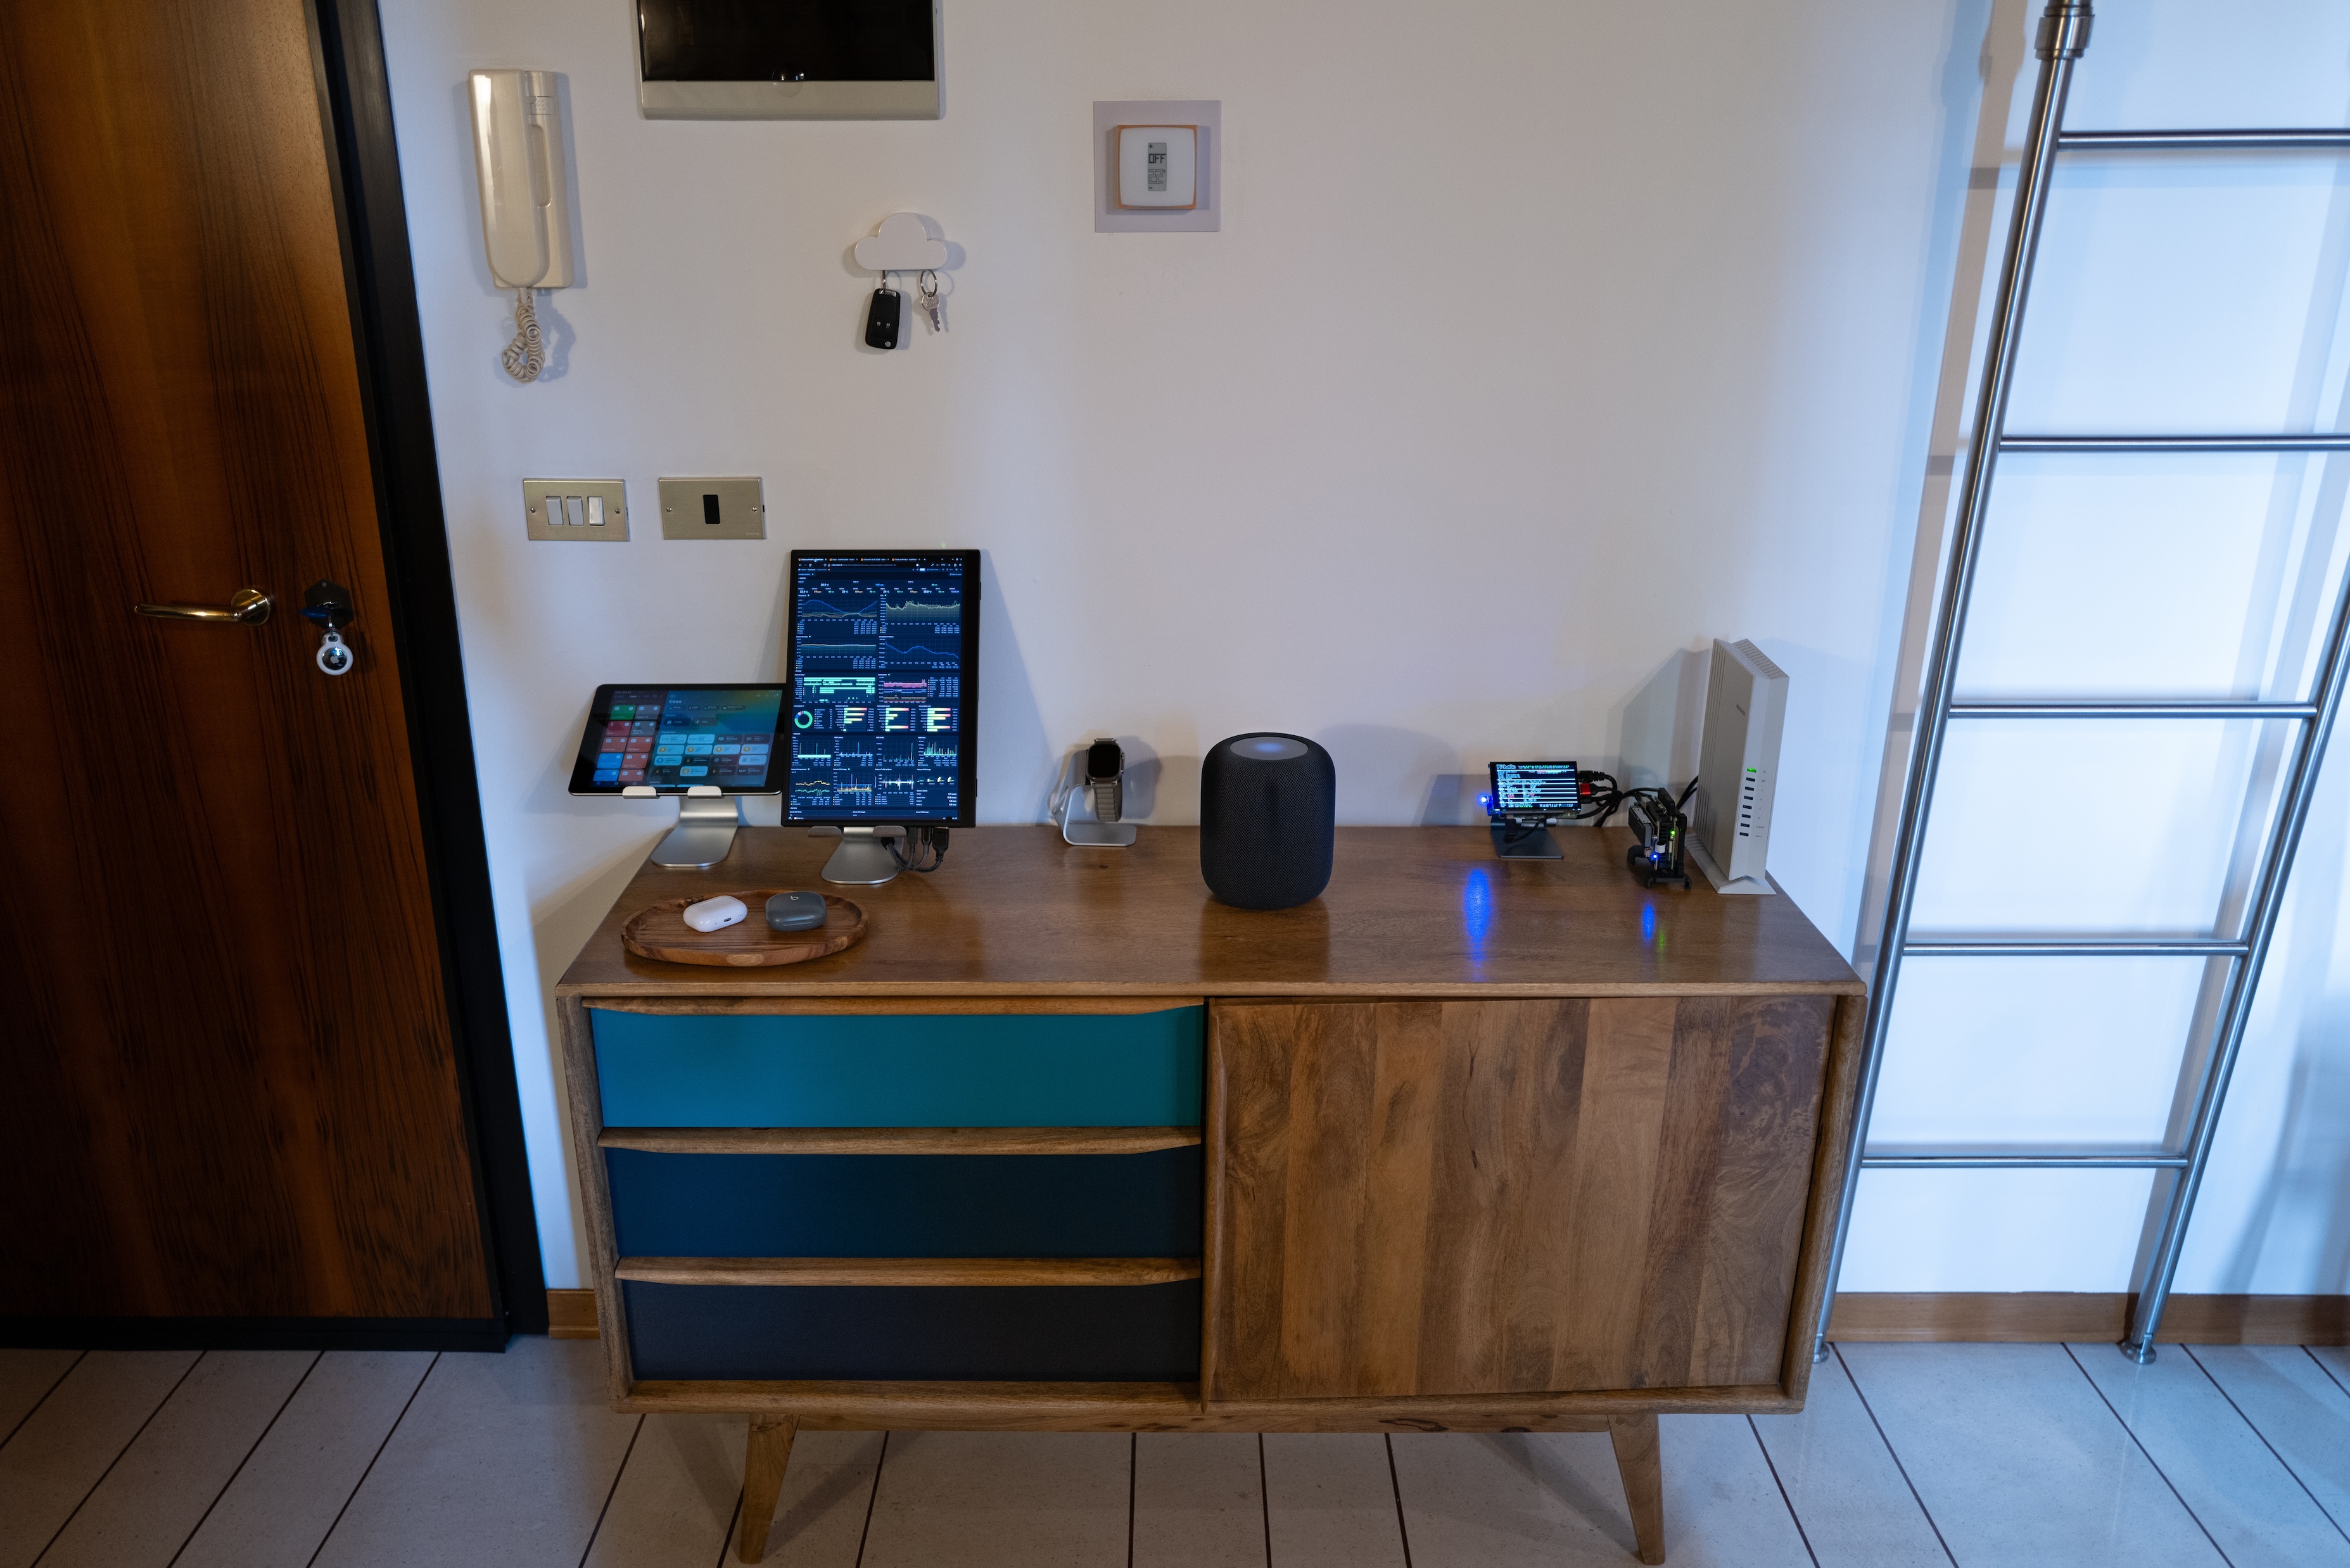
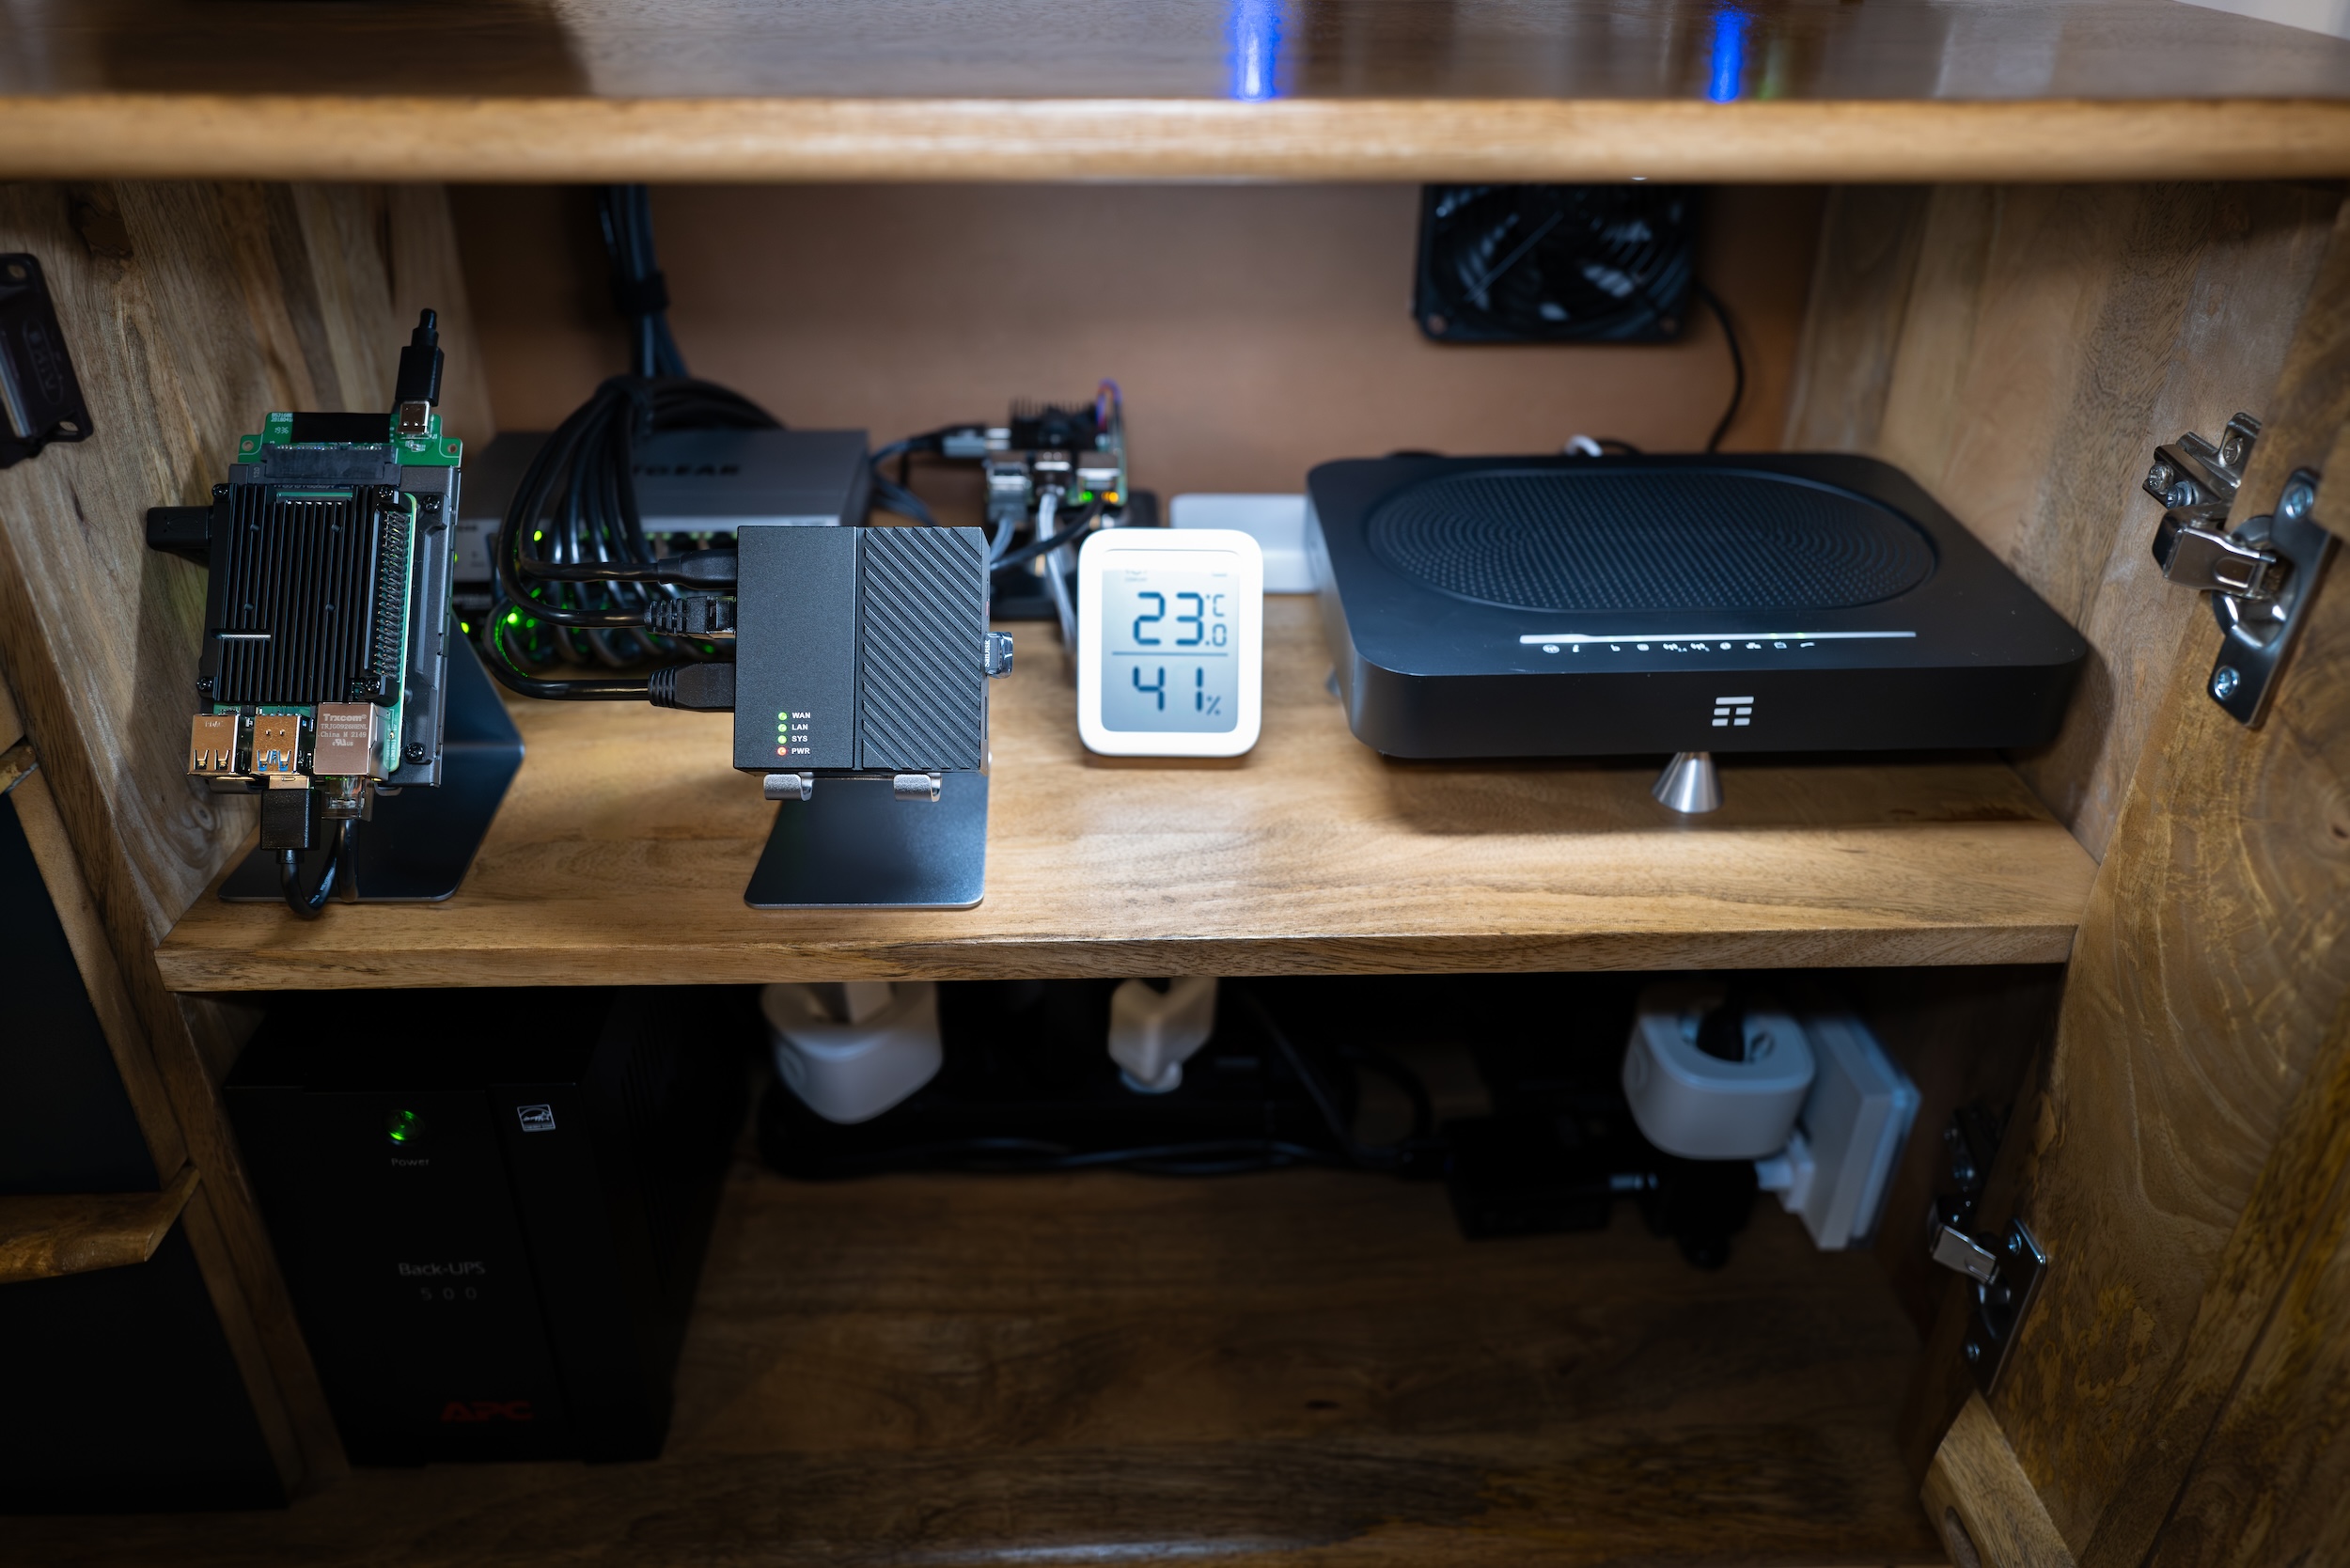
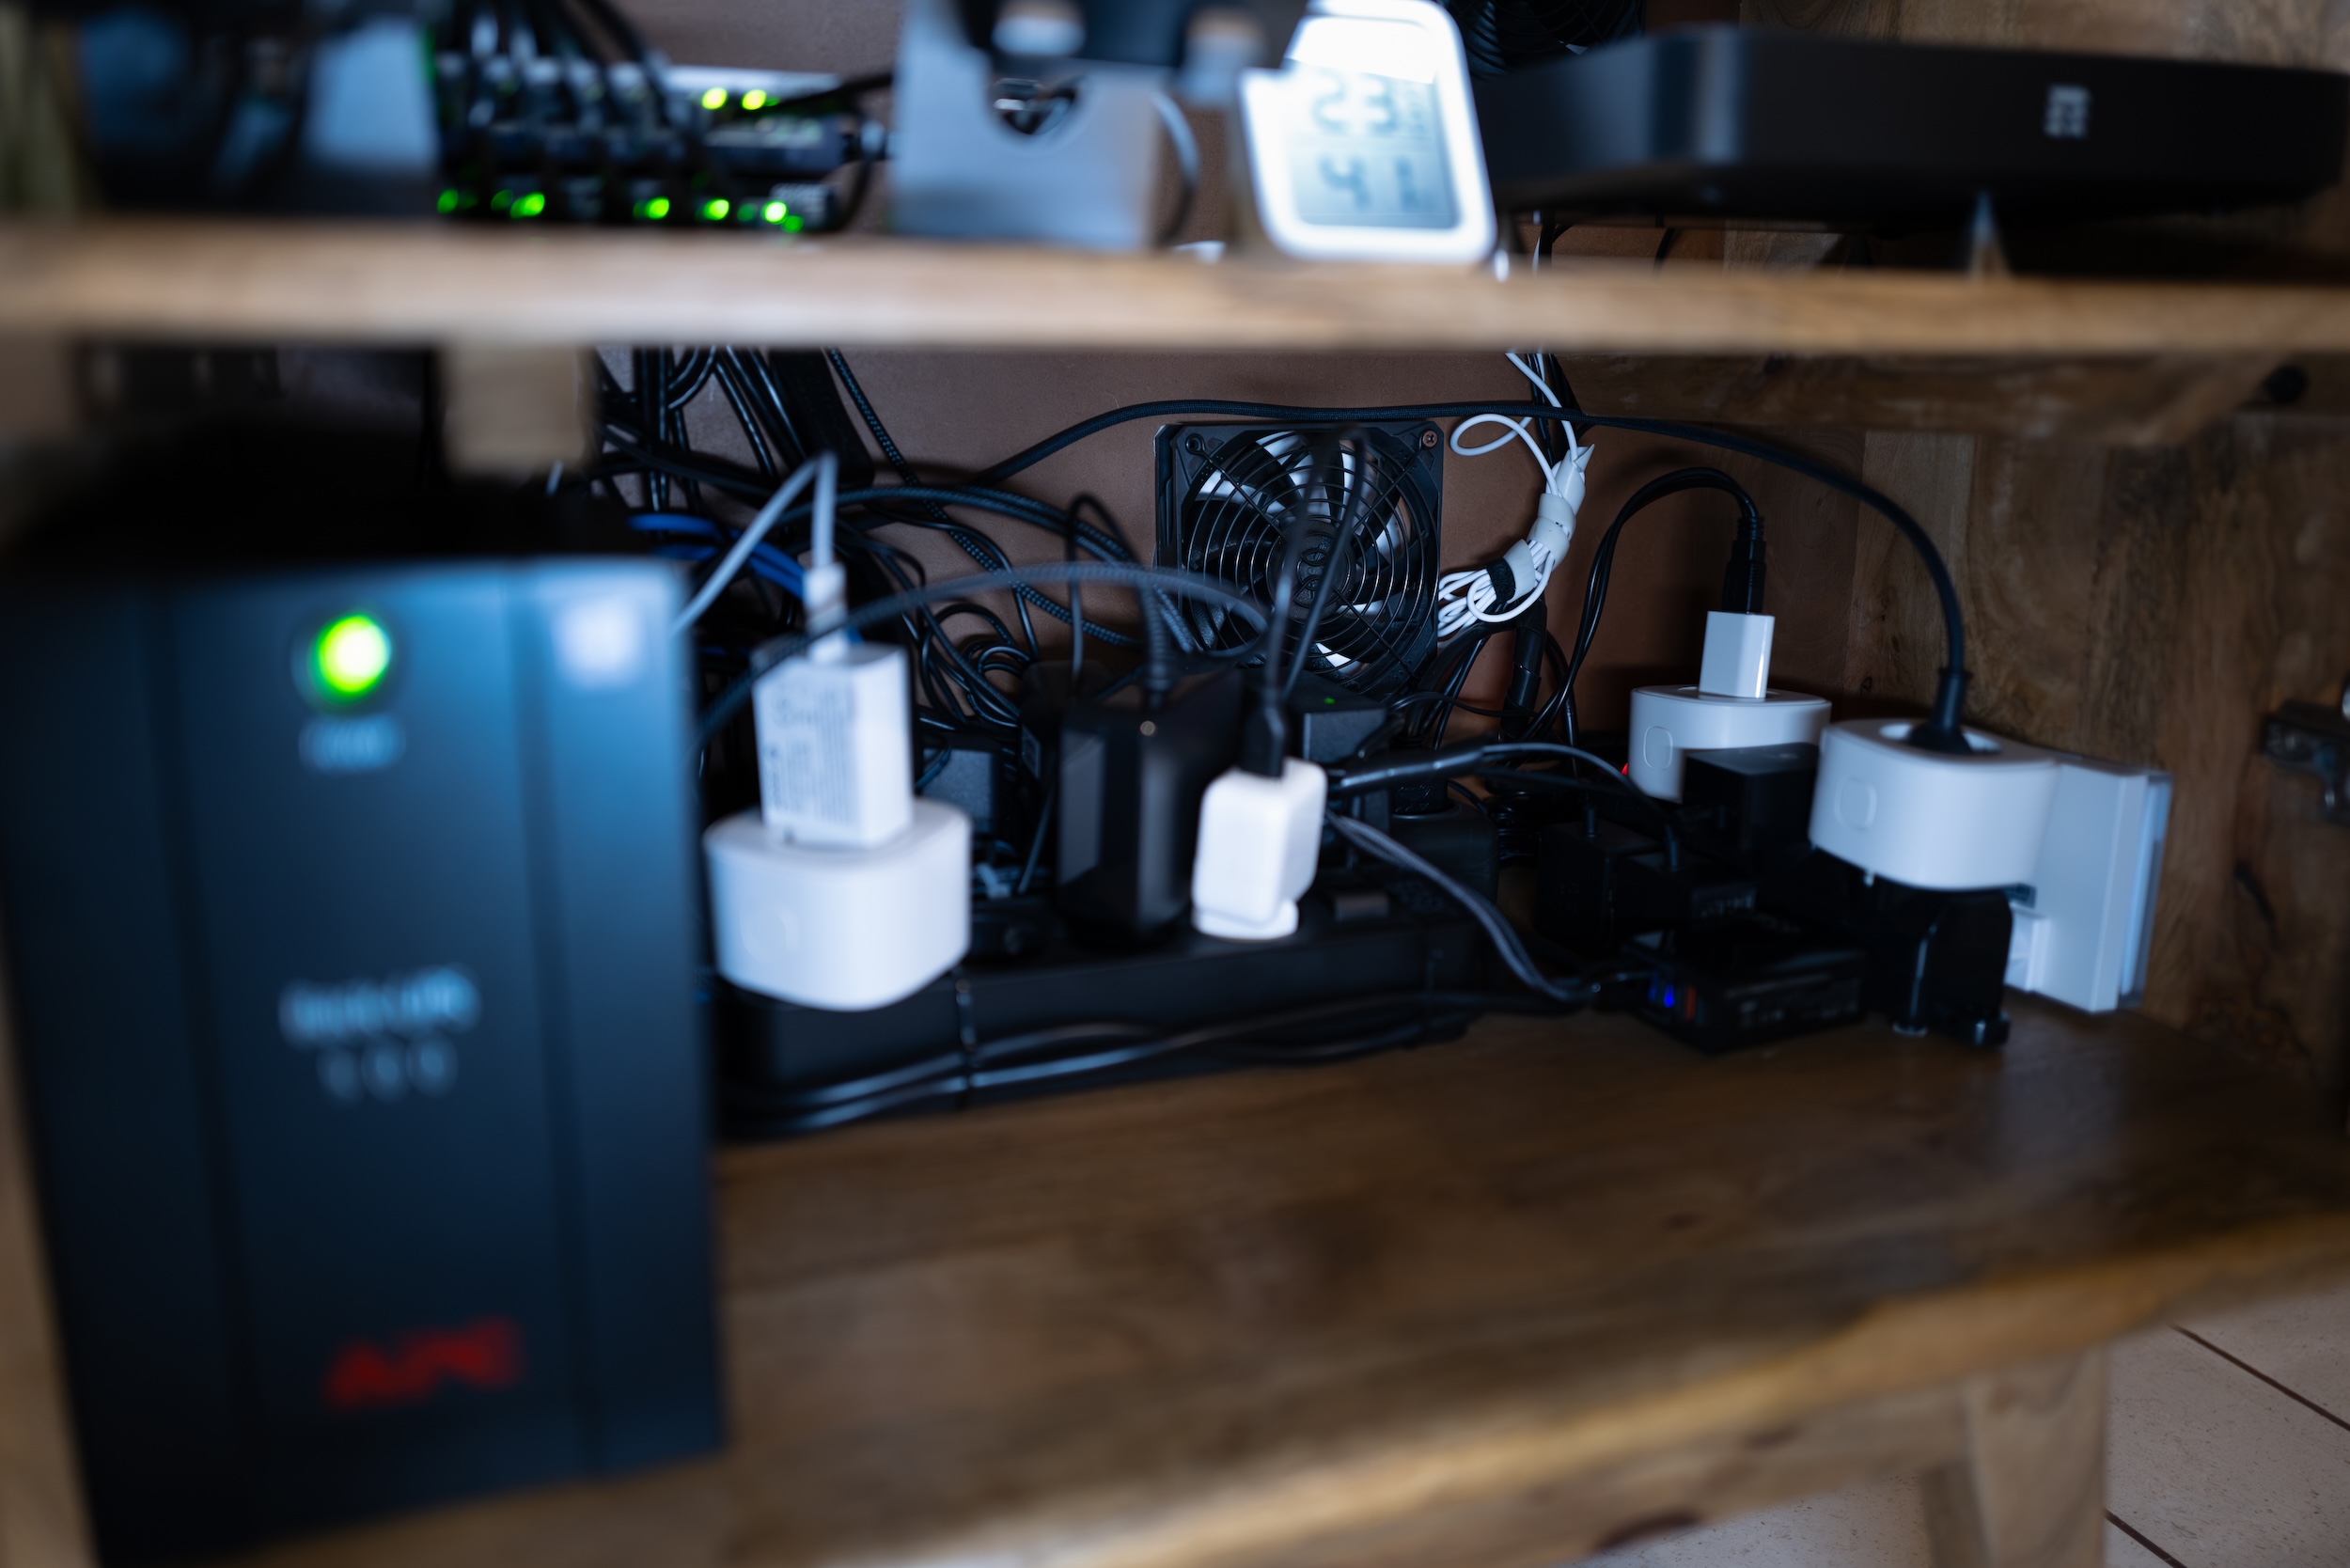
And here are some photos of the “rack/cabinet” —call it what you will, but it’s a piece of designer furniture with a few modifications (like the added fans):
Now, I’ll start sharing my suggestions and information.
Raspberry PI 5 as Grafana server
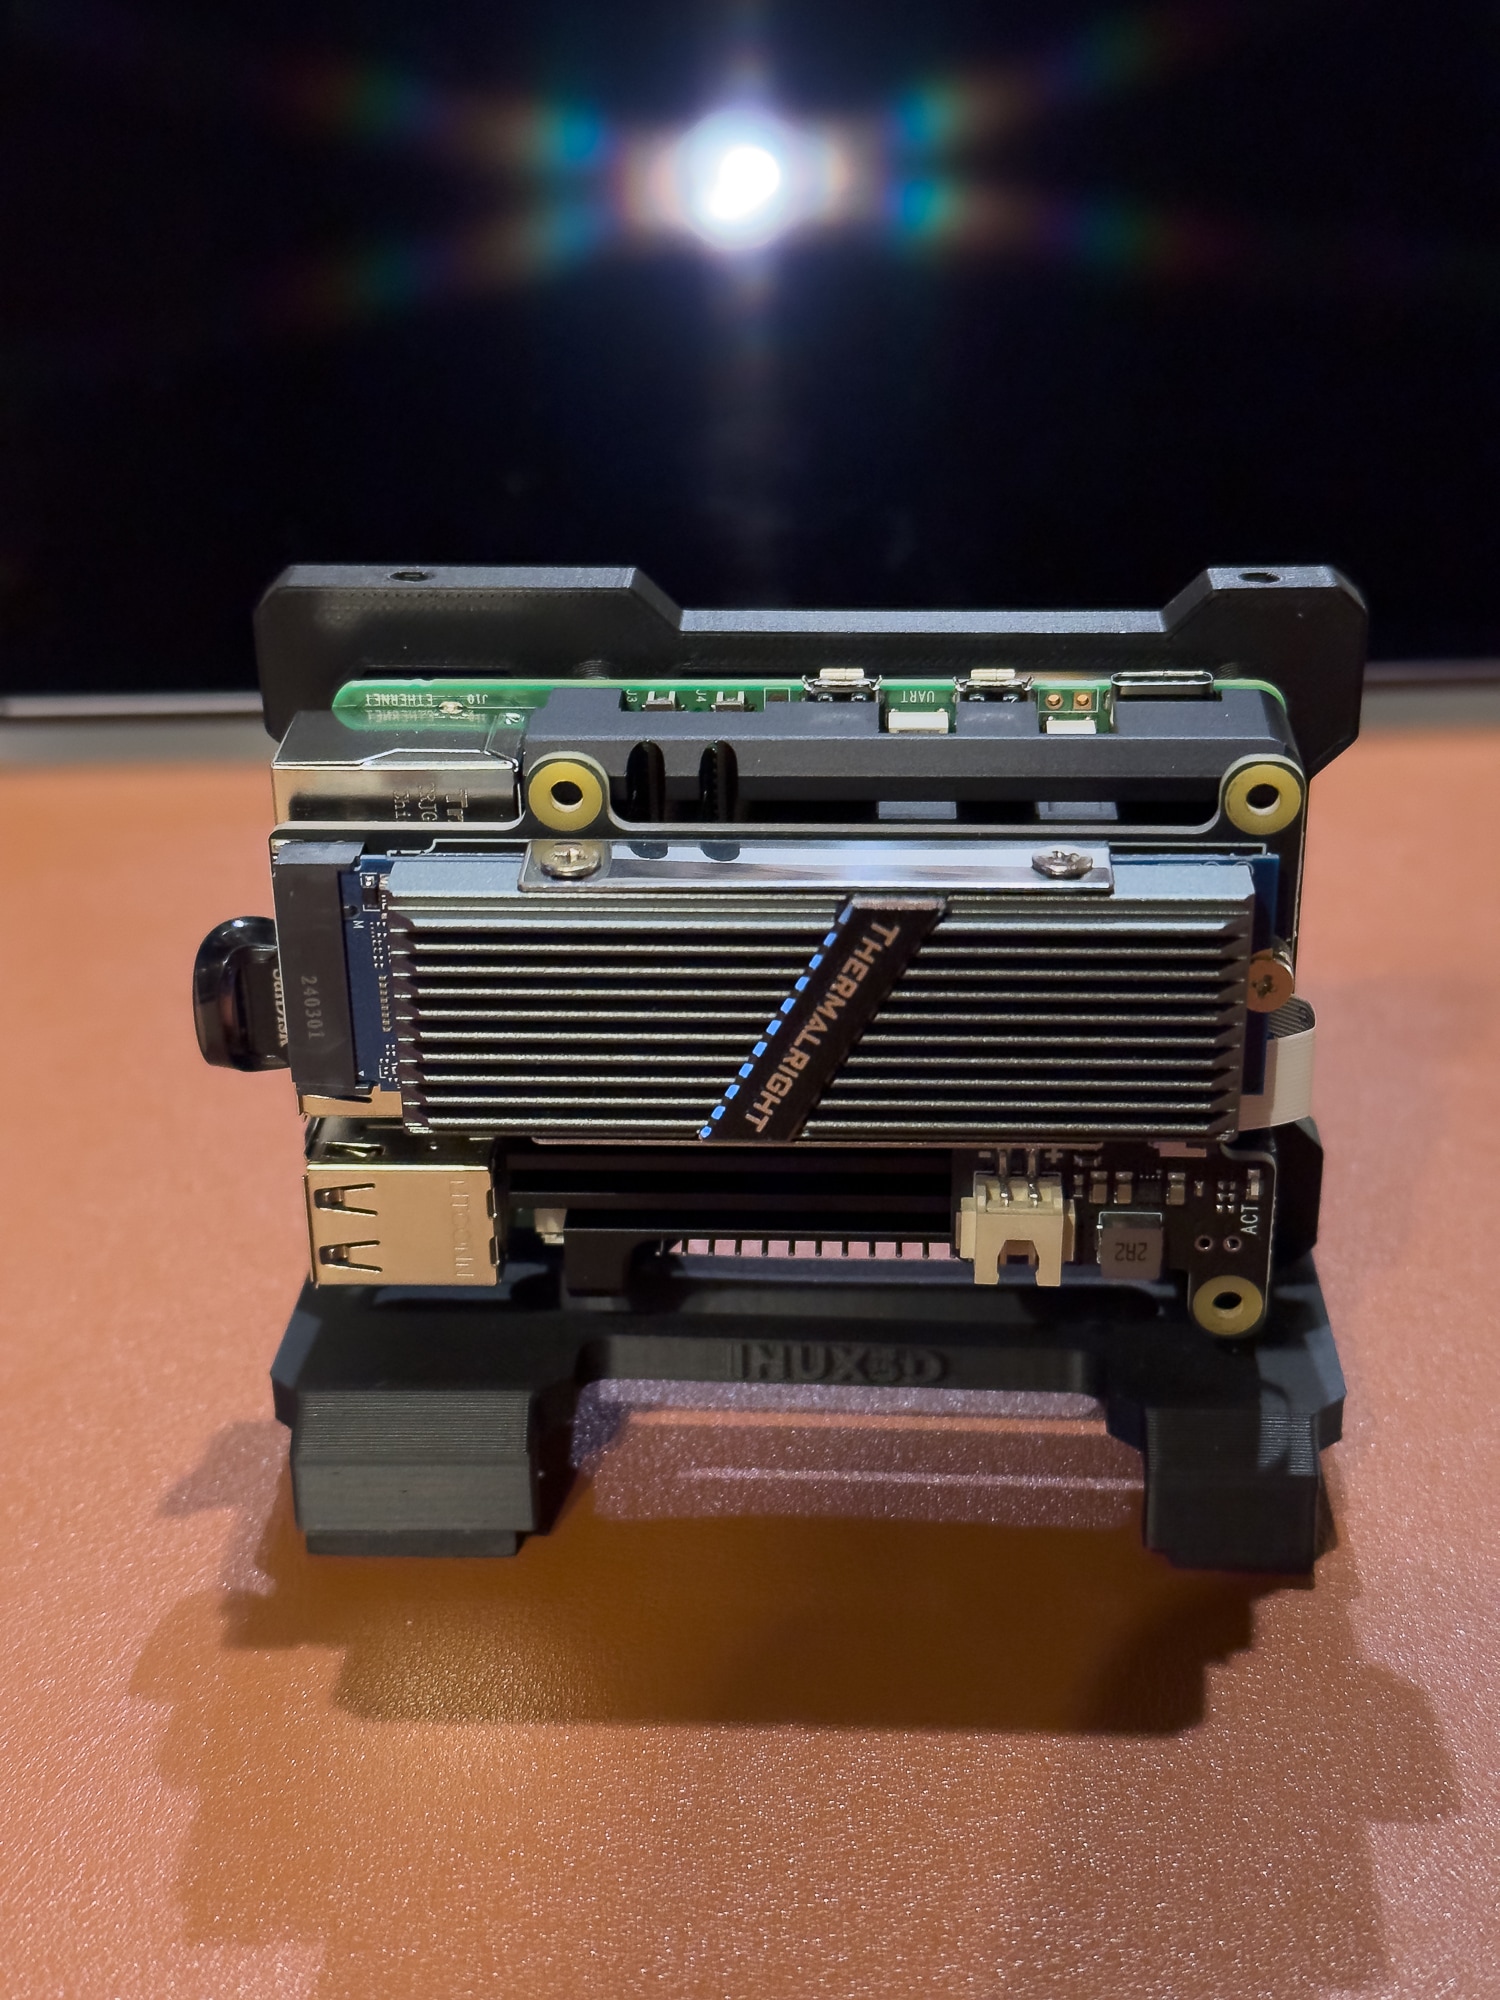 (Doesn’t it look like a photoshoot of a model? Eheh)
Hardware
Seeing that Raspberry Pi prices were gradually dropping, I seized the opportunity and bought a Raspberry Pi 5 with 8GB of RAM for about €80.
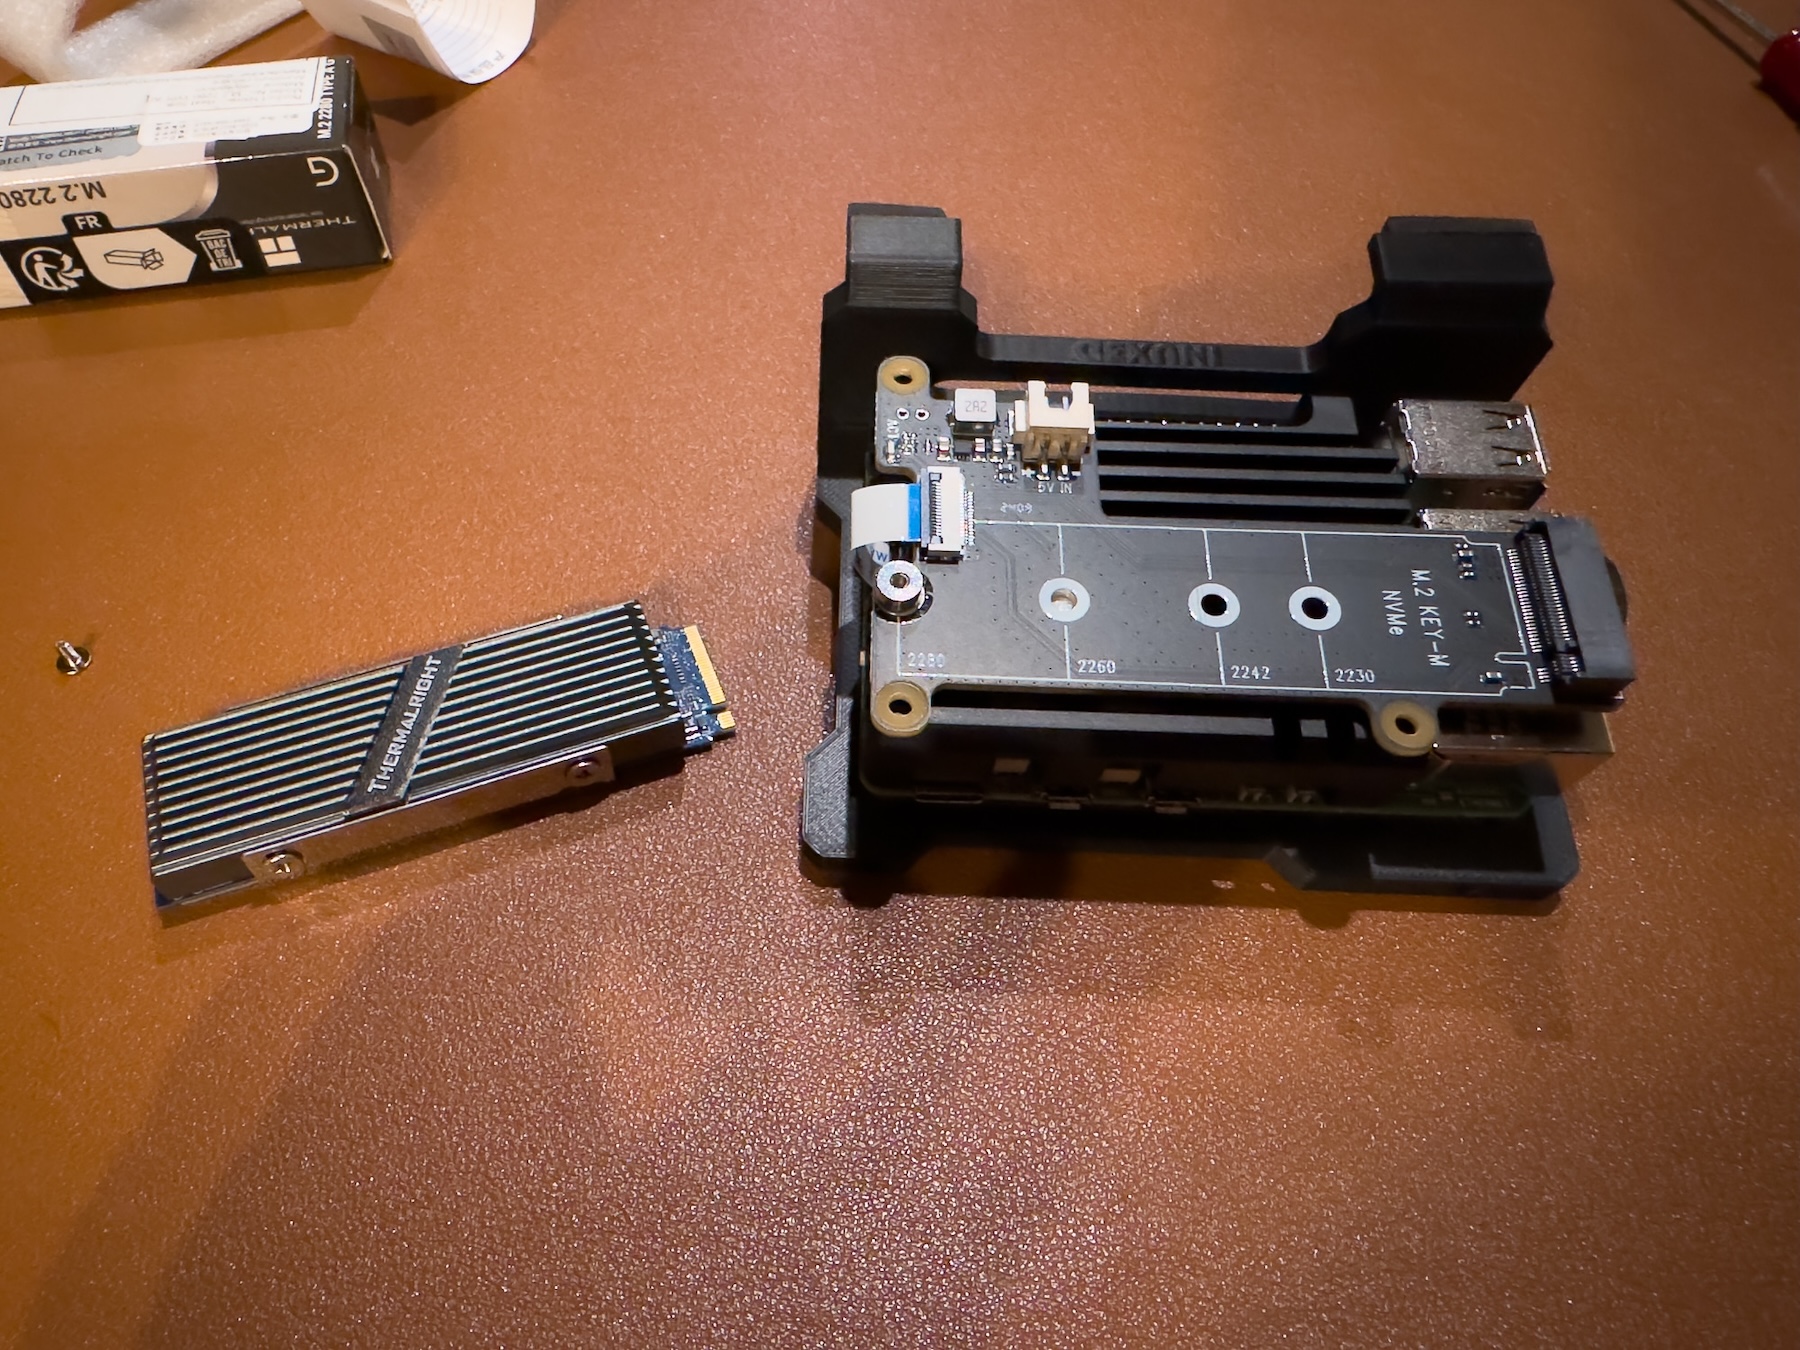
I also added an NVMe hat to it, because the Raspberry Pi 5 now supports PCIe 2x (and 3x unofficially). Using it for the storage of metrics, logs, and databases can make a difference in terms of performance and reliability.
I chose the Geekworm X1001 because it costs €15 and leaves “half” of the top of the Raspberry Pi exposed.
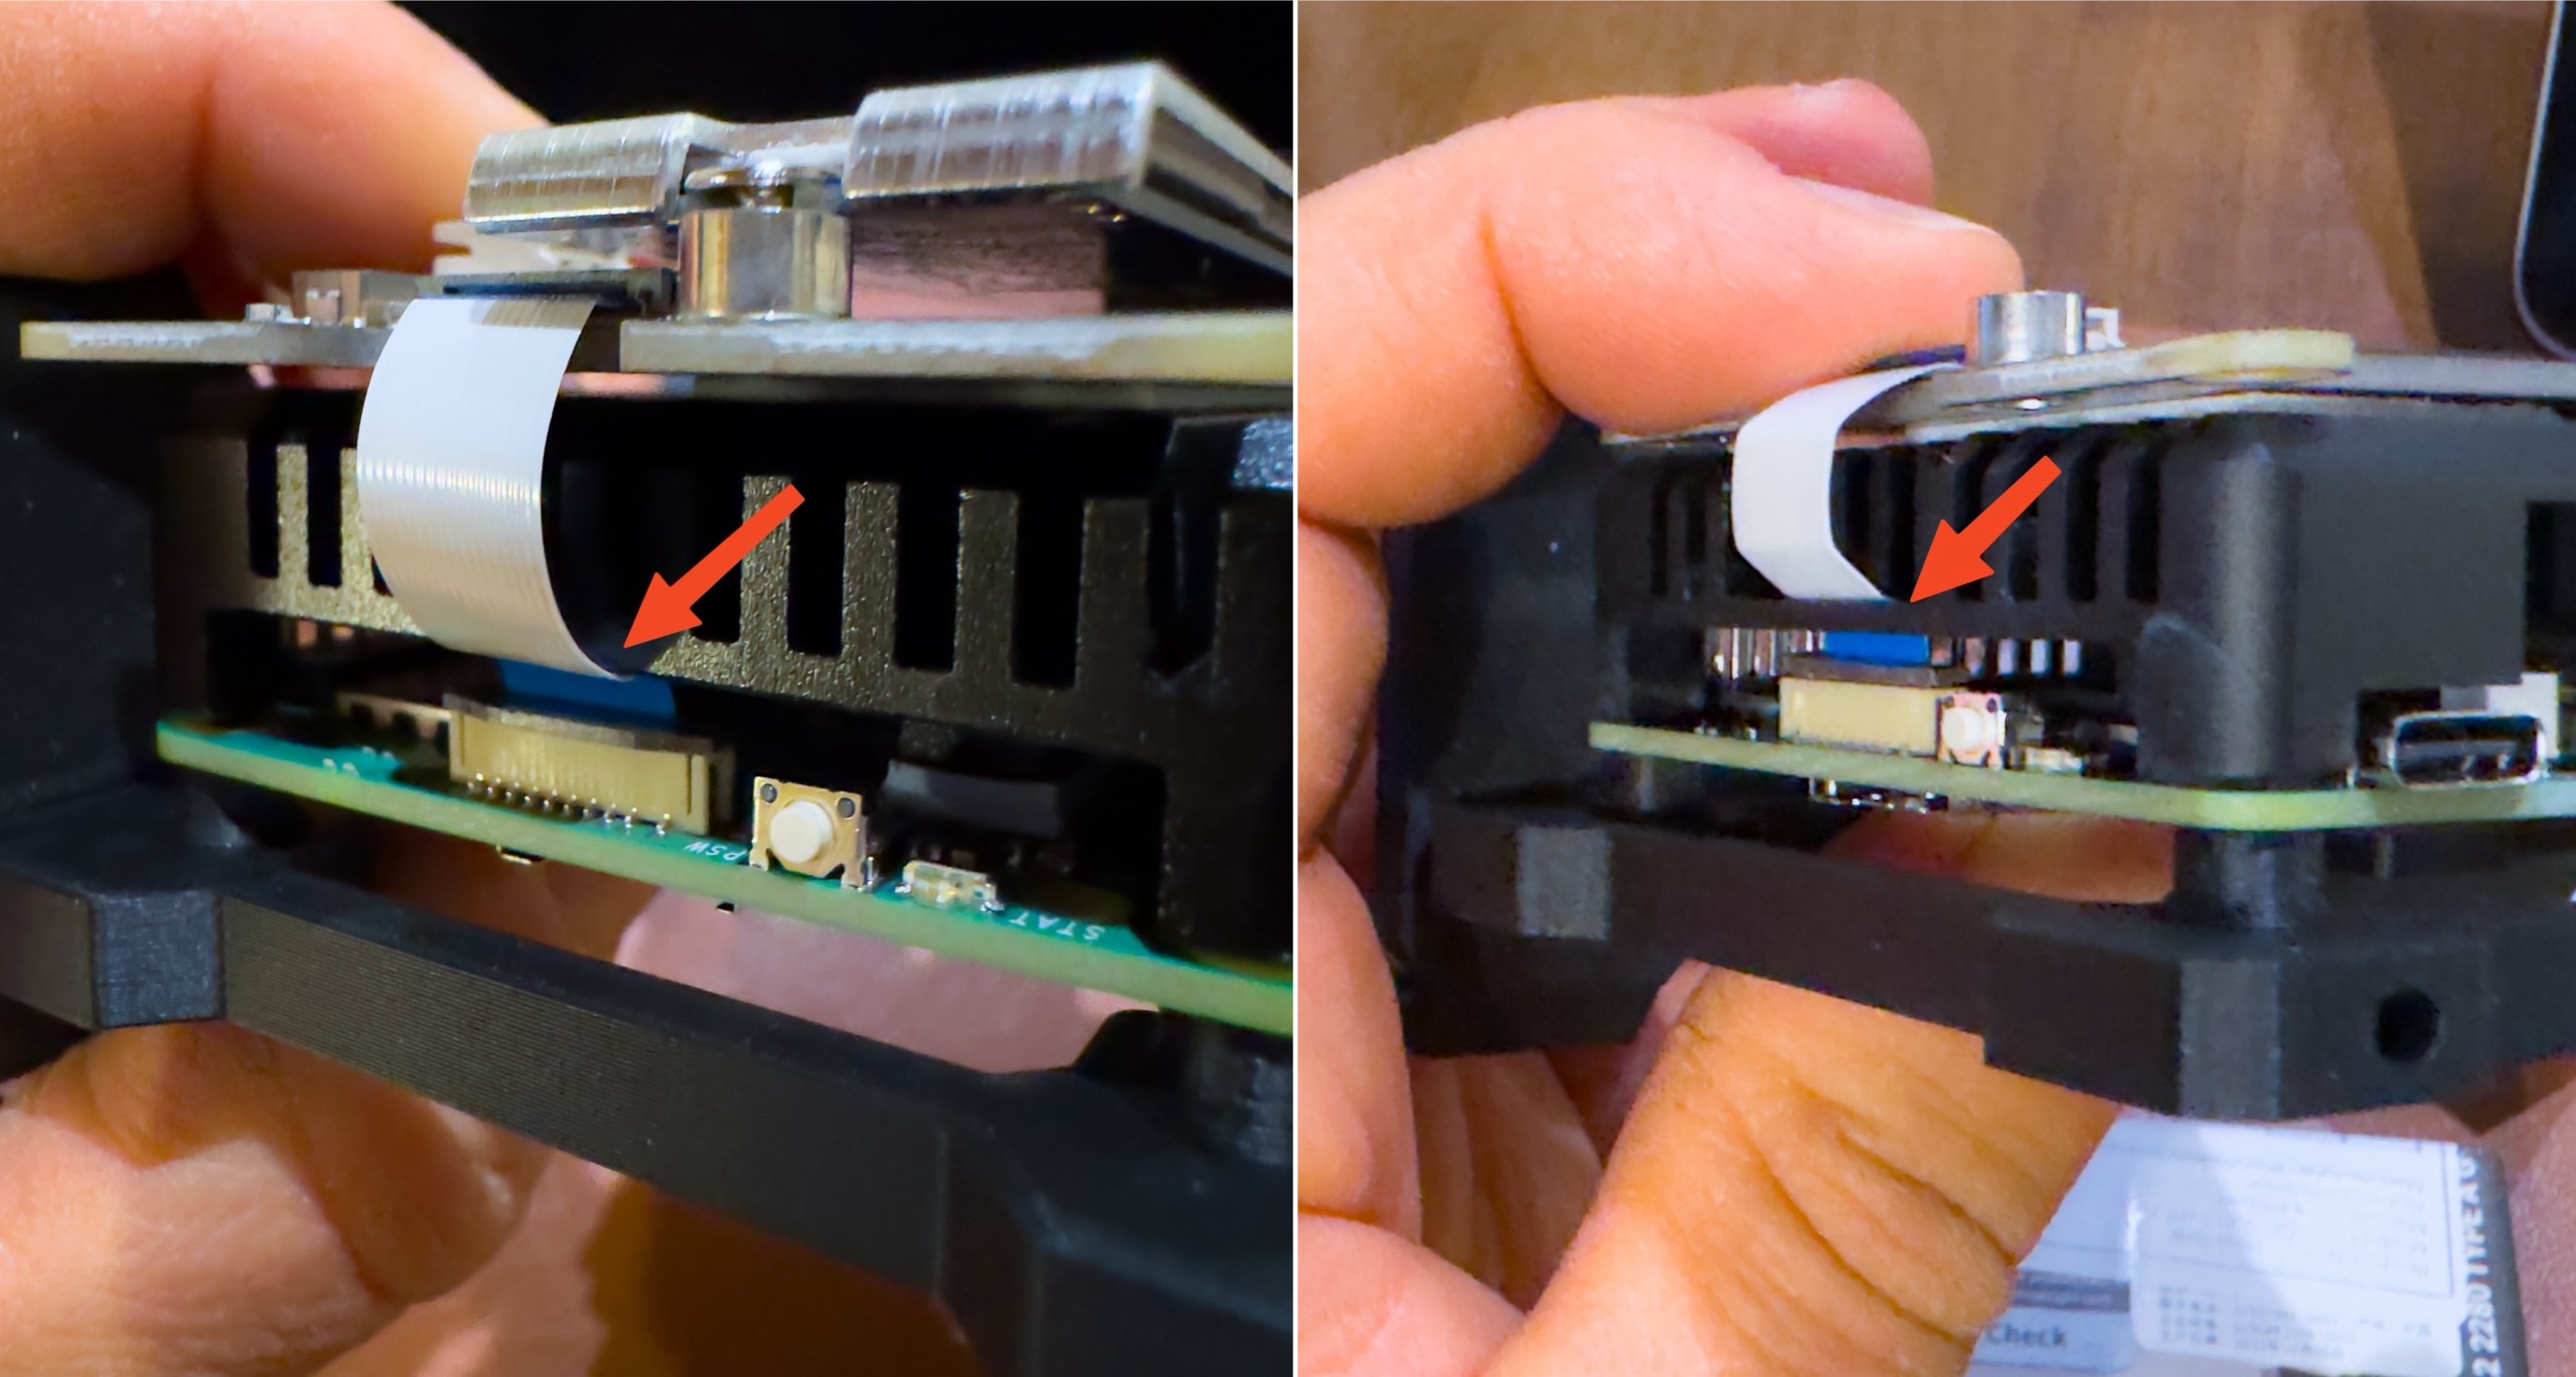
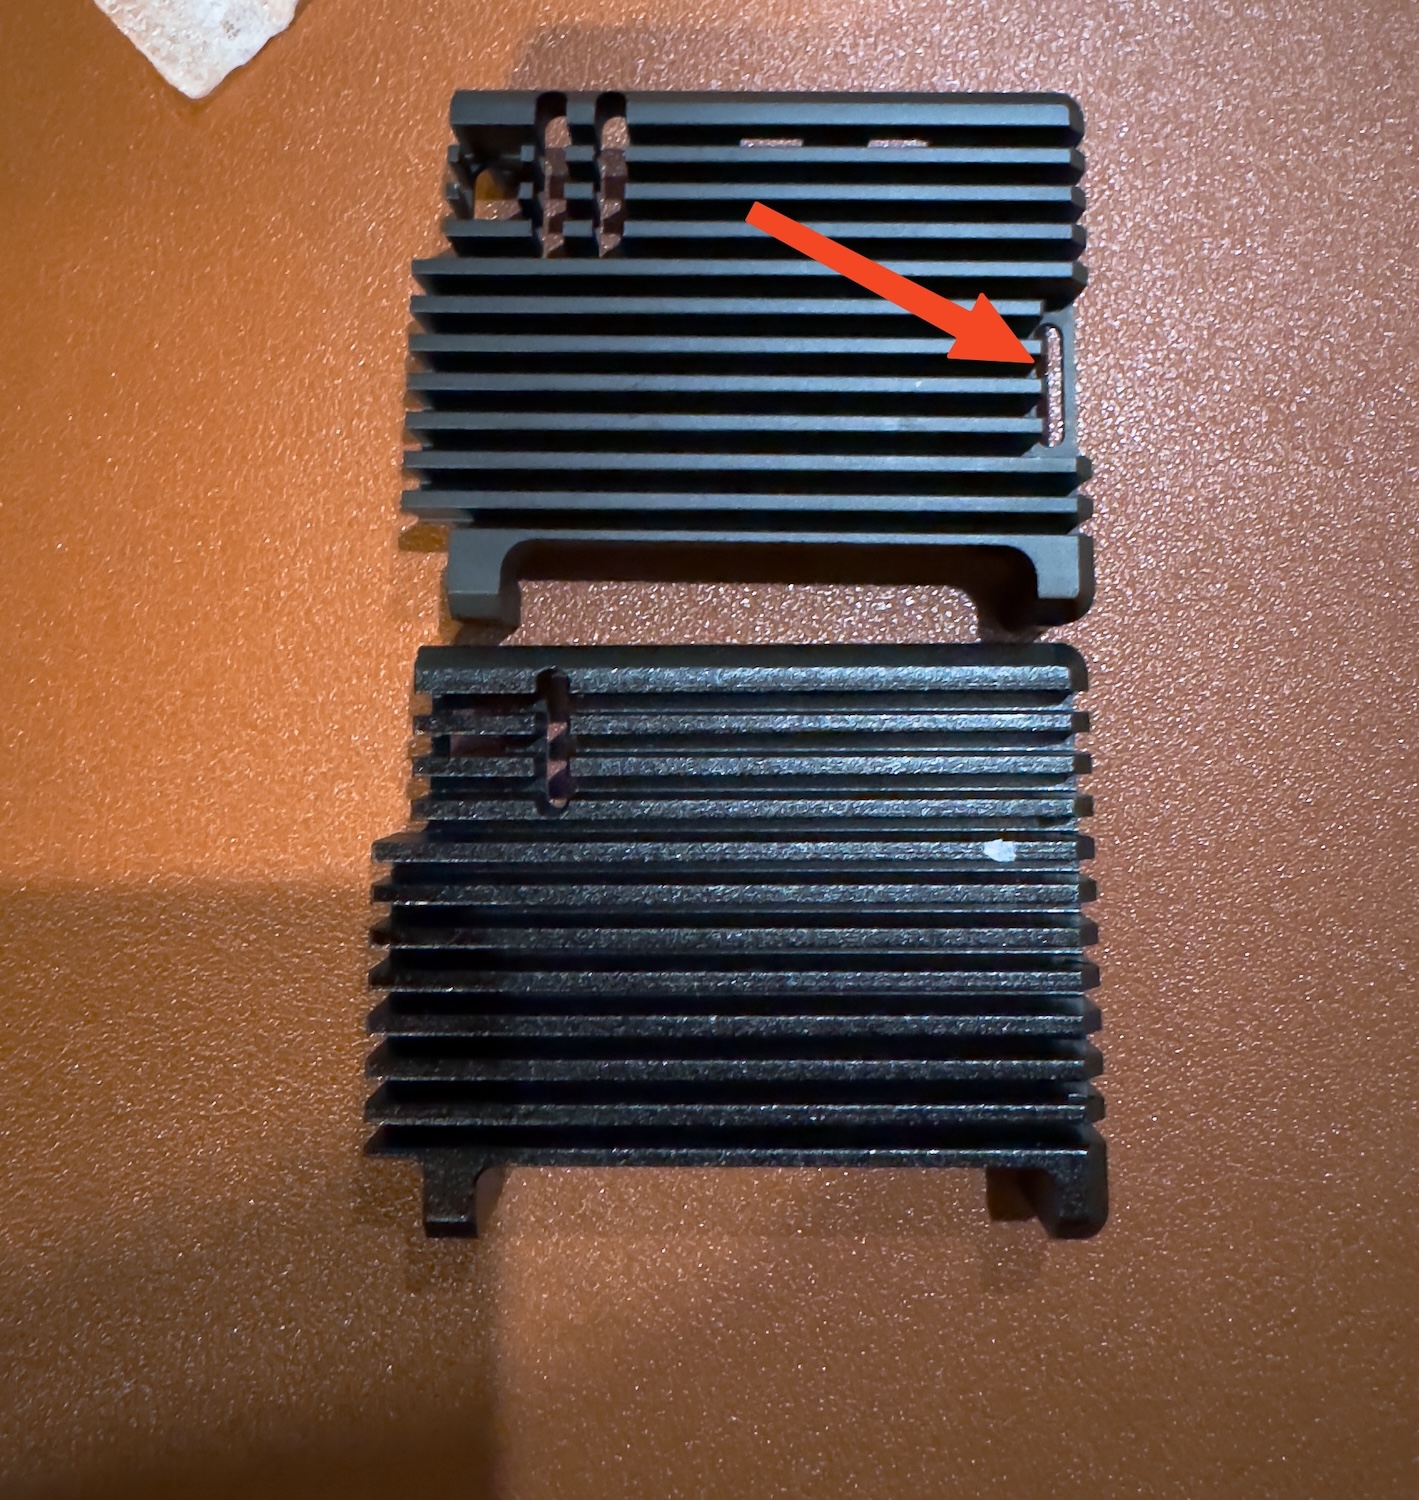
For heat dissipation, I chose the Geekworm P-122C, which costs €13. However, when selecting the heat dissipator, be sure to choose one with a hole/cut for the PCIe cable (FFC 16-pin cable). Unlike my first attempt, where I bought a heat dissipator without this hole and I was forcing the cable into a dangerous bend.
The important hole:
The Geekworm case/dissipator is also quite cool because it includes a copper shim and thermal paste for the CPU. Cool features for a reasonably priced enclosure/heat dissipator.
Lastly (although unnecessary) I also bought a nice and cheap NVMe dissipator because I didn’t like seeing the bare drive. This dissipator, the Thermalright TR-M.2, was only €6.
Here are a pic of the assembly:
Booting and using the Raspberry PI 5 from the NVMe drive
Before installing the SSD, I flashed DietPI onto it to boot straight from the SSD without using a microSD card. I followed Jeff Geerling’s guide: Testing PCIe on the Raspberry Pi 5.
But this was my first error because the Raspberry Pi wouldn’t boot from it, regardless of the boot drive settings in the config file.
To avoid this issue, I booted from the microSD and then copied the microSD to the NVMe drive using Jeff’s rpi-clone tool. But after copying the microSD to the NVMe drive, it would boot: the OS always froze during apt upgrade at Unpacking rpi-eeprom (23.0-1) over (23.0-1) .... See this post I wrote on the DietPI forum.
The solution was to boot from the microSD, perform all the upgrades while still running from the microSD, and then use rpi-clone to clone the microSD to the NVMe drive. This worked, and I was finally able to use/boot the Raspberry Pi 5 without the microSD.
Regarding the speed, it’s much faster obviously, while benchmarks aren’t everyting… here’s a benchmark (using pibenchmarks.com) :)
/dev/nvme0n1 vendor: Patriot model: M.2 P300 256GB size: 238.47 GiB temp: 28.9 C

Benchmark Results

Score: 50,539

DD Write: 577 MB/s
HDParm (Cache): 752.62 MB/s
FIO 4KRandW: 756.81 MB/s
FIO 4KRandR: 78,467 IOPS
FIO 4KRandW: 92,669 IOPS
FIO 4KRandR: 313,869 KB/s
FIO 4KRandR: 370,678 KB/s
IOZone 4KR: 20,788 KB/s
IOZone 4KW: 198,678 KB/s
IOZone 4KRandR: 59,728 KB/s
IOZone 4KRandW: 284,935 KB/s
Software
I made a clean installation of the OS without using a backup because the important files and directories could all be transferred from the old Raspberry Pi to the new one. Essentially, I only needed to copy the Prometheus and Grafana folders with configurations, alerts, and plugins. What I did was assign a new static IP address (192.168.1.66) to the RPi 5. Then I installed and copied the necessary files from the old RPi 4 (which had the IP address 192.168.1.6). After that, I powered off the old RPi 4 and reassigned its IP address to the new RPi 5.
And… boom, nothing: everything on my network was the same as before, with the same graphs and database on the same IP, only now hosted and delivered from the new RPi 5, and I didn’t have to update anything else inside the network.
…but, as with every change in an IT environment, not everything was fine.
All was working perfectly except for the grafana-image-renderer plugin. It simply wasn’t rendering the images, instead, it was giving me this error:
{"level":"error","message":"Request failed","stack":"Error: Failed to launch the browser process!\n/root/.cache/puppeteer/chrome/linux-116.0.5845.96/chrome-linux64/chrome: 3: Syntax error: \")\"
I tried to fix it for a week, as you can read in this post I wrote on the Grafana forum: [Error in launching grafana-image-renderer after switching from a Raspberry Pi 4 to 5 - Grafana Labs Community Forums](https://community.grafana.com/t/error-in-launching-grafana-image-renderer-after-switching-from-a-raspberry-pi-4-to-5/121714), only after lots of frustration, fortunately, I found the issue on my own.
As I suspected, and probably due to the new ARMv8 architecture of the Raspberry Pi 5, the puppeteer headless browser was installing the x86 binary instead of the ARM one. So when it was queried by the rendering plugin, it failed to launch the executable file because of the wrong architecture.
To avoid this issue I found a solution: manually replace the chrome binary with the correct (ARM) one.
First I installed Chromium via apt install chromium-browser, then I copied its executable file from /usr/bin/chromium-browser to where the wrong architecture binary was located: /root/.cache/puppeteer/chrome/linux-116.0.5845.96/chrome-linux64/, I renamed it as “chrome” and gave the 755 permissions. After this, the Grafana rendering plugin started working perfectly.
Mimir database
I’ve encountered this phrase many times in the Prometheus documentation:
Again, Prometheus’s local storage is not intended to be durable long-term storage.
But I always thought, “Nah, it’s just a general safety recommendation…” Until it happened: my Prometheus database became corrupted! Damn… I lost months and months of data, and I was very frustrated.
So I decided that this shouldn’t happen again and I found another useful phrase in the Prometheus/Grafana documentation:
Mimir is an open source, horizontally scalable, highly available, multi-tenant TSDB for long-term storage for Prometheus.
Nice, just when I needed it. I decided to install it, and although I thought it might be tricky, it was actually super simple.
I downloaded the latest release from GitHub, placed the unzipped folder in the same directory as the Prometheus folder, added a remote write option to the Prometheus config file pointing/writing to the Mimir database:
#mimir
remote_write:
  - url: http://localhost:9009/api/v1/push
After that, I edited the Mimir “demo.yml” configuration file to specify the locations of its folders and other components, for example:
blocks_storage:
  backend: filesystem
  bucket_store:
    sync_dir: /home/dietpi/mimir/tsdb-sync
  filesystem:
    dir: /home/dietpi/mimir/data/tsdb
  tsdb:
    dir: /home/dietpi/mimir/tsdb

compactor:
  data_dir: /home/dietpi/mimir/compactor
  sharding_ring:
    kvstore:
      store: memberlist

distributor:
  ring:
    instance_addr: 127.0.0.1
    kvstore:
      store: memberlist

ingester:
  ring:
    instance_addr: 127.0.0.1
    kvstore:
      store: memberlist
    replication_factor: 1

ruler_storage:
  backend: filesystem
  filesystem:
    dir: /home/dietpi/mimir/rules

server:
  http_listen_port: 9009
  log_level: error

store_gateway:
  sharding_ring:
And another indispensable step was to create a launch service for the OS, something like:
[Unit]
Description=mimir

[Service]
#WorkingDirectory=/home/dietpi/mimir
ExecStart=/home/dietpi/mimir/mimir-linux-arm64 --config.file=/home/dietpi/mimir/mimir.yaml
Restart=always
Type=simple
RestartSec=10
User=root

[Install]
WantedBy=default.target
Launched it and set it to start at boot:
sudo systemctl daemon-reload
sudo systemctl enable mimir.service
Now Mimir was already working perfectly. However, refer to the official documentation for more information and details: Get started with Grafana Mimir.
Tips for the switch to Mimir in Grafana
The work was not finished yet. Although Mimir was working and receiving data from Prometheus, Grafana was still relying on Prometheus as its primary source. Or rather, all of my dashboards and panels were still using Prometheus as the data source.
This is something to avoid because Prometheus should be configured to delete its database (the TSDB folders) after 2 weeks, or one month at most. But I needed to be able to view my dashboards over a longer timeframe than 2 or 4 weeks, ideally 6-7-8 months or more.
I should have switched all the data sources from Prometheus to Mimir on every panel or dashboard. But, to avoid wasting time on this, there’s an easier way to convert all the dashboards to use Mimir as a source in just a few clicks:
First, go to the Grafana sources panel and configure Mimir as the “default database”. Then, go to a dashboard that you want to switch to Mimir. Click on the share button, then the Export tab, and select “Export for sharing externally”. Next, go to the settings of the same dashboard and change the name to something like “My xyzdashboard - Prometheus”.
Now, create a new dashboard in Grafana using the “Import” option and select the .json file that you just exported. Grafana will automatically create the new/same dashboard using the Mimir database as the source for all the panels.
But here’s another tip: when importing or creating the new Mimir dashboard, Grafana will warning you that “You already have a dashboard with the same UID”. In this case, simply add a letter to the UID of your dashboard, specifically the letter “m” (for Mimir) at the end of the UID, and you’re done. Grafana will create the new dashboard, identical to the old one but with Mimir as the database.
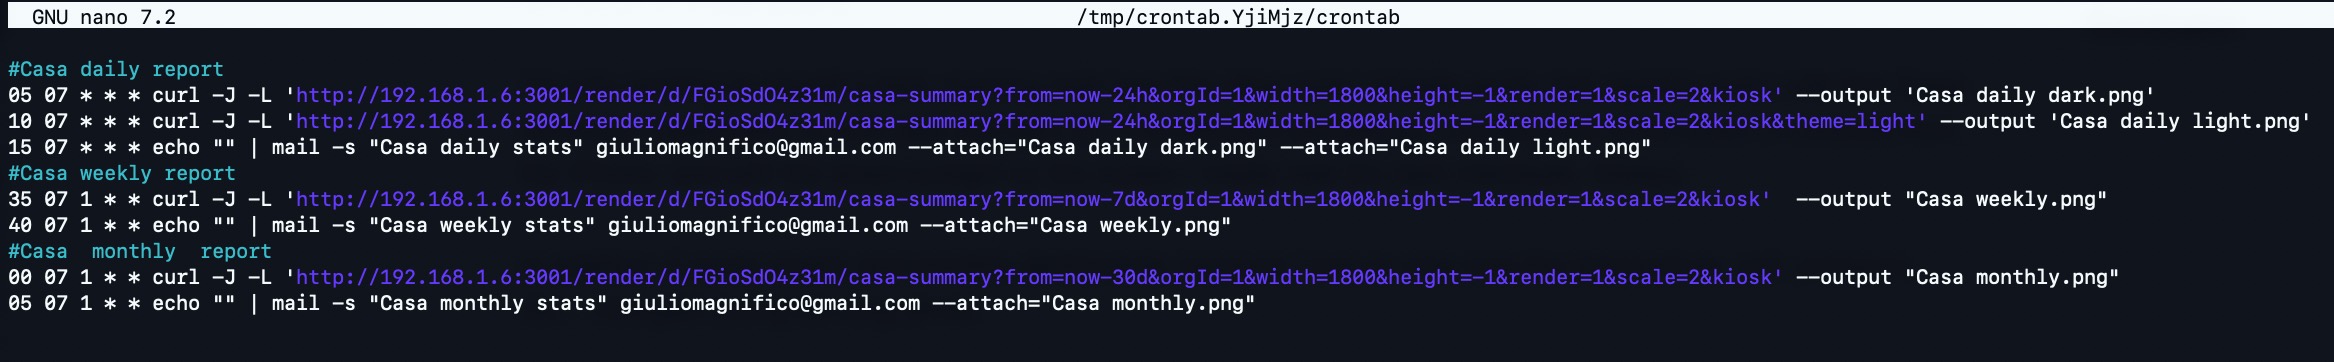
Why add only the letter “m” to the UID? Well, this will be very useful if you need to change an alert, a link, or anything else that requires the dashboard UID. For example, I use the URL to send myself daily/weekly/monthly dashboard images inside an email, using cron.
#Casa daily report
05 07 * * * curl -J -L 'http://192.168.1.6:3001/render/d/FGioSdO4z31m/casa-summary?from=now-24h&orgId=1&width=1800&height=-1&render=1&scale=2&kiosk' --output 'Casa daily dark.png'
10 07 * * * curl -J -L 'http://192.168.1.6:3001/render/d/FGioSdO4z31m/casa-summary?from=now-24h&orgId=1&width=1800&height=-1&render=1&scale=2&kiosk&theme=light' --output 'Casa daily light.png'
15 07 * * * echo "" | mail -s "Casa daily stats" giuliomagnifico@gmail.com --attach="Casa daily dark.png" --attach="Casa daily light.png"
#Casa weekly report
35 07 1 * * curl -J -L 'http://192.168.1.6:3001/render/d/FGioSdO4z31m/casa-summary?from=now-7d&orgId=1&width=1800&height=-1&render=1&scale=2&kiosk'  --output "Casa weekly.png"
40 07 1 * * echo "" | mail -s "Casa weekly stats" giuliomagnifico@gmail.com --attach="Casa weekly.png"
#Casa  monthly  report
00 07 1 * * curl -J -L 'http://192.168.1.6:3001/render/d/FGioSdO4z31m/casa-summary?from=now-30d&orgId=1&width=1800&height=-1&render=1&scale=2&kiosk' --output "Casa monthly.png"
05 07 1 * * echo "" | mail -s "Casa monthly stats" giuliomagnifico@gmail.com --attach="Casa monthly.png"
With the trick, I only had to add the letter “m” at the end of the UID to replicate everything that involves the UID (and there are lots of things that use it, also the alerts for example).
Kiosk 14in touch monitor
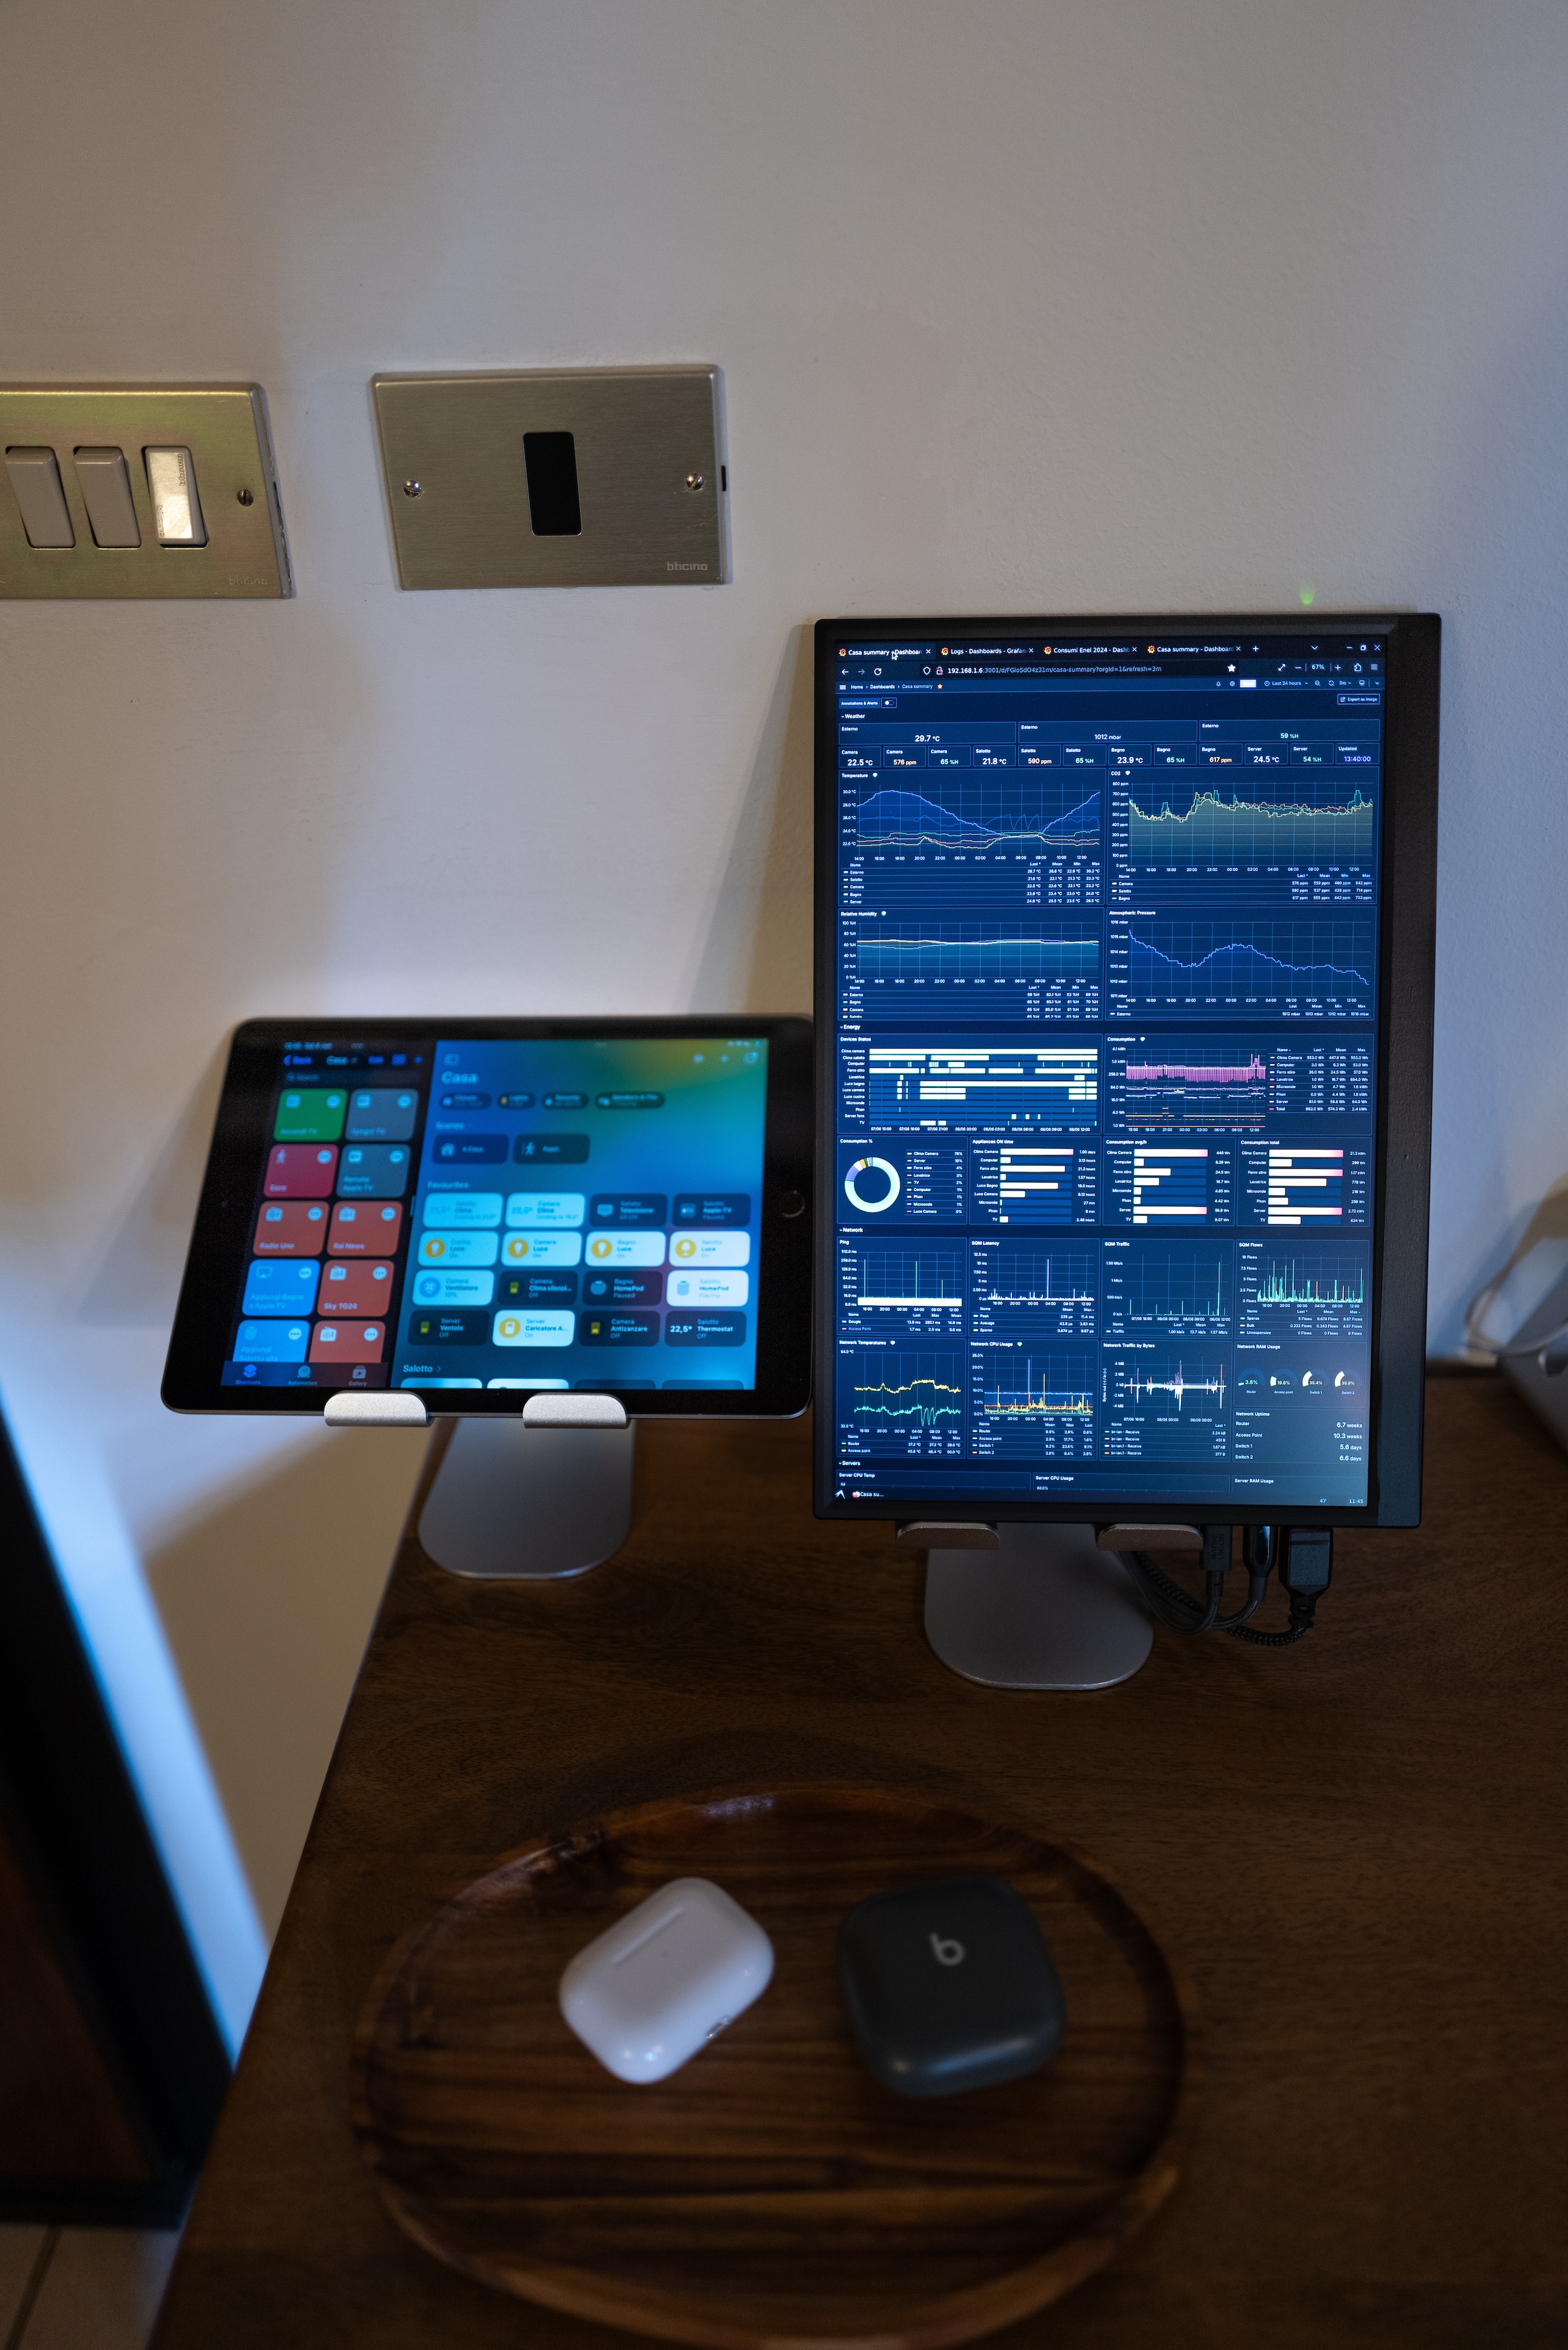
I decided to repurpose the old Grafana/Prometheus server (a Raspberry Pi 4 with 4GB of RAM and a USB3 SSD) as a kiosk device to provide an overview of all the dashboards in a central point of the house.
To accomplish this, I used (as usual) DietPi with a minimal desktop environment consisting of LXDE, Firefox, and VNC, plus, of course, an external monitor.
On the first try, I bought a 15.6” non-touchscreen monitor from Amazon. However, I then realized that I didn’t have a keyboard or mouse at home, and I didn’t want to buy them and connect them to the RPi just to use it. Nor did I want to be obligated to use another device, such as the MacBook or Mac Mini with VNC, just to switch tabs in Firefox or scroll down a dashboard.
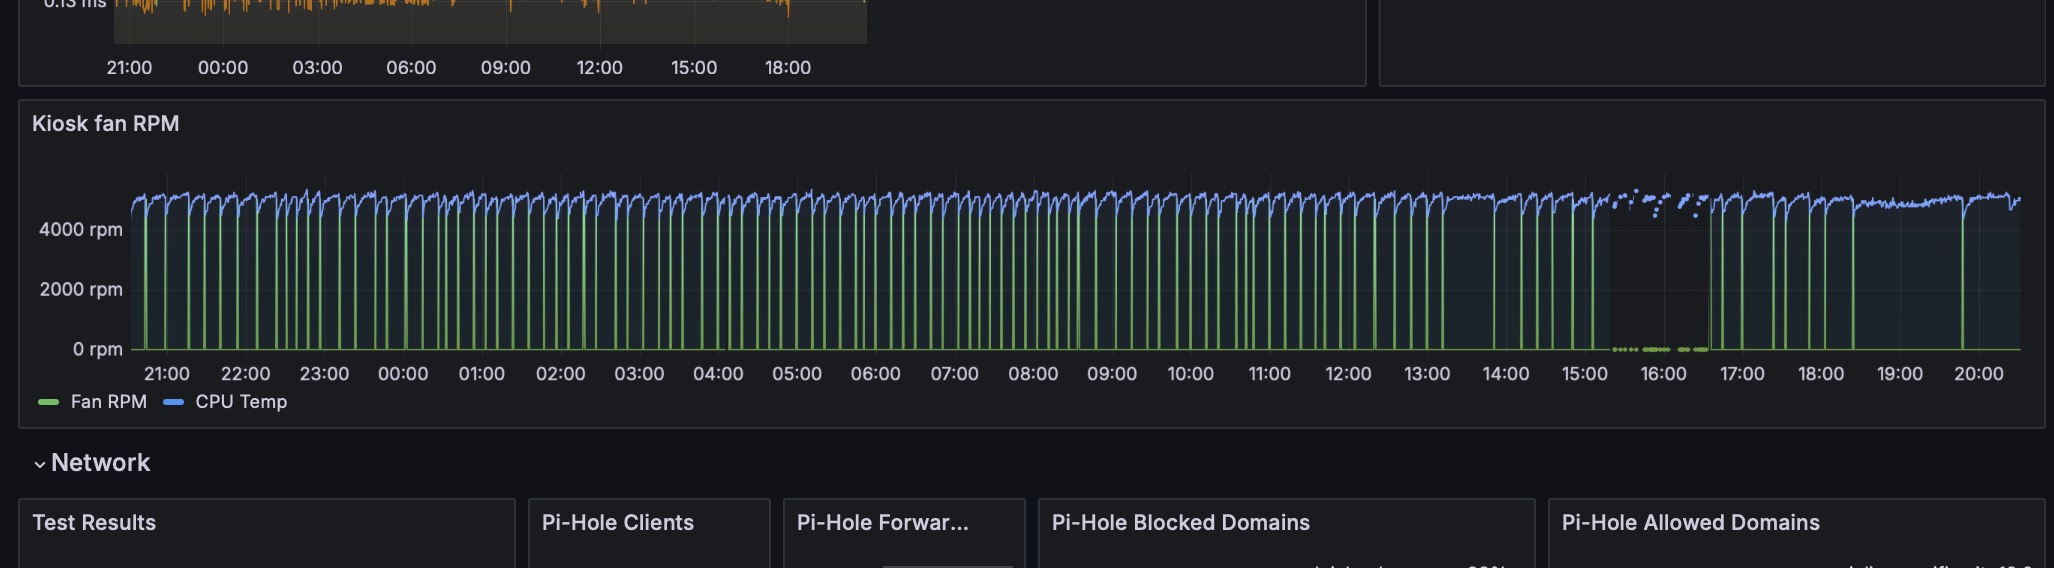
Tip: In this setup, the Raspberry Pi tends to heat up quite a bit, so I had to buy a budget-friendly heatsink with a PWM fan. I chose this one from GeekPi for €11. However, since DietPi doesn’t include a utility to control the fan through ‘raspi-config’, you’ll need to manually set the threshold temperature by editing the ‘/boot/config.txt’ file and adding the following lines:
# turn on the fan at 55C
dtoverlay=gpio-fan,gpiopin=14,temp=55000
Tip-2: You may need to change the gpiopin value to 18 or another pin, depending on your fan’s wiring, make sure to check your fan’s documentation for the correct GPIO pin. Once configured, it will keep the temperature between 52/53°C and 56/57°C. Here is an overview of how the fan works:
Speaking about the monitor: I found a touchscreen monitor on Amazon with a resolution of 1920x1080 pixels, sized 14 inches, for €110. Since the 15.6-inch monitor was too big, and the 14-inch one consistently cost about €100, I returned the 15.6-inch monitor to Amazon and kept the 14-inch touchscreen monitor.
Touchscreen configuration
With the touchscreen, enabling it was straightforward as it worked right from the boot. However, I faced challenges when attempting to use the monitor vertically. Although I managed to rotate the screen using the standard ‘/boot/config.txt’ file, the touchscreen remained inverted, as if the monitor were still in horizontal orientation.
After spending some time resolving this issue, I found a workaround that, while not optimal, works perfectly. Instead of instructing the hardware to invert the touch at boot, I achieved it by configuring the touch input in the OS graphics server (X.org) by adding these parameters to the file 99-rotate_screen.conf inside the folder /etc/X11/xorg.conf.d
Section "Monitor"
        Identifier "Monitor0"
        Option "Rotate" "right"
EndSection

Section "Screen"
        Identifier "Screen0"
        Device "Card0"
        Monitor "Monitor0"
EndSection

Section "InputClass"
            Identifier "Coordinate Transformation Matrix"
            MatchIsTouchscreen "on"
            MatchDevicePath "/dev/input/event*"
            MatchDriver "libinput"
            Option "CalibrationMatrix" "0 1 0 -1 0 1 0 0 1"
EndSection
This allows me, for example, to use the touchscreen to switch between tabs displaying different dashboards, or to scroll through a lengthy dashboard. The touchscreen works well, but it’s worth noting that the Grafana web interface can be quite resource-intensive during the initial load of a dashboard (not just reloading data of a current dashboard already loaded). I also tried using a Raspberry Pi Zero 2 as a kiosk device, but the experience was extremely poor. The Pi Zero 2 took 2 to 3 minutes just to open Firefox and load a dashboard. In contrast, using the Raspberry Pi 4B with an SSD significantly reduces the loading time to few seconds (10-15).
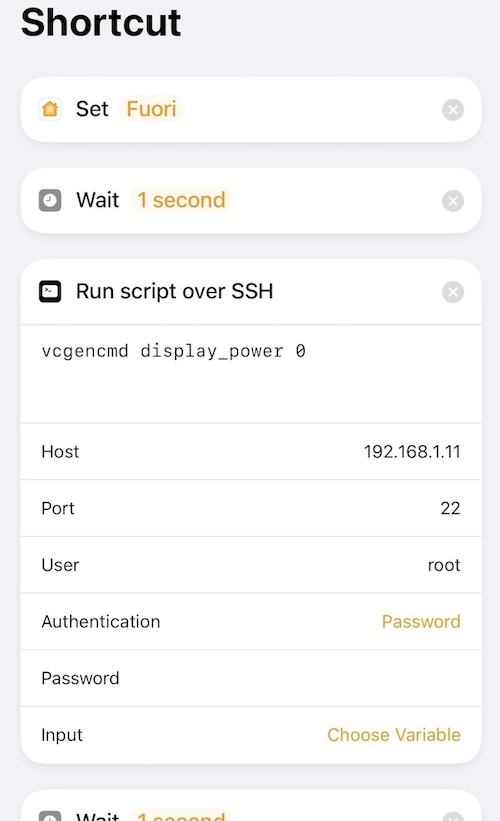
Tip: to avoid wasting unnecessary watts, I configured it to turn off when I leave home and during the night.
To turn off during the night, I used cron:
# Turn off display at 23:00
0 23 * * * /usr/bin/vcgencmd display_power 0

# Turn on display at 8:00
0 08 * * * /usr/bin/vcgencmd display_power 1
And in the Home app, using the automation “When I leave home” > “Run shortcut”
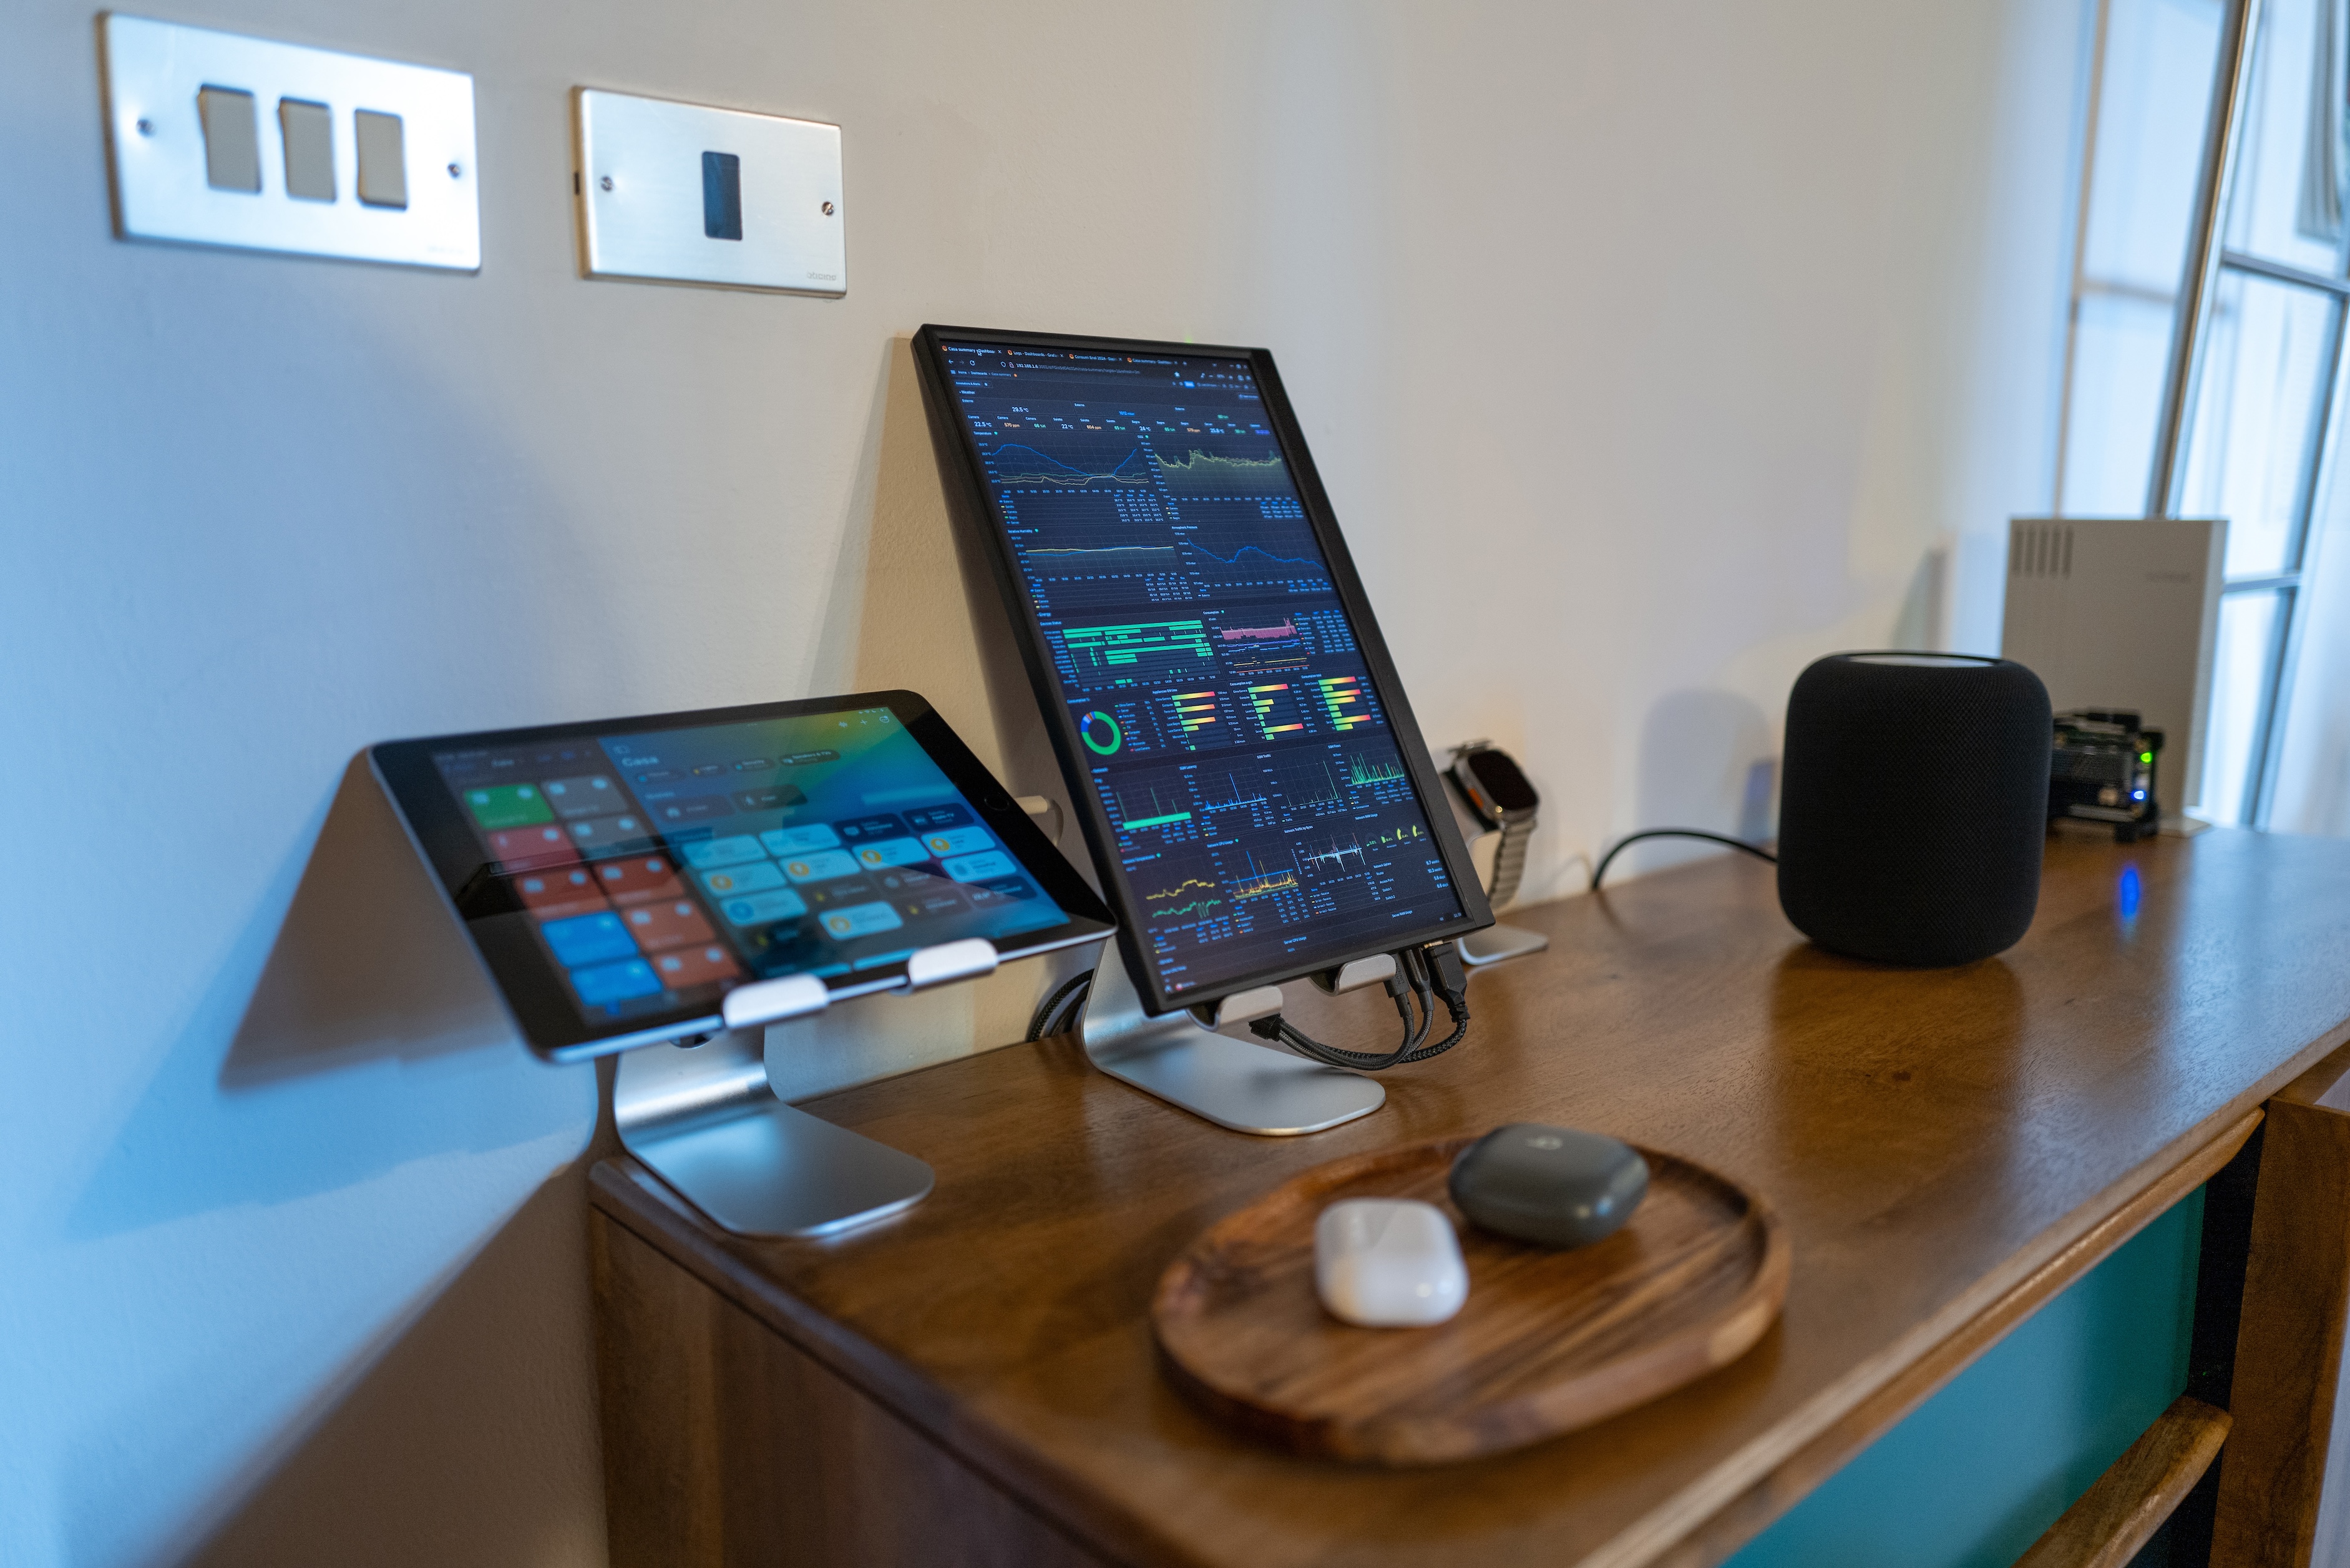
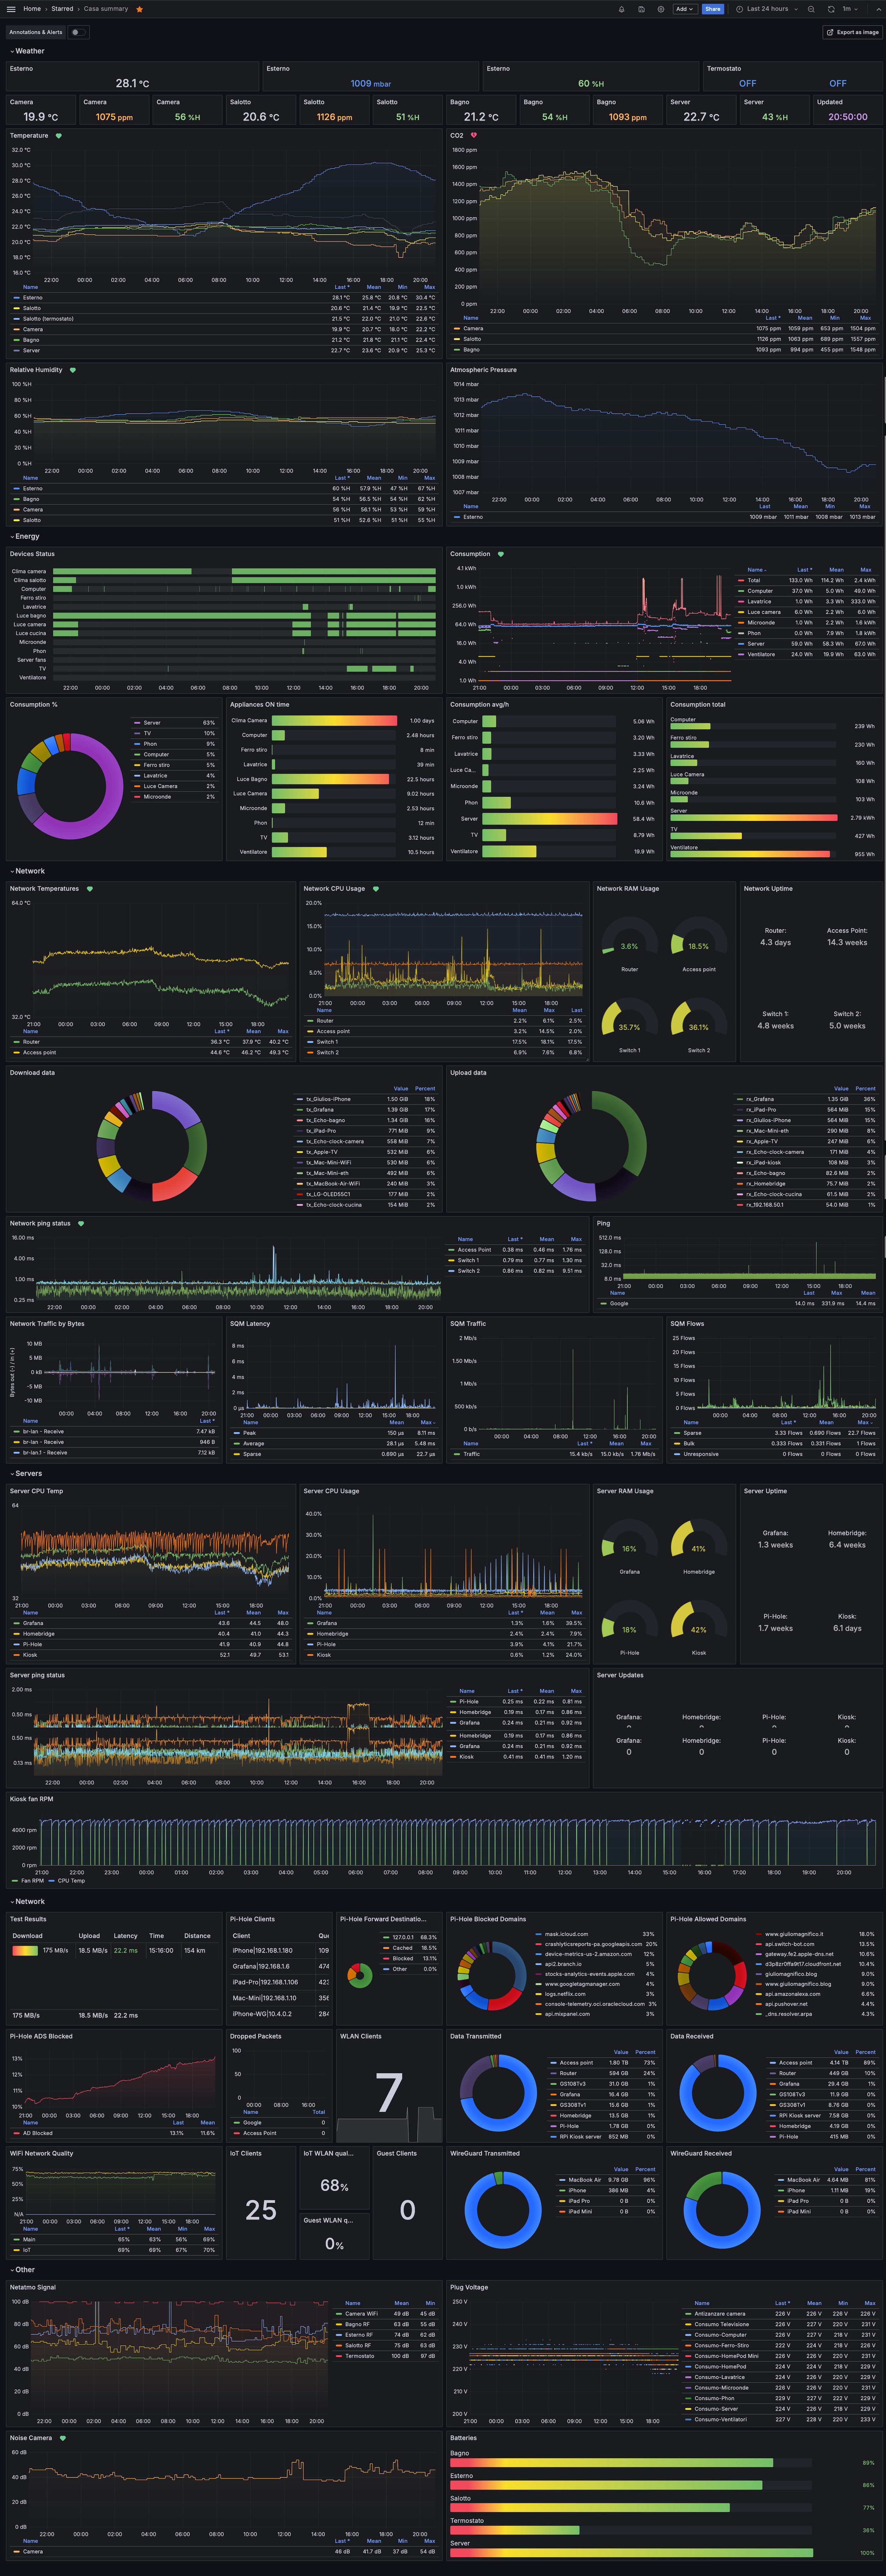
The summary dashboard
Now that I had a quite long display I needed to make use of it, so I built a summary dashboard with all the most important panels from other dashboards. This is very simple in Grafana, just copy and paste the panels from one dashboard to the other.
This is the final result:
Then I had to edit the cron jobs with the new dashboard links, basically all I had to do has been add the m to the current url of a dashboard.
I’m only sending to myself a daily morning mail (see this other post I already wrote Retrieve a scheduled report of your Grafana dashboards via mail ) with the “Casa summary” dashboard, in both dark and light UI (the light one is because could happen that I visualize the email when I’m outside from the iPhone, and with the direct sunlight on the screen I totally hate the dark interfaces. Always)
I only send myself a daily morning email (as described in another post I wrote here with the ‘Casa summary’ dashboard. I include both dark and light UI versions (the light one is handy when I check emails outdoors on my iPhone, as I find dark interfaces hard to read in direct sunlight. Always and with all the interfaces).
Log monitoring in Grafana
Sometimes I have to check the logs of a device in order to see if it’s all working fine. So I thought: why not doing it in one dashboard only in Grafana and also get an alert if something is not working as it should?
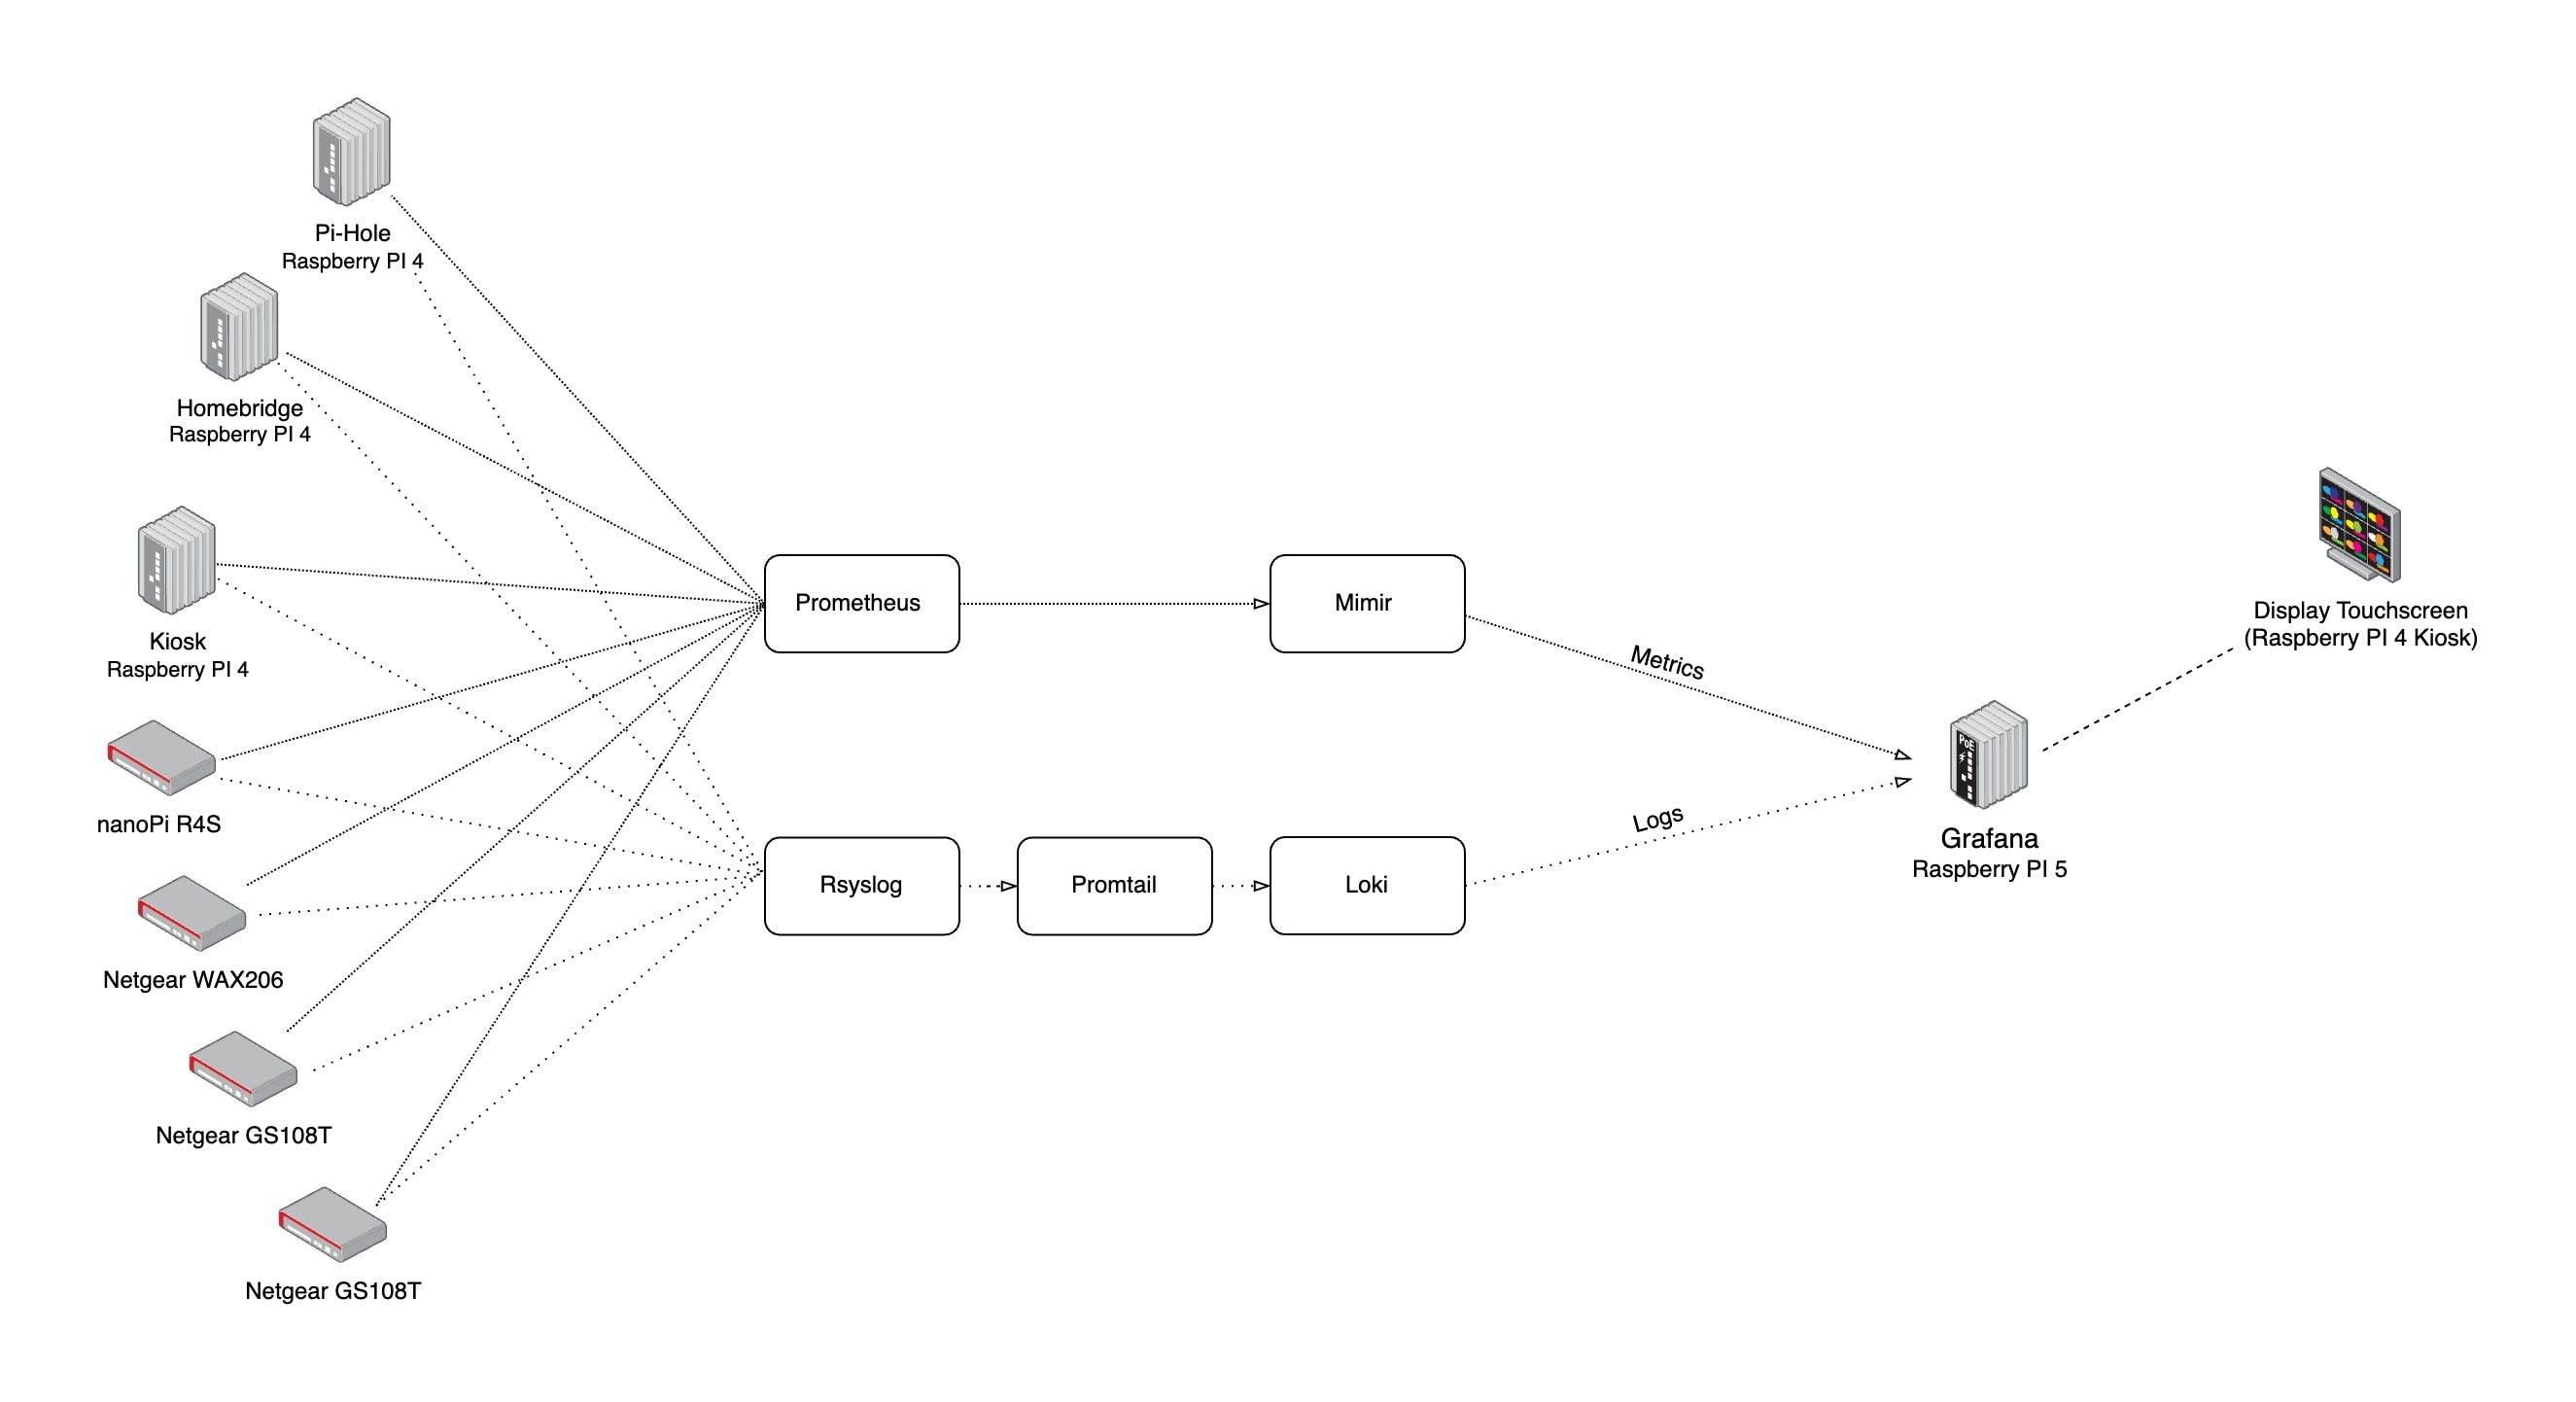
Answer: after a short research I decided to use Loki and Promtail to integrate in Grafana the logs of all the OpenWrt devices (router, access point and 2 switches) and the Raspberry Pis (Grafana, Pi-Hole, Homebridge and Kiosk).
I made the choice to send all the logs to Grafana server, read them by Promtail, after they are stored in Loki and displayed in Grafana. View this chart to better understand:
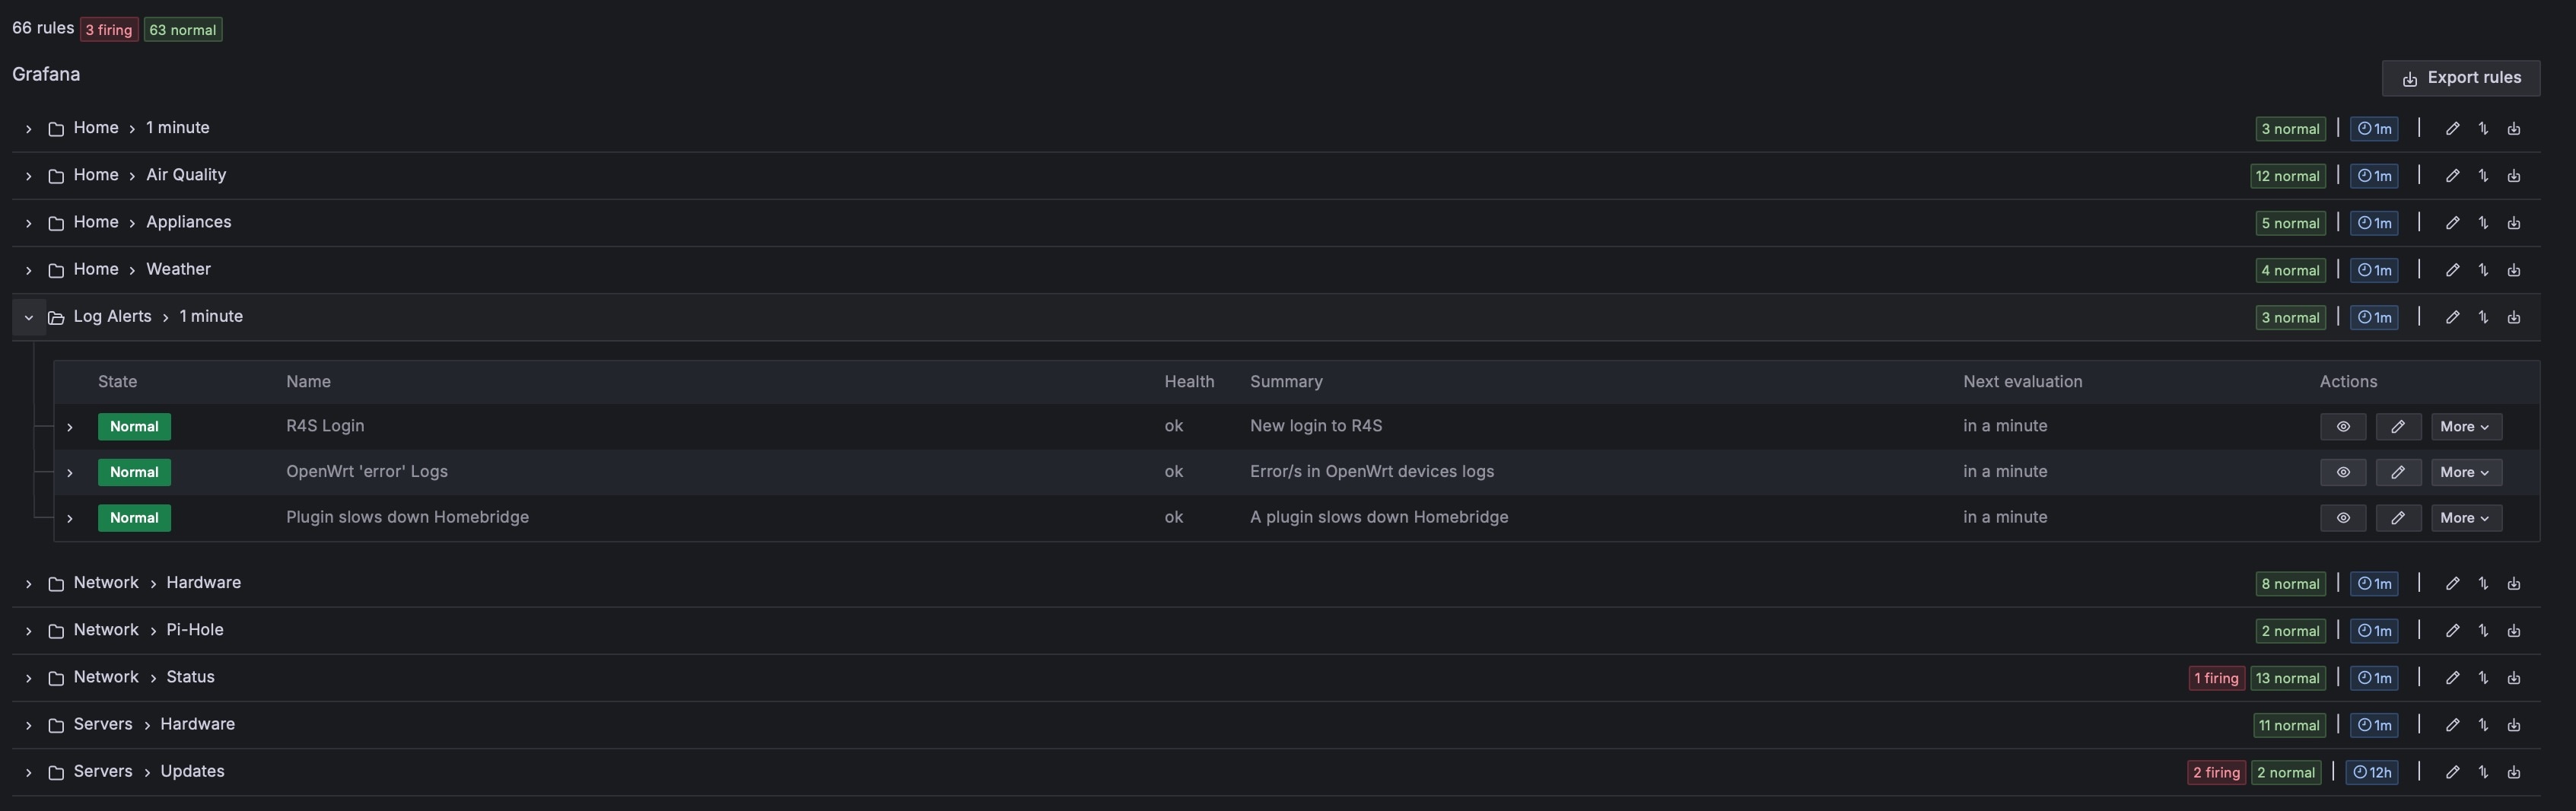
And in Grafana:
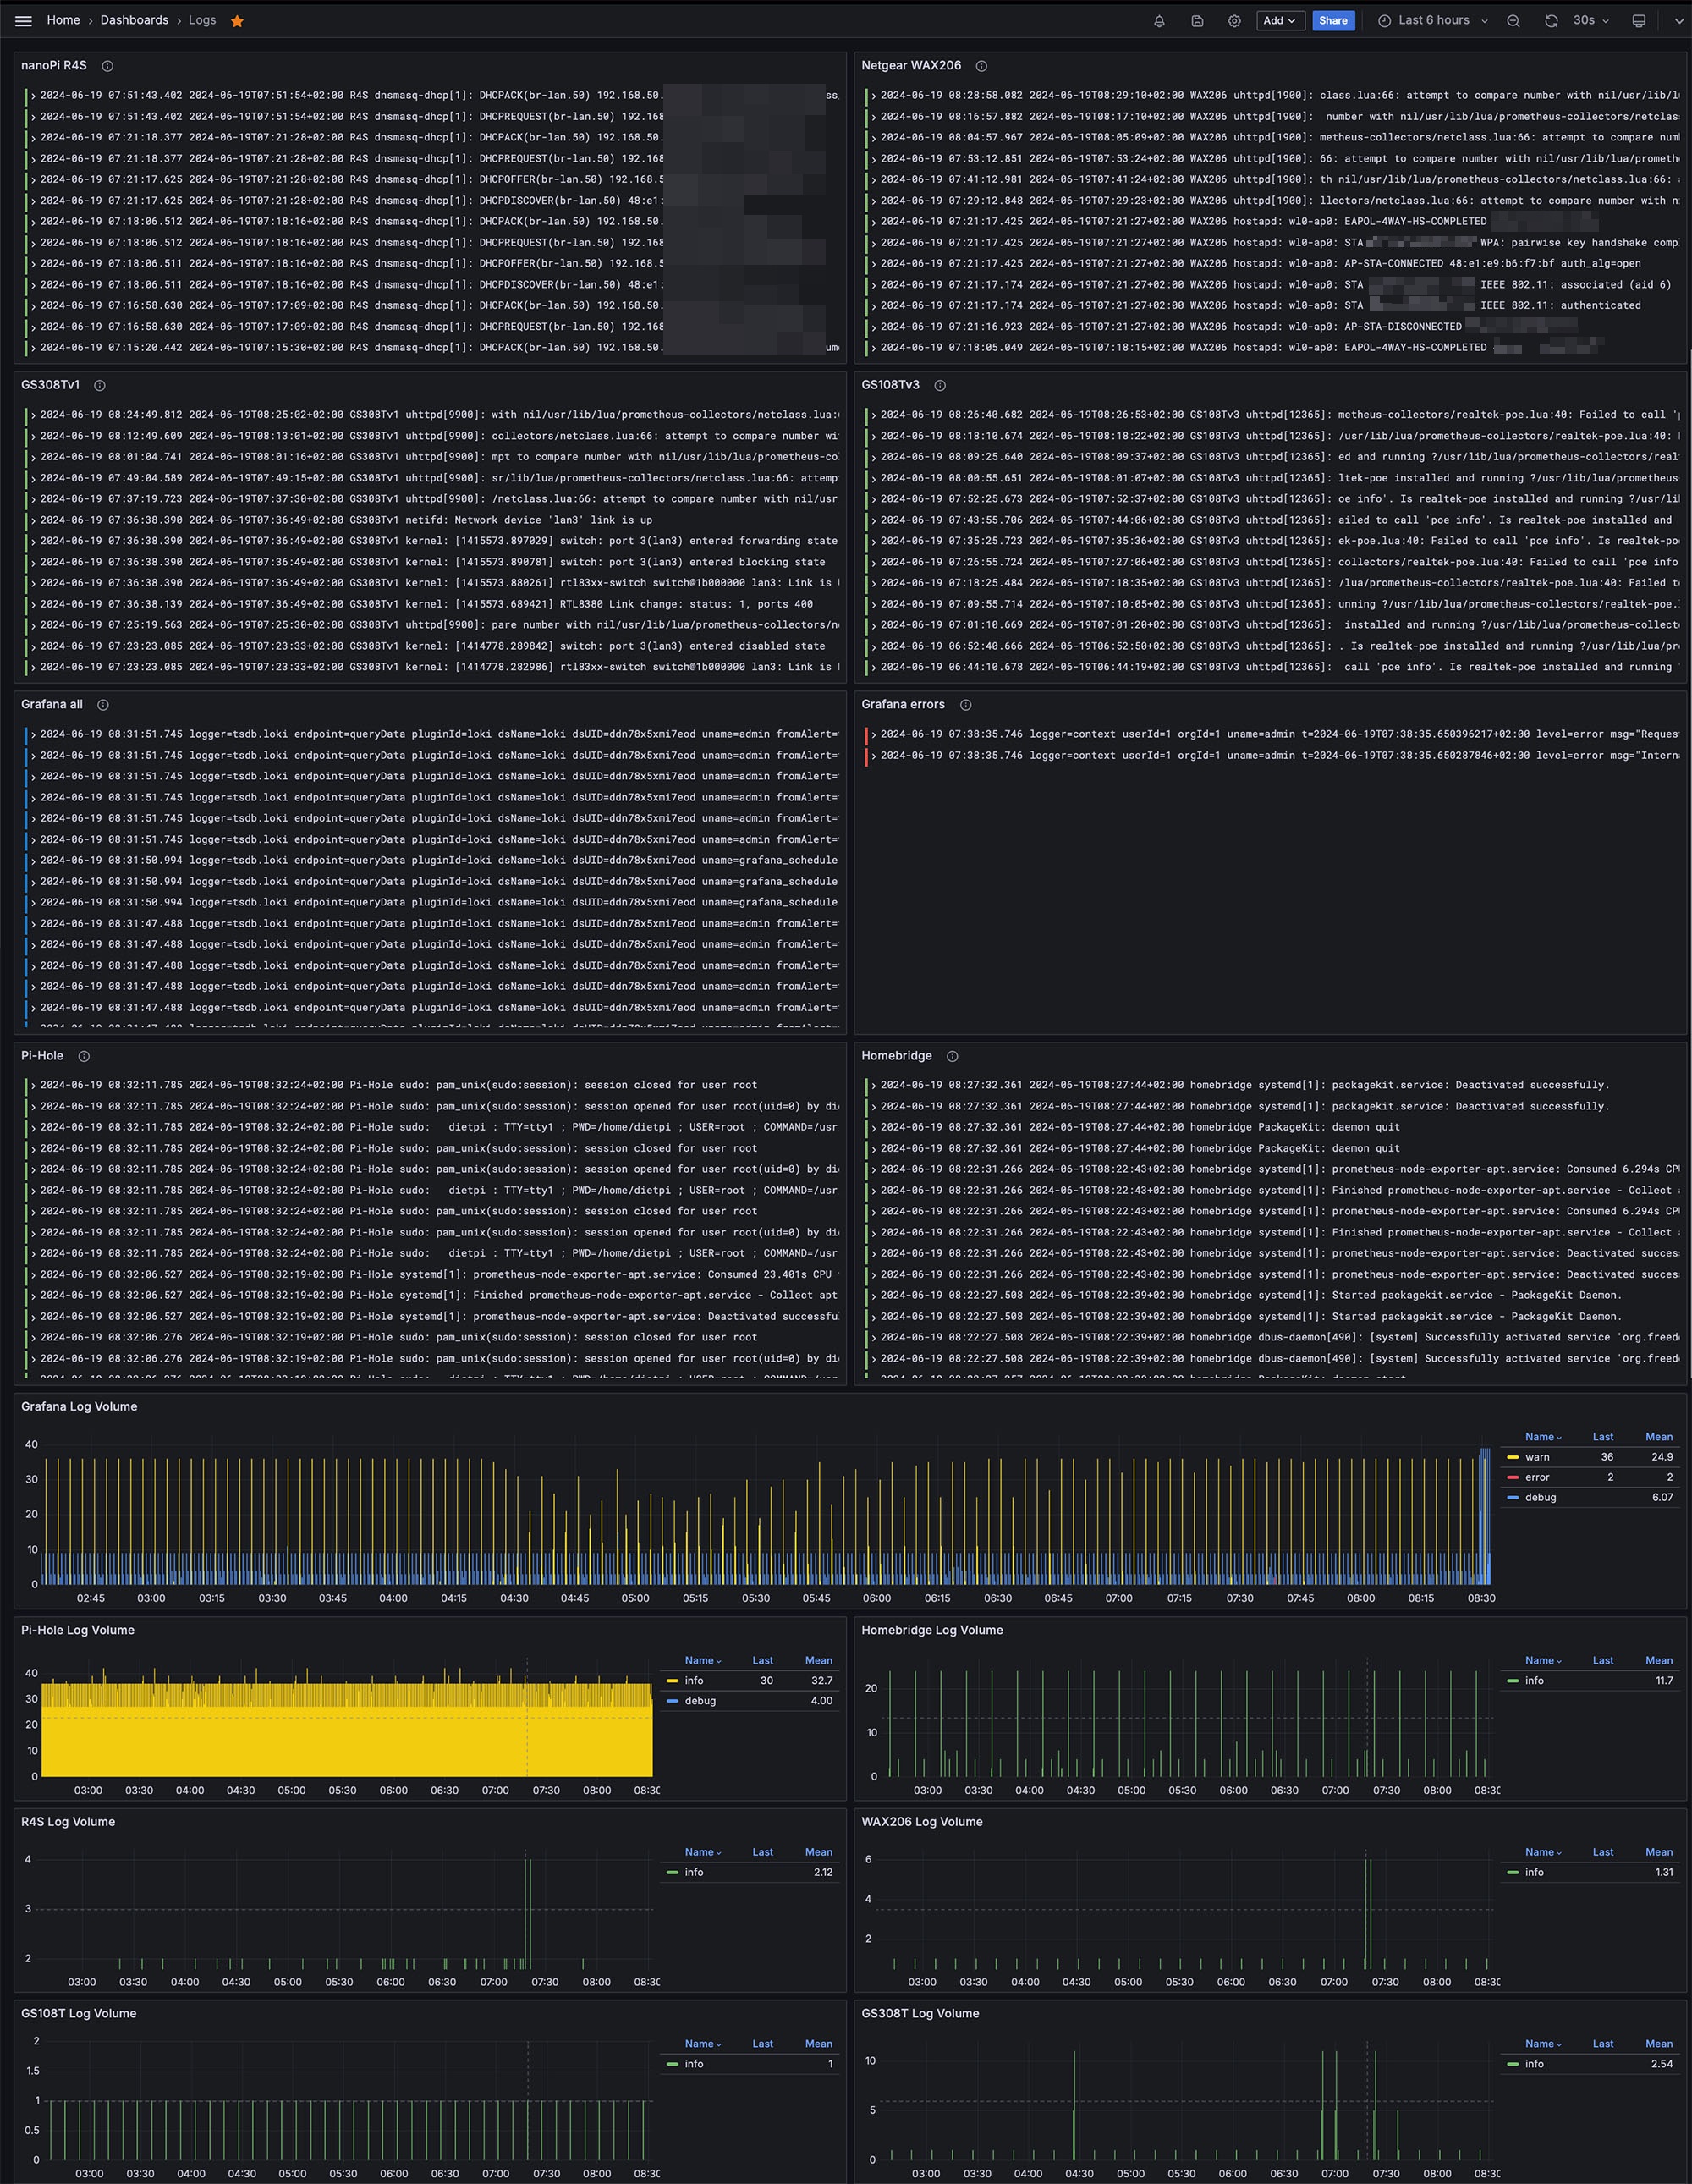
The logs alerts:
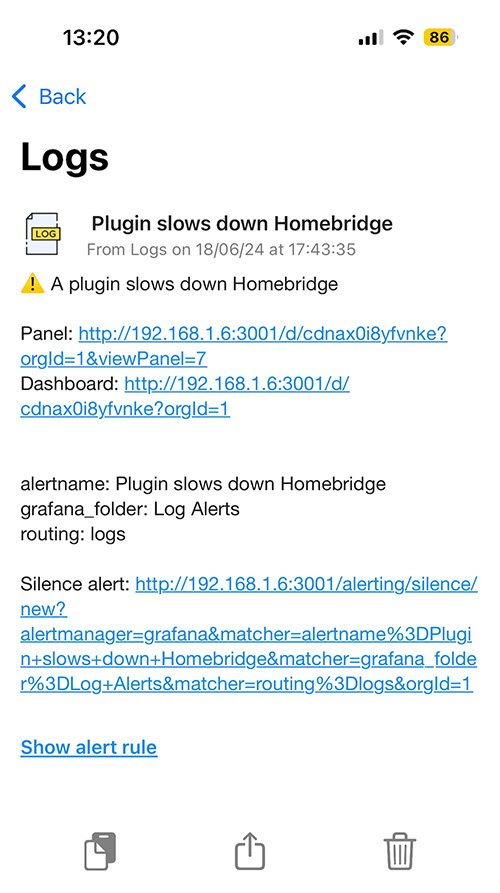
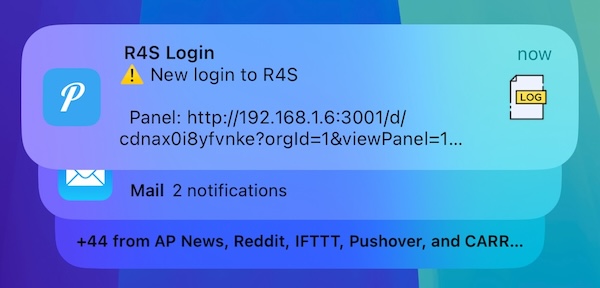
And a push notification of a log alert delivered to the iPhone:
Software and configurations
In order to obtain this result I installed Loki and Prometheus by following the official docs (Grafana Loki documentation)It’s very easy via APT: sudo apt install loki promtail
Then to “handle” the logs I decided to use Rsyslog. So I simply installed it on all the Raspberry PIs (remember that DietPI by default keeps the logs in RAM): sudo apt install rsyslog
I configured rsyslog on every RPis to send its logs to the Grafana server (IP: 192.168.1.6) by editing /etc/rsyslog.conf and adding this at the end:
# Send logs to Grafana
*.* @192.168.1.6:514
And I configured rsyslog in the Grafana server to store the logs in a tidy way, I edited the rsyslog.conf in Grafana server by adding these “rules” that keep the logs organized:
# OpenWrt logs
if $fromhost-ip == '192.168.1.2' then /var/log/openwrt/r4s.log
if $fromhost-ip == '192.168.1.3' then /var/log/openwrt/wax206.log
if $fromhost-ip == '192.168.1.240' then /var/log/openwrt/GS308Tv1.log
if $fromhost-ip == '192.168.1.241' then /var/log/openwrt/GS108Tv3.log

# Other network servers logs
if $fromhost-ip == '192.168.1.4' then /var/log/network/pihole.log
if $fromhost-ip == '192.168.1.5' then /var/log/network/homebridge.log
After the Loki setup, I had to configure Promtail to scrape these Loki’s files, so I edited /etc/promtail/config.yml and added the parameters of every job/IP:
- job_name: 'OpenWrt'
  static_configs:
  - targets:
      - 'localhost'
    labels:
      job: R4S
      __path__: /var/log/openwrt/r4s.log
  - targets:
      - 'localhost'
Same for other devices, only with different names off course:
- job_name: 'Network'
  static_configs:
  - targets:
      - 'localhost'
    labels:
      job: Pi-Hole
      __path__: /var/log/network/pihole.log
About the OpenWrt devices logs, this was easier than the RPis because OpenWrt already has its own log service that can forward logs, so I had only to modify these parameters in LuCi:
System > System > Logging
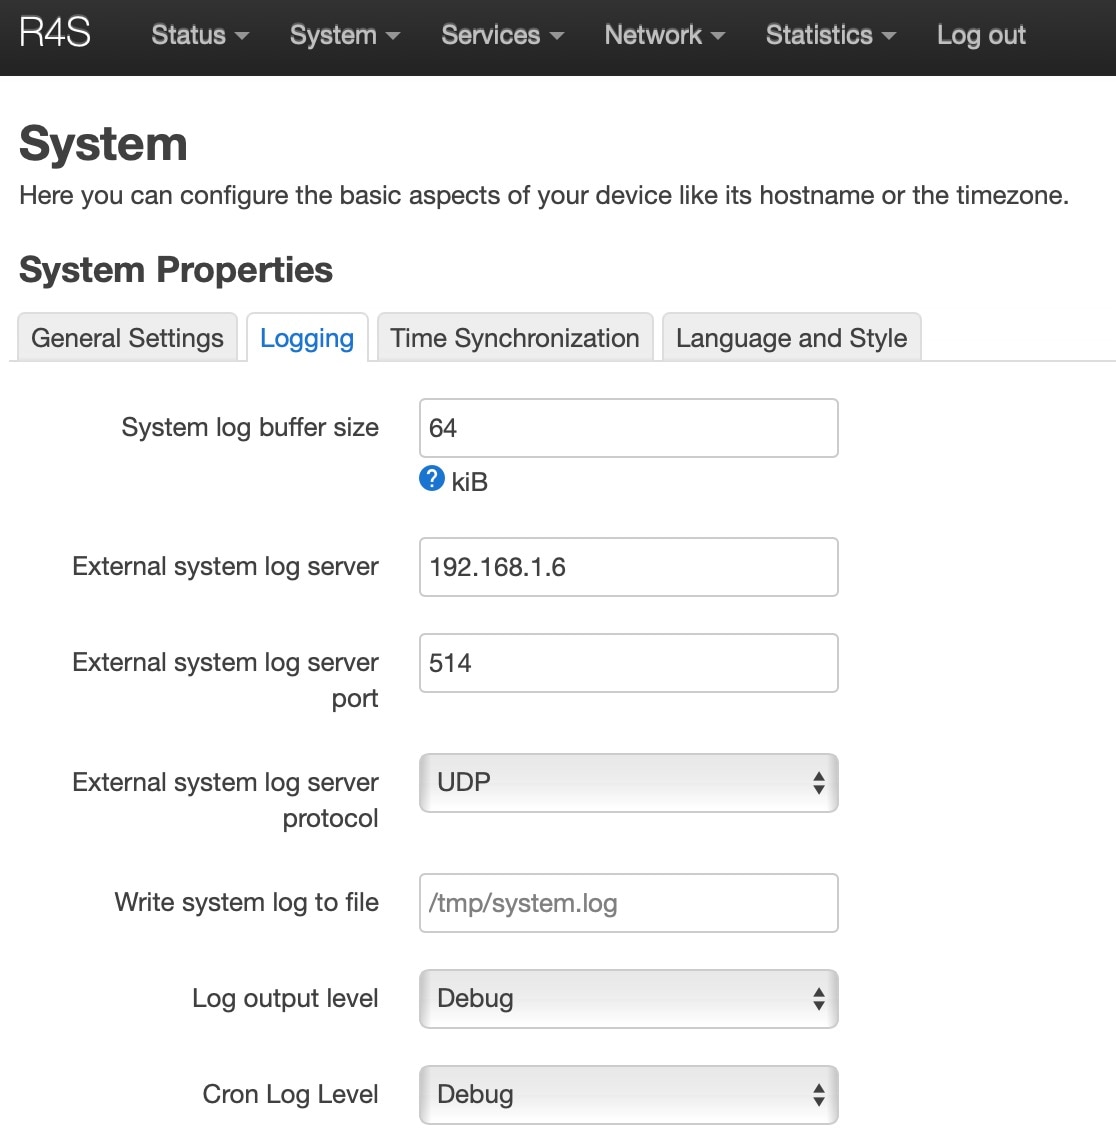
Same as the WebUI but done in CLI:
cat /etc/config/system

config system
        option ttylogin '0'
        option log_size '64'
        option urandom_seed '0'
        option log_proto 'udp'
        option conloglevel '8'
        option cronloglevel '5'
        option hostname 'R4S'
        option zonename 'Europe/Rome'
        option timezone 'CET-1CEST,M3.5.0,M10.5.0/3'
        option log_ip '192.168.1.6'
        option log_port '514'
Final test
Time for a big restart of all the services on all the devices:
In Grafana server: service promtail restart && service loki restart
On the other Raspberry PIs: service rsyslog restart
And on the OpenWrt devices: service log restart
Then I went back in Grafana webUI and under the Explore tab I started to see all the logs
Log Alerts
To receive an alert when a log reports something specific (like a particular error), I followed the same steps I used for other alerts, for a full explanation, I suggest reading this post I wrote a few years ago: Some custom push notifications that improved my life
In short:
- I created a new app in Pushover with a custom icon.
- Added the token and data to a new alert policy in Grafana.
- Created the route and details for this new policy.
- Lastly, I set up the alert in Grafana.
Tip: example of query for the OpenWrt error logs alert:
count_over_time({job=~"R4S|GS108Tv3|GS308Tv1|WAX206"} | level = `error` [$__auto])
Quick tip: If you don’t want Loki to send its usage stats, you can disable the metric reporting to stats.grafana.org. To do this, edit the /etc/loki/config.yml file and uncomment the last two lines. But note that these stats are anonymized and helpful to developers. Consider disabling them only if you observe excessive requests to the grafana domain…like me :)
# By default, Loki will send anonymous, but uniquely-identifiable usage and configuration
# analytics to Grafana Labs. These statistics are sent to https://stats.grafana.org/
#
# Statistics help us better understand how Loki is used, and they show us performance
# levels for most users. This helps us prioritize features and documentation.
# For more information on what's sent, look at
# https://github.com/grafana/loki/blob/main/pkg/analytics/stats.go
# Refer to the buildReport method to see what goes into a report.
#
# If you would like to disable reporting, uncomment the following lines:
analytics:
  reporting_enabled: false
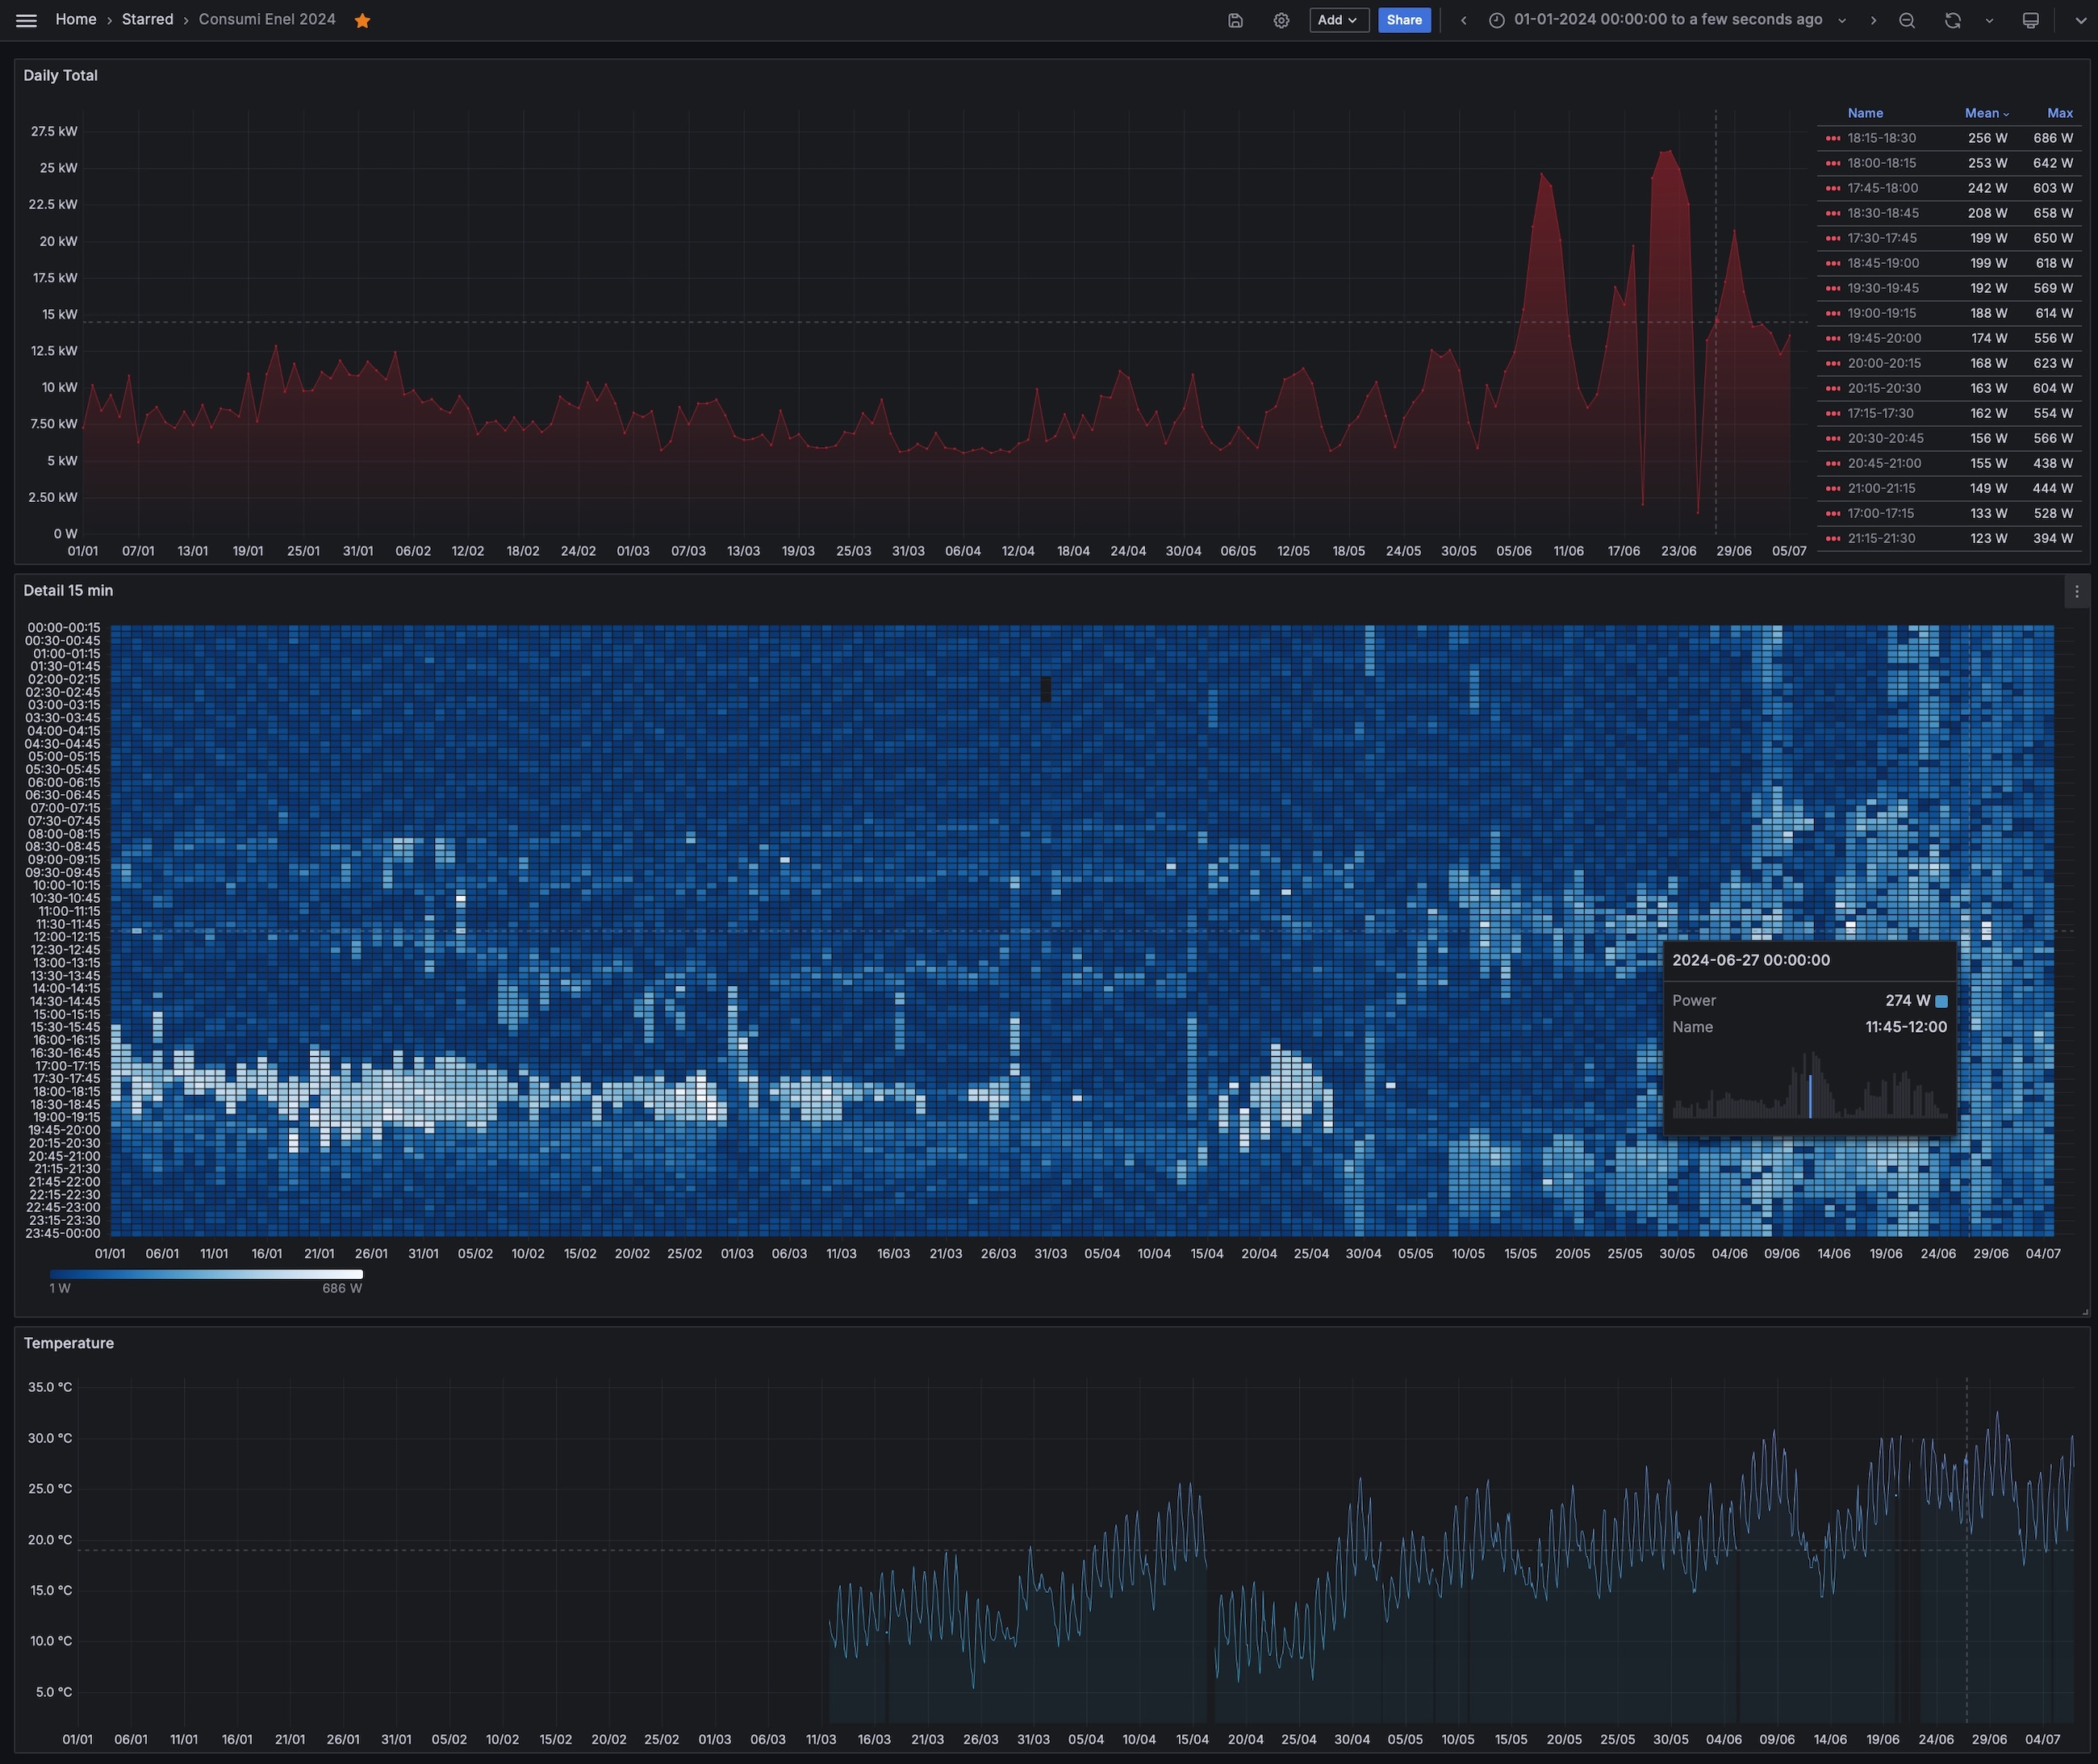
The true electric consumption
I discovered that my energy supplier provides access to a .csv file detailing household energy consumption measured at the electric meter, with readings every 15 minutes (the company is Enel, via the e-distribuzione website, if you live in Italy). This is perfect because these data represents the accurate measurements recorded by the company, avoiding discrepancies that can occur with data from personal devices (like Shelly or similar).
The only drawback with this method is that the .csv file is updated daily rather than in real-time. However, for my needs, I don’t require a real-time snapshot of my total power consumption. What I need is real-time data on how much power a specific device (like the washing machine) is drawing, so I can adjust my usage or turn it off.
Having a daily overview of my consumption with 15 mins intervals over periods of 2, 3, 5, or 7 days is more valuable to me. This allows me to analyze how my behaviors impact energy usage. For example, if I wash and dry my sheets once a week, I can see how much more energy I consume during that period (or those 1-2 hours) compared to days when I only do a quick load of laundry with a few clothes and no dryer
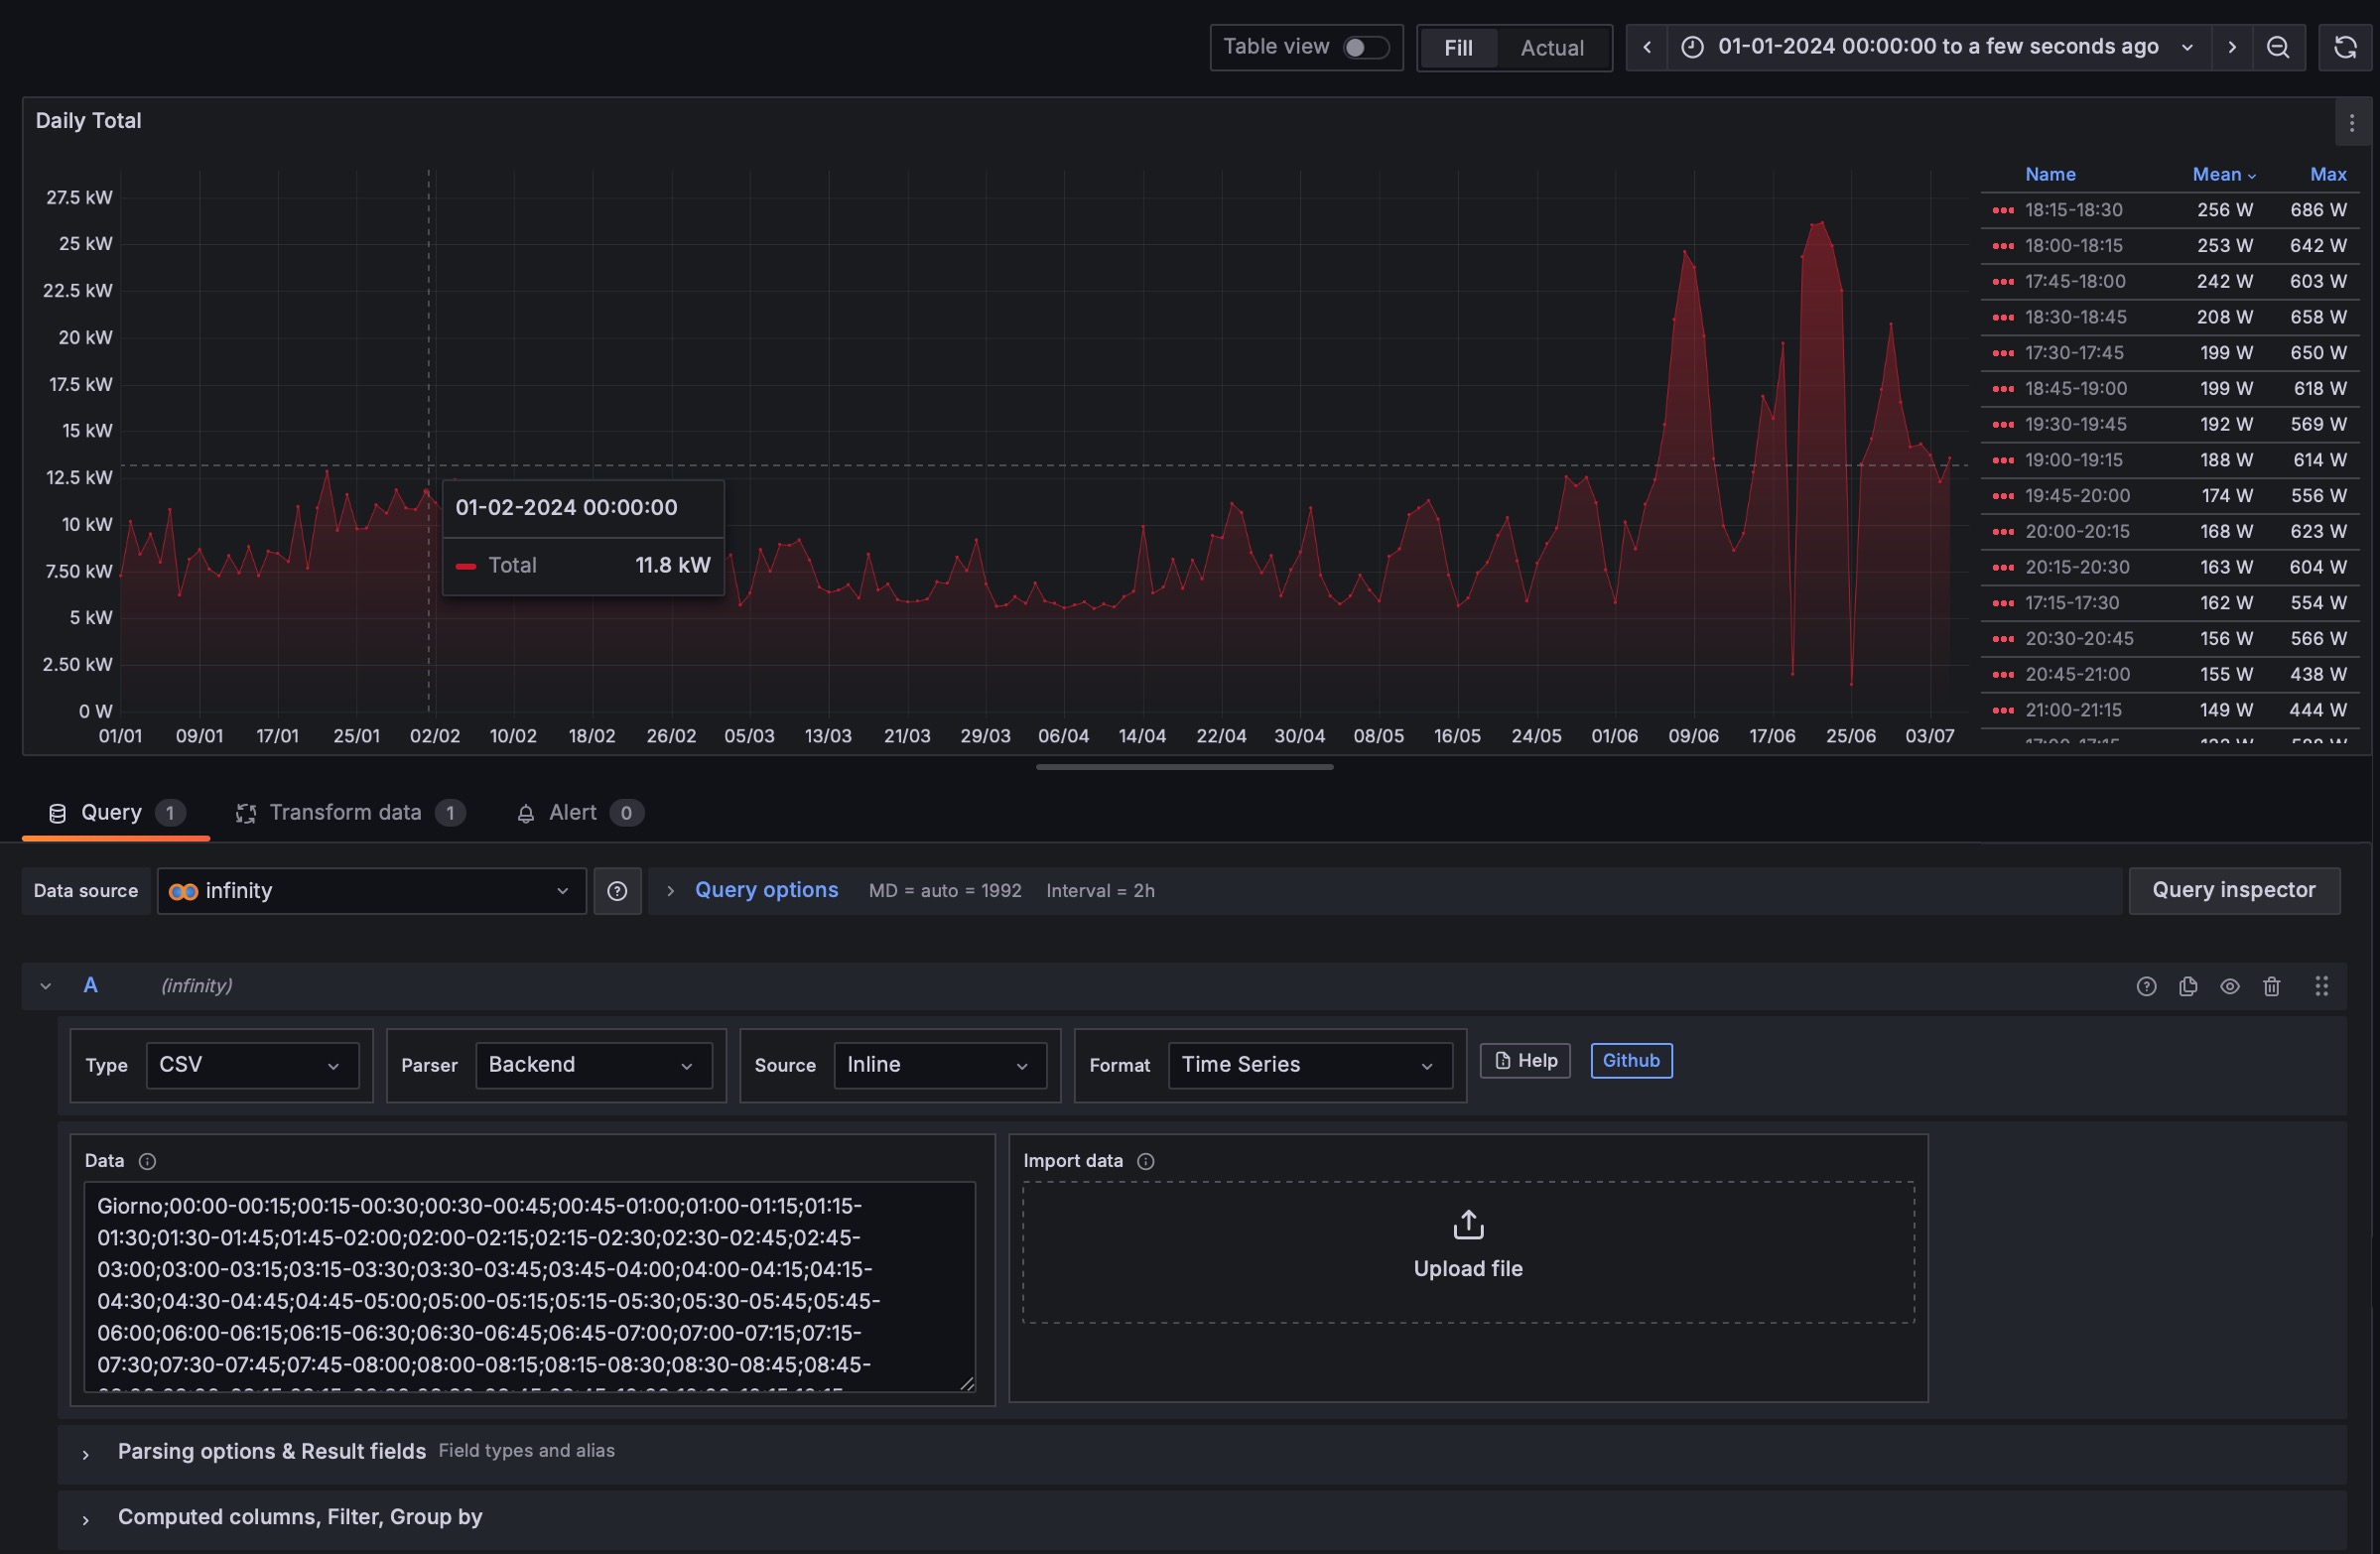
Importing and viewing the .csv in Grafana
In order to import and visualize the .csv file, I used a great plugin for Grafana that not only allows you to import CSV files from local or remote sources (with many types of authentications), but also supports other file types (JSON-CSV-GraphQL-XML-HTM). The plugin is called Infinity Data Source Plugin for Grafana, and it has dedicated documentation here: Infinity Data Source Plugin for Grafana.
In order to obtain this, I downloaded the .csv file for every month and created a unique file for each year, which I then uploaded to the Infinity Data Source Plugin in Grafana.
Now, when I want the data for a new day, days, or week, I just add those days to the “2024_enel.csv” file and import it into the Infinity Data Source Plugin. Or I can copy-paste only the data for the new days directly into the Infinity Data Source Plugin box.
(Yes, I’m trying to create something that can automatically update the file, but due to the website’s authentication method, I’m facing some issues.)
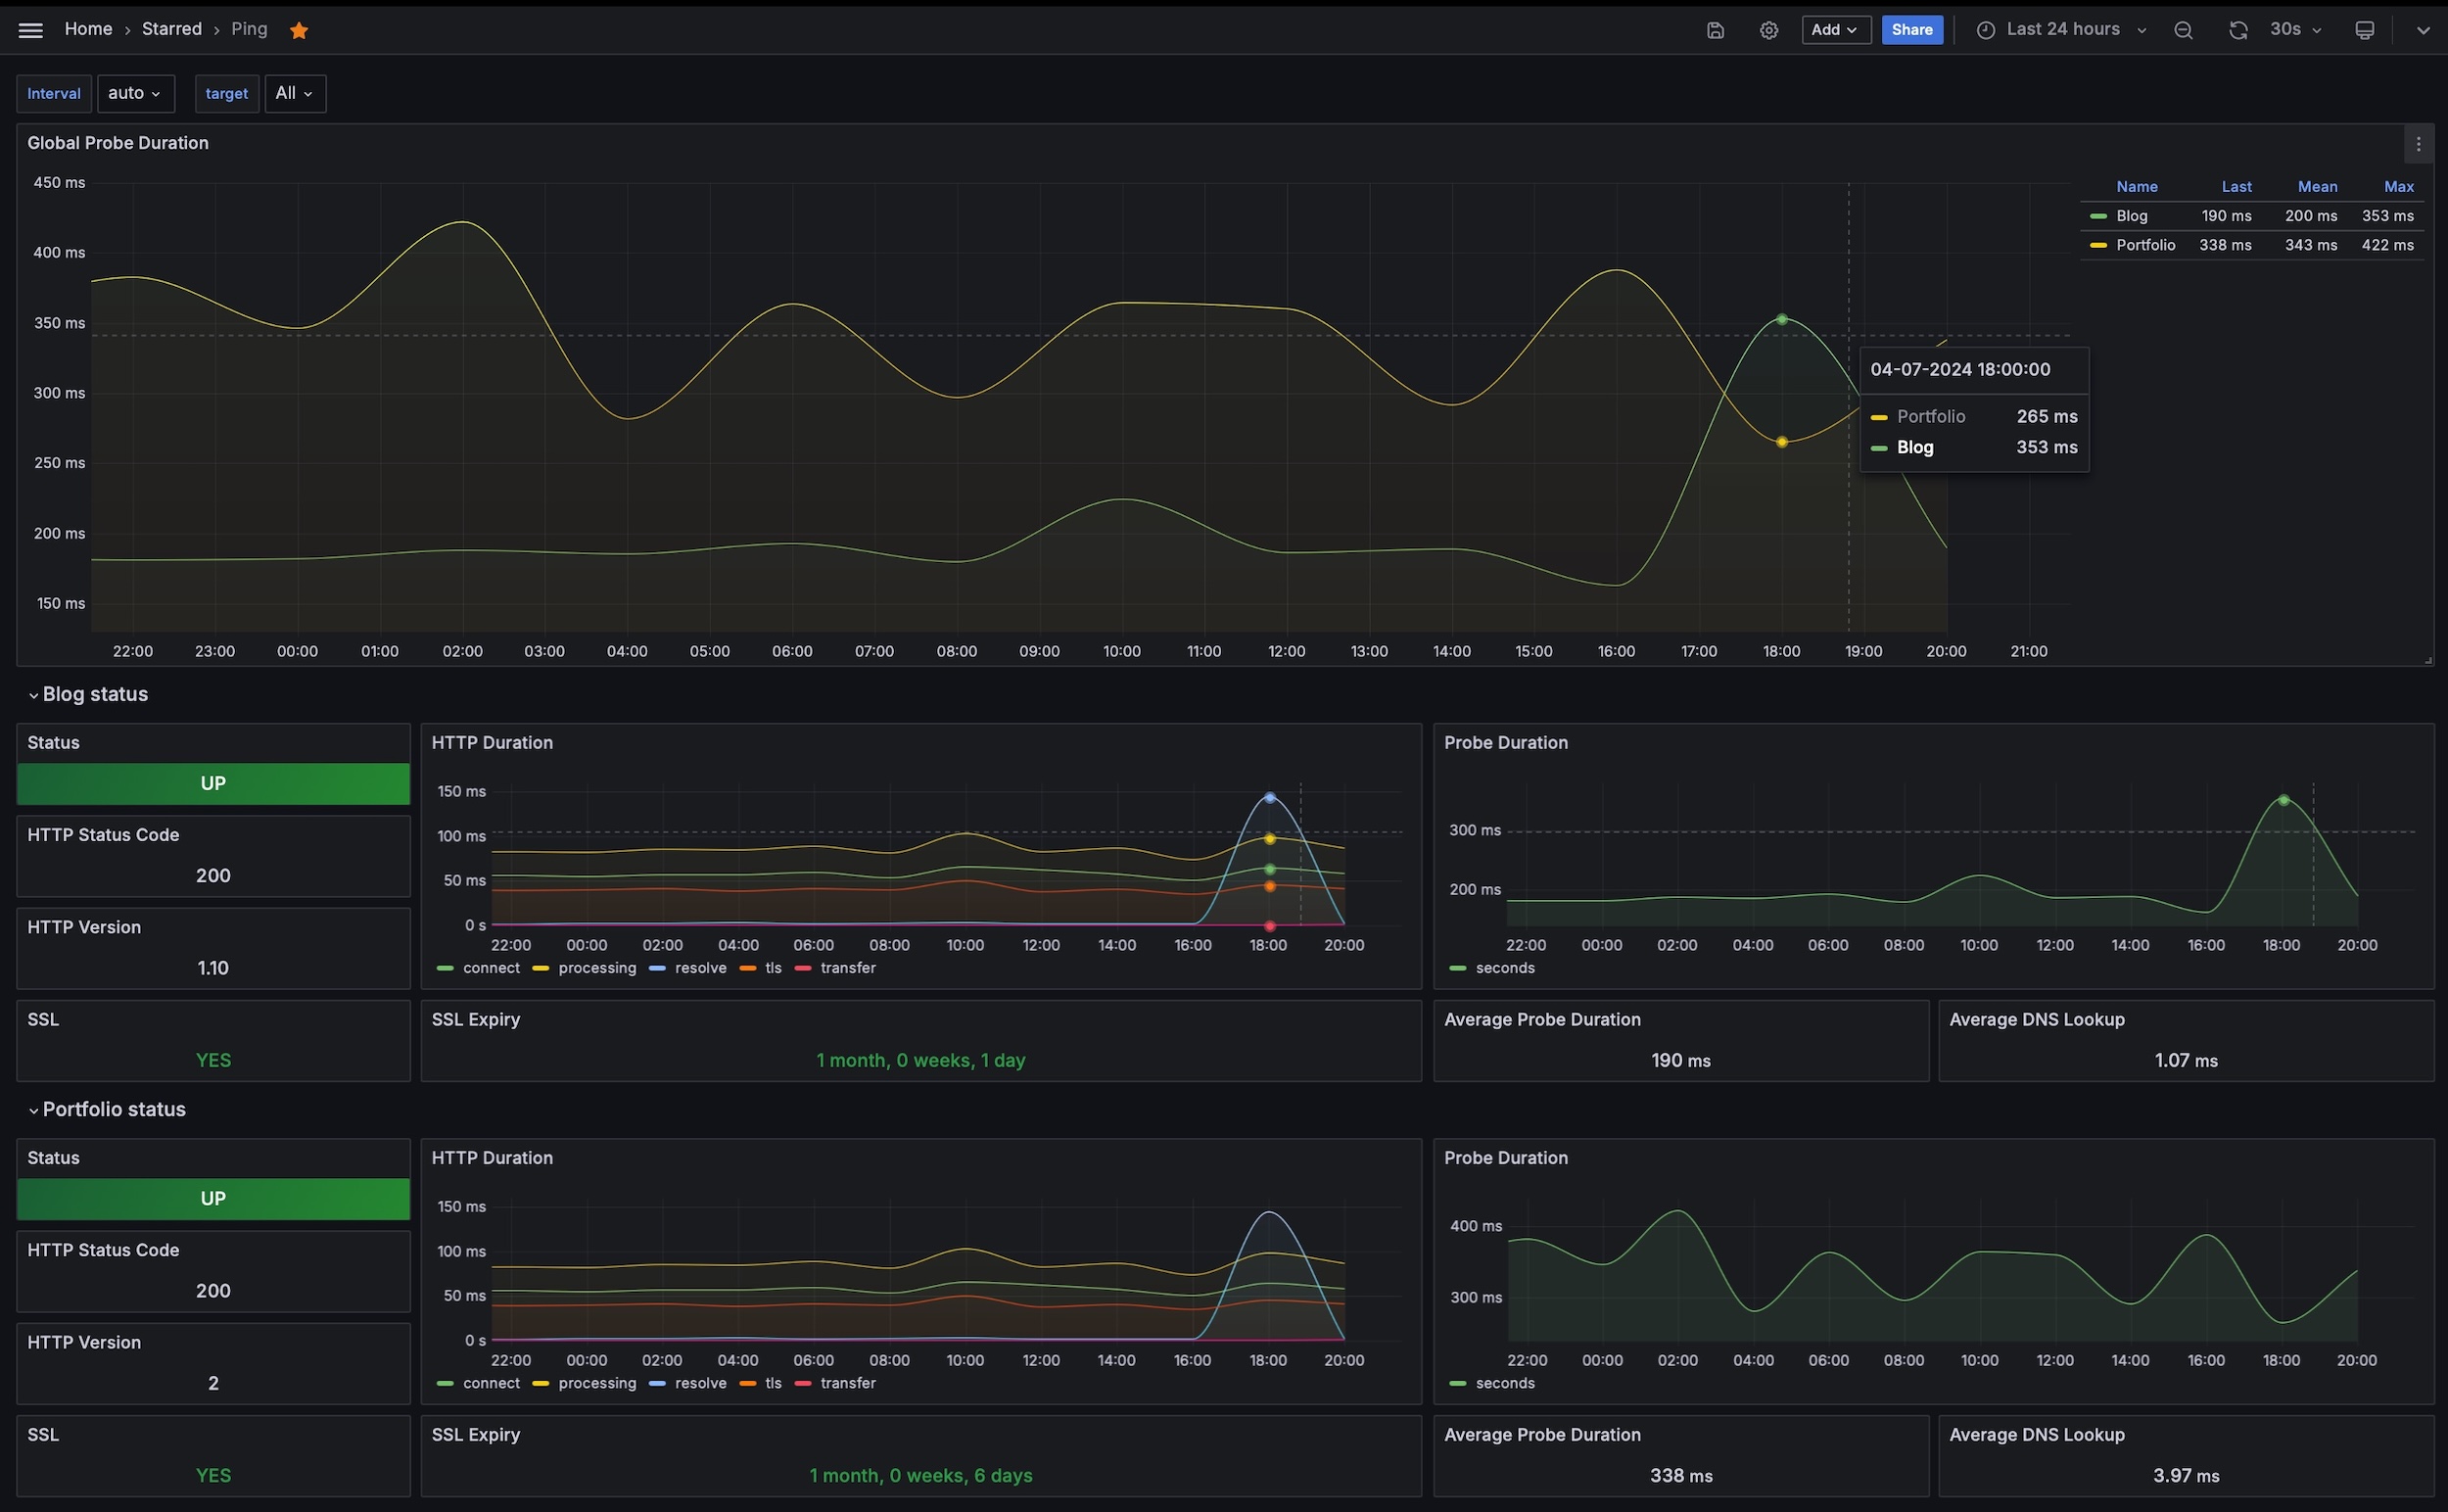
Blackbox-exporter for Prometheus
I initially installed this well-made official exporter for Prometheus to monitor the ping time within my LAN, and set up Grafana alerts to notify me when a device is unresponsive/down. …but I then realized that the core of my network is the router, not the Grafana server where the plugin should have been running, so configured the router to ping the other network devices using collectd:
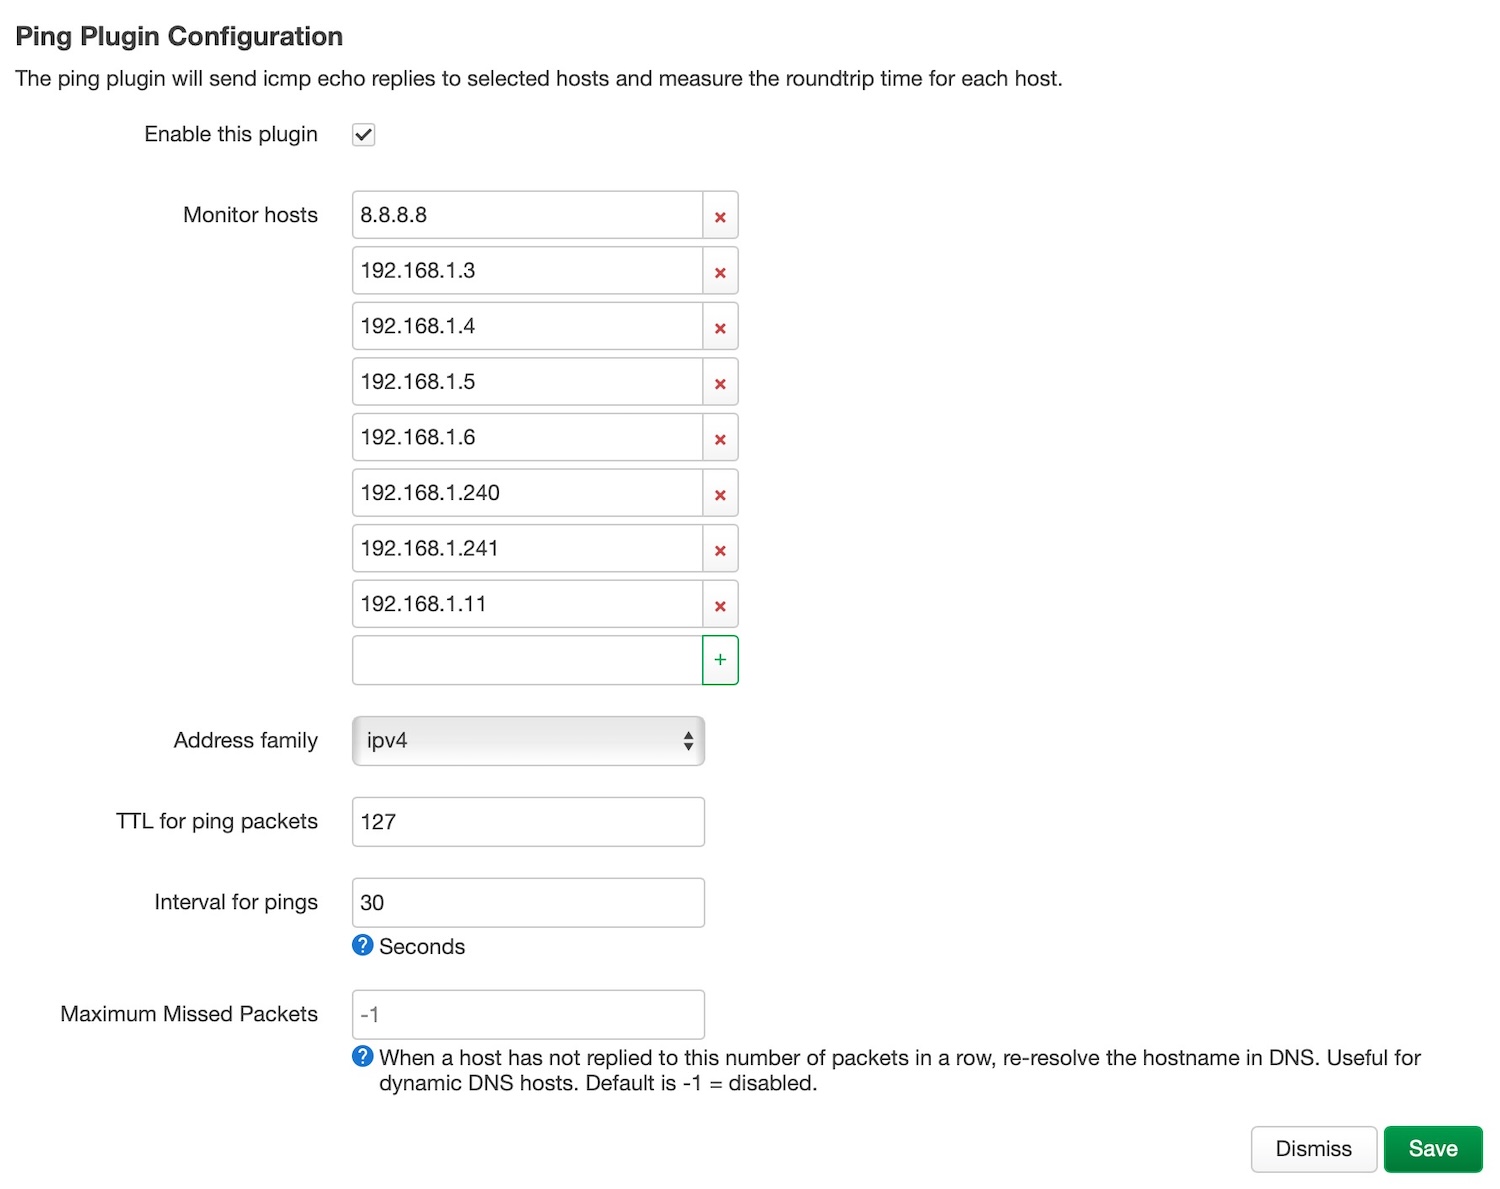
It’s quite useful for receiving push notifications when something goes wrong or a device in the network goes down:
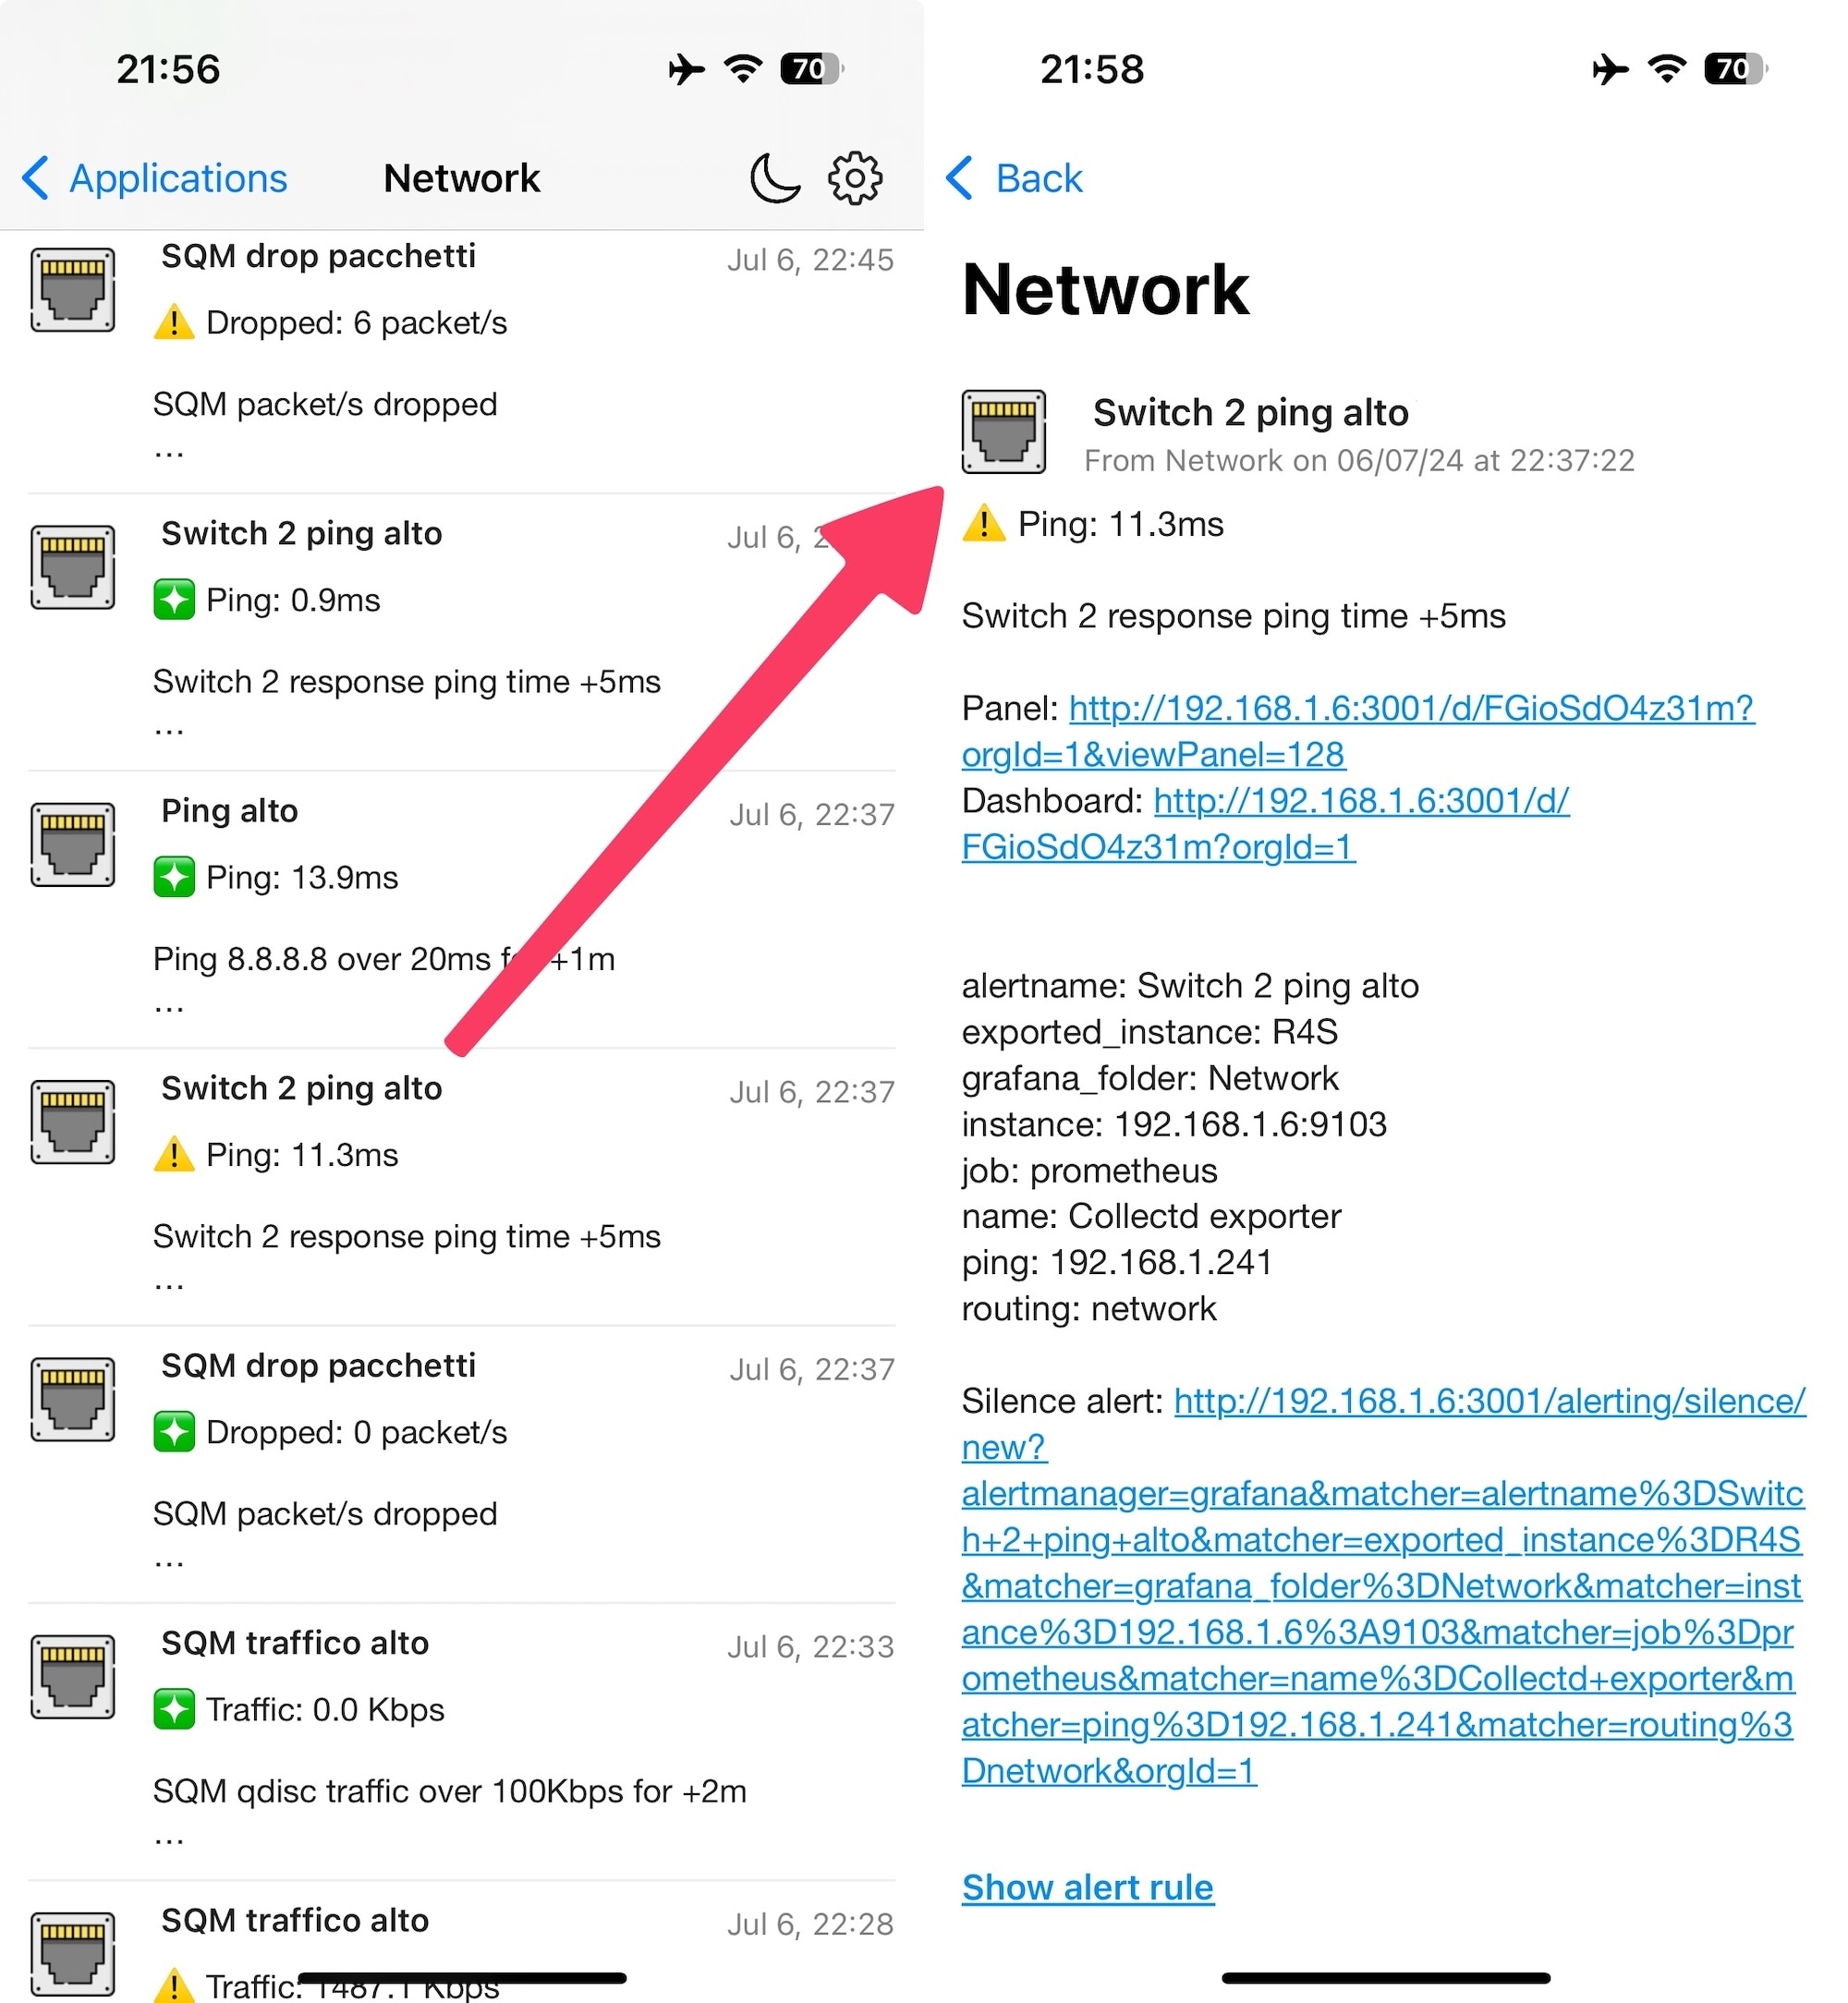 (https://giuliomagnifico.blog/_images/2024/home_setup_v5/ping-alert.jpg)
At that point, I (re)used the already-configured blackbox_exporter to monitor my (this) blog and portfolio (giuliomagnifico.it)
Prometheus configuration if you need it for some reason:
  - job_name: 'blackbox_endpoints'
    metrics_path: /probe
    scrape_interval: 3m
    params:
      module: [http_2xx]  # Look for an HTTP 200 response.
    static_configs:
      - targets:
          - "www.giuliomagnifico.blog"  # Blog
          - "www.giuliomagnifico.it"	# Portfolio
    relabel_configs:
      - source_labels: [instance]
        regex: 'www.giuliomagnifico.blog'
        target_label: instance
        replacement: 'Blog'
      - source_labels: [instance]
        regex: 'www.giuliomagnifico.it'
        target_label: instance
        replacement: 'Portfolio'
And here is the Grafana dashboard I used.
It can track SSL certificates, response times, and more. Just a tip if you have many websites to monitor, check if they’re online, the response time, the expiration of SSL certificates, etc… blackbox_exporter is a nice tool.
Switch OpenWrt
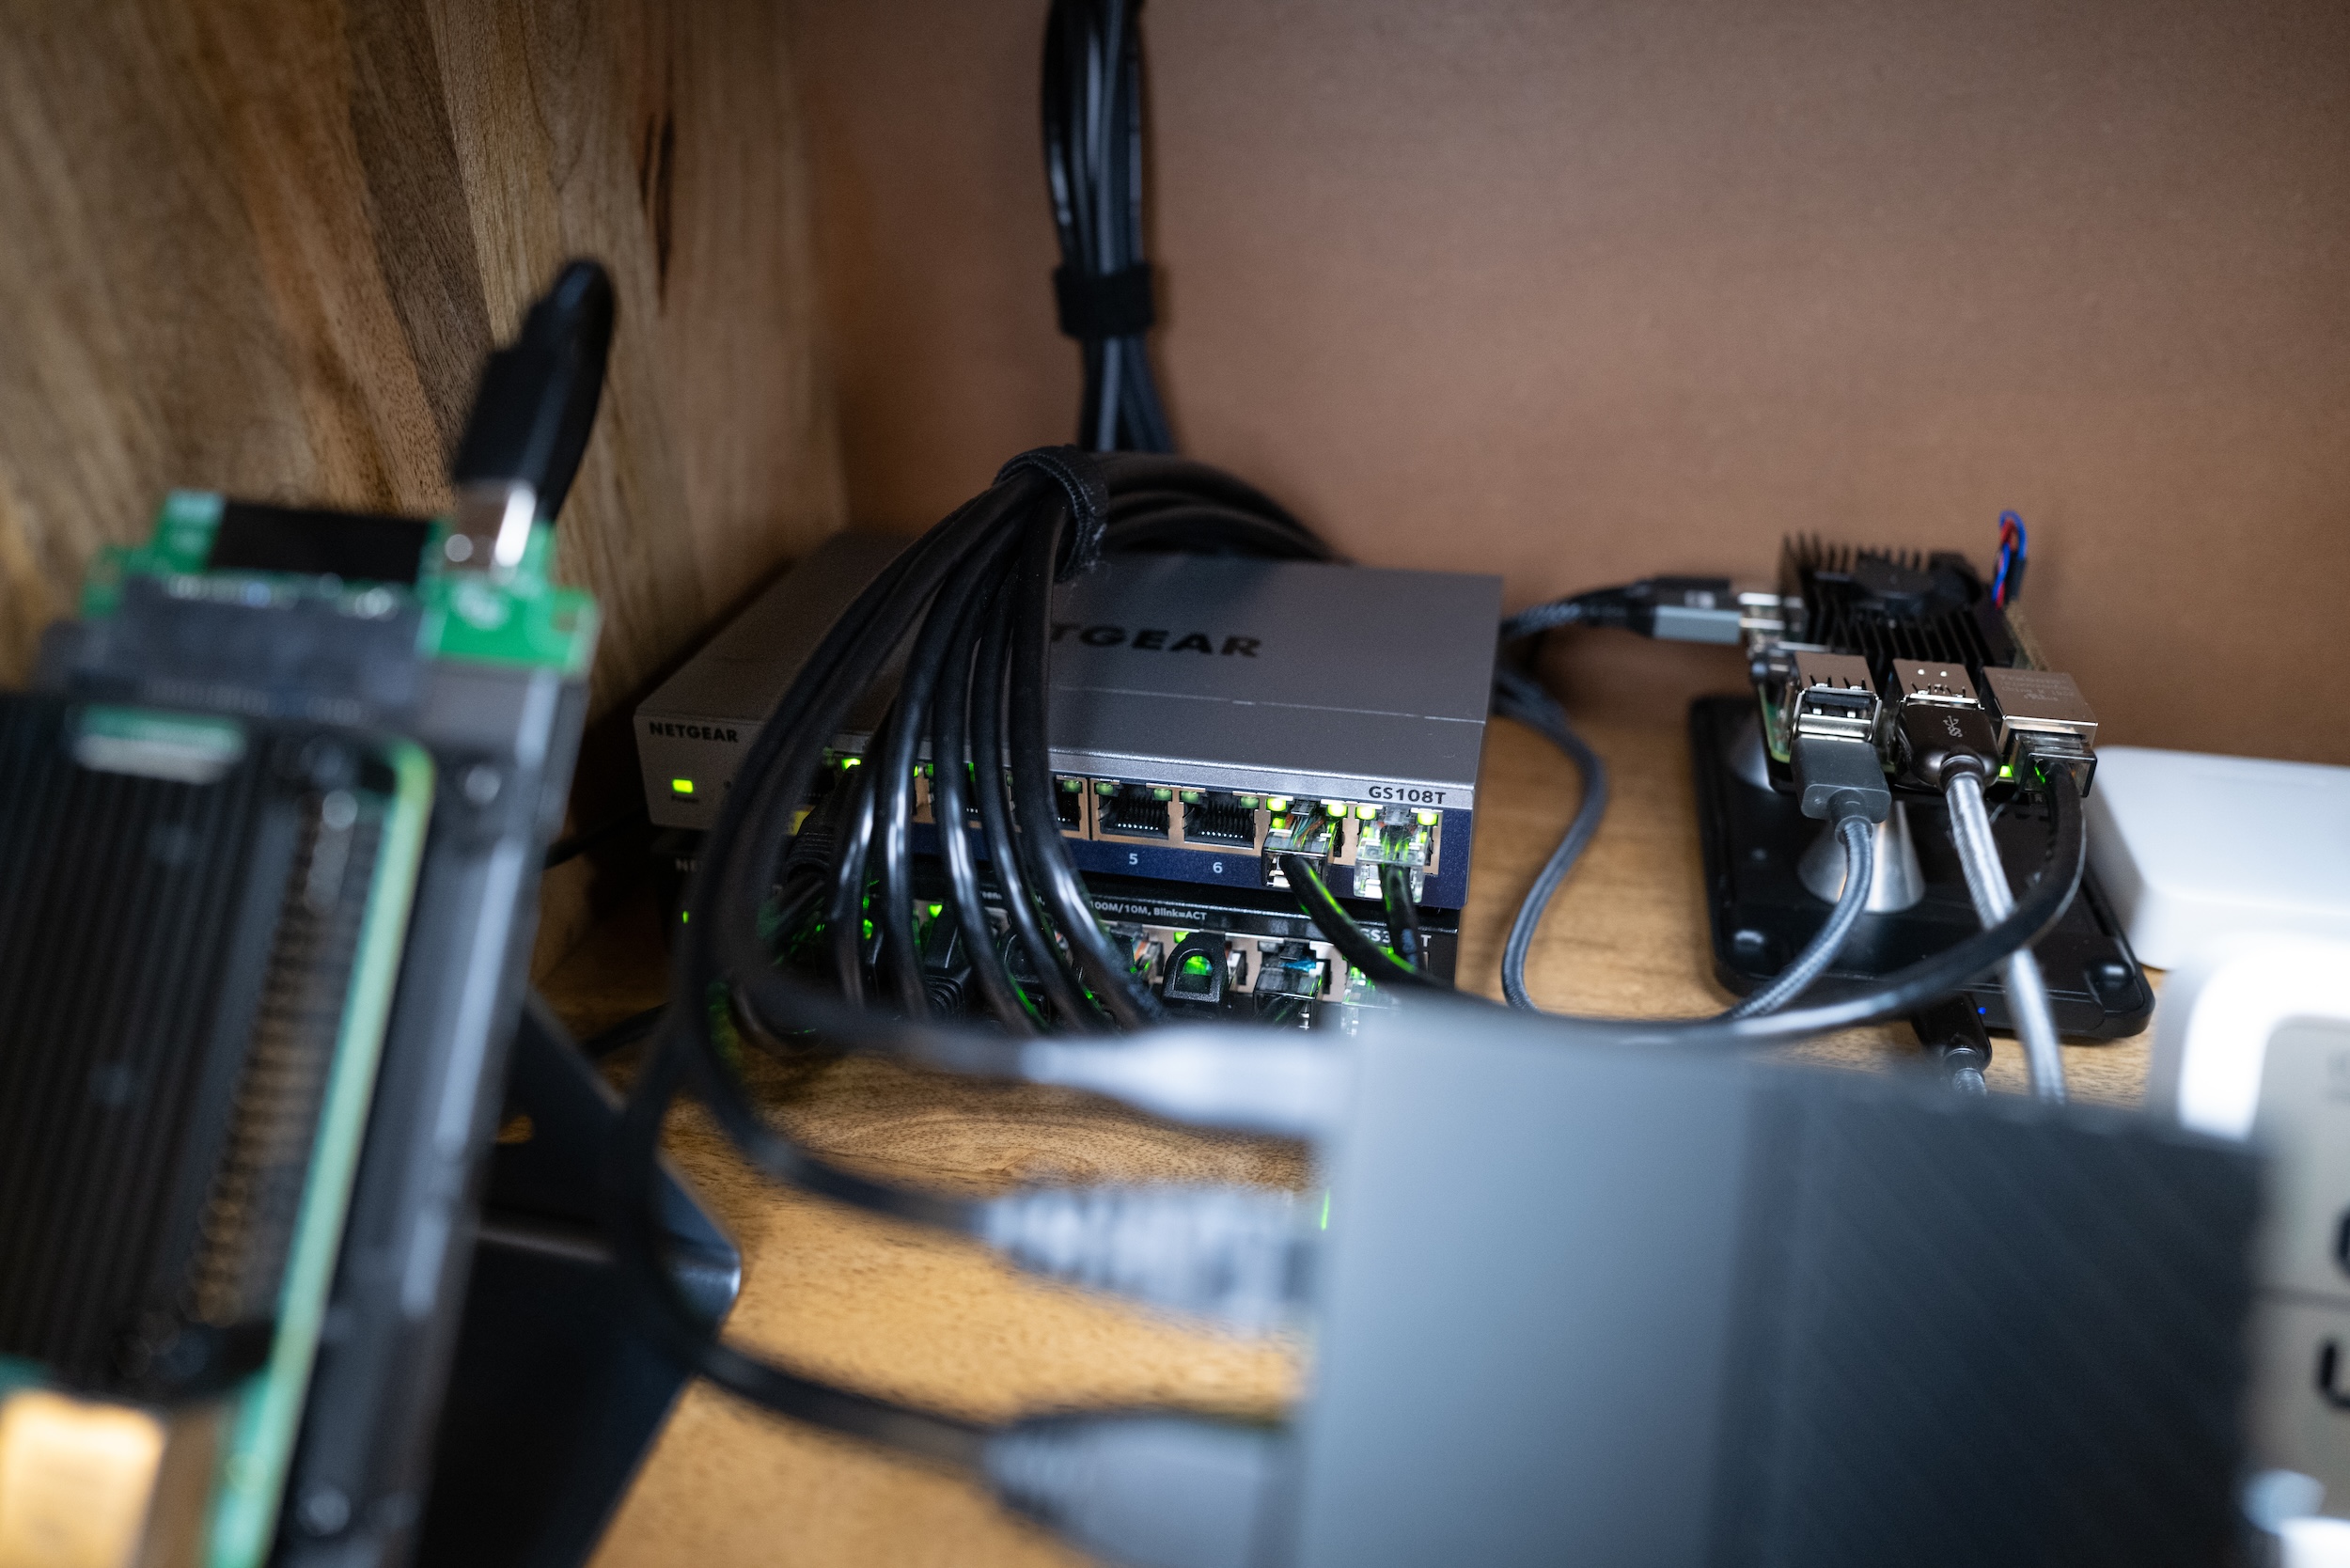
What can you do if there aren’t any available ports on your switch? Not much, except buy another one. Since my first switch is running OpenWrt, I looked for a second switch that could also run OpenWrt.
Unsurprisingly, I discovered that all OpenWrt-compatible switches are quite expensive due to their more complex hardware required to run OpenWrt, and my old switch (Netgear GS308Tv1) is no longer in production. Fortunately, I found a used Netgear GS108Tv3 on Amazon for €45. After purchasing it, I flashed OpenWrt onto it and now it’s also making charts into my Grafana dashboards.
Tip: both switches (GS108Tv3 and GS108Tv3) share the same hardware: Realtek RTL8380M CPU with 128MB RAM, and they consume approximately 8-10W each.
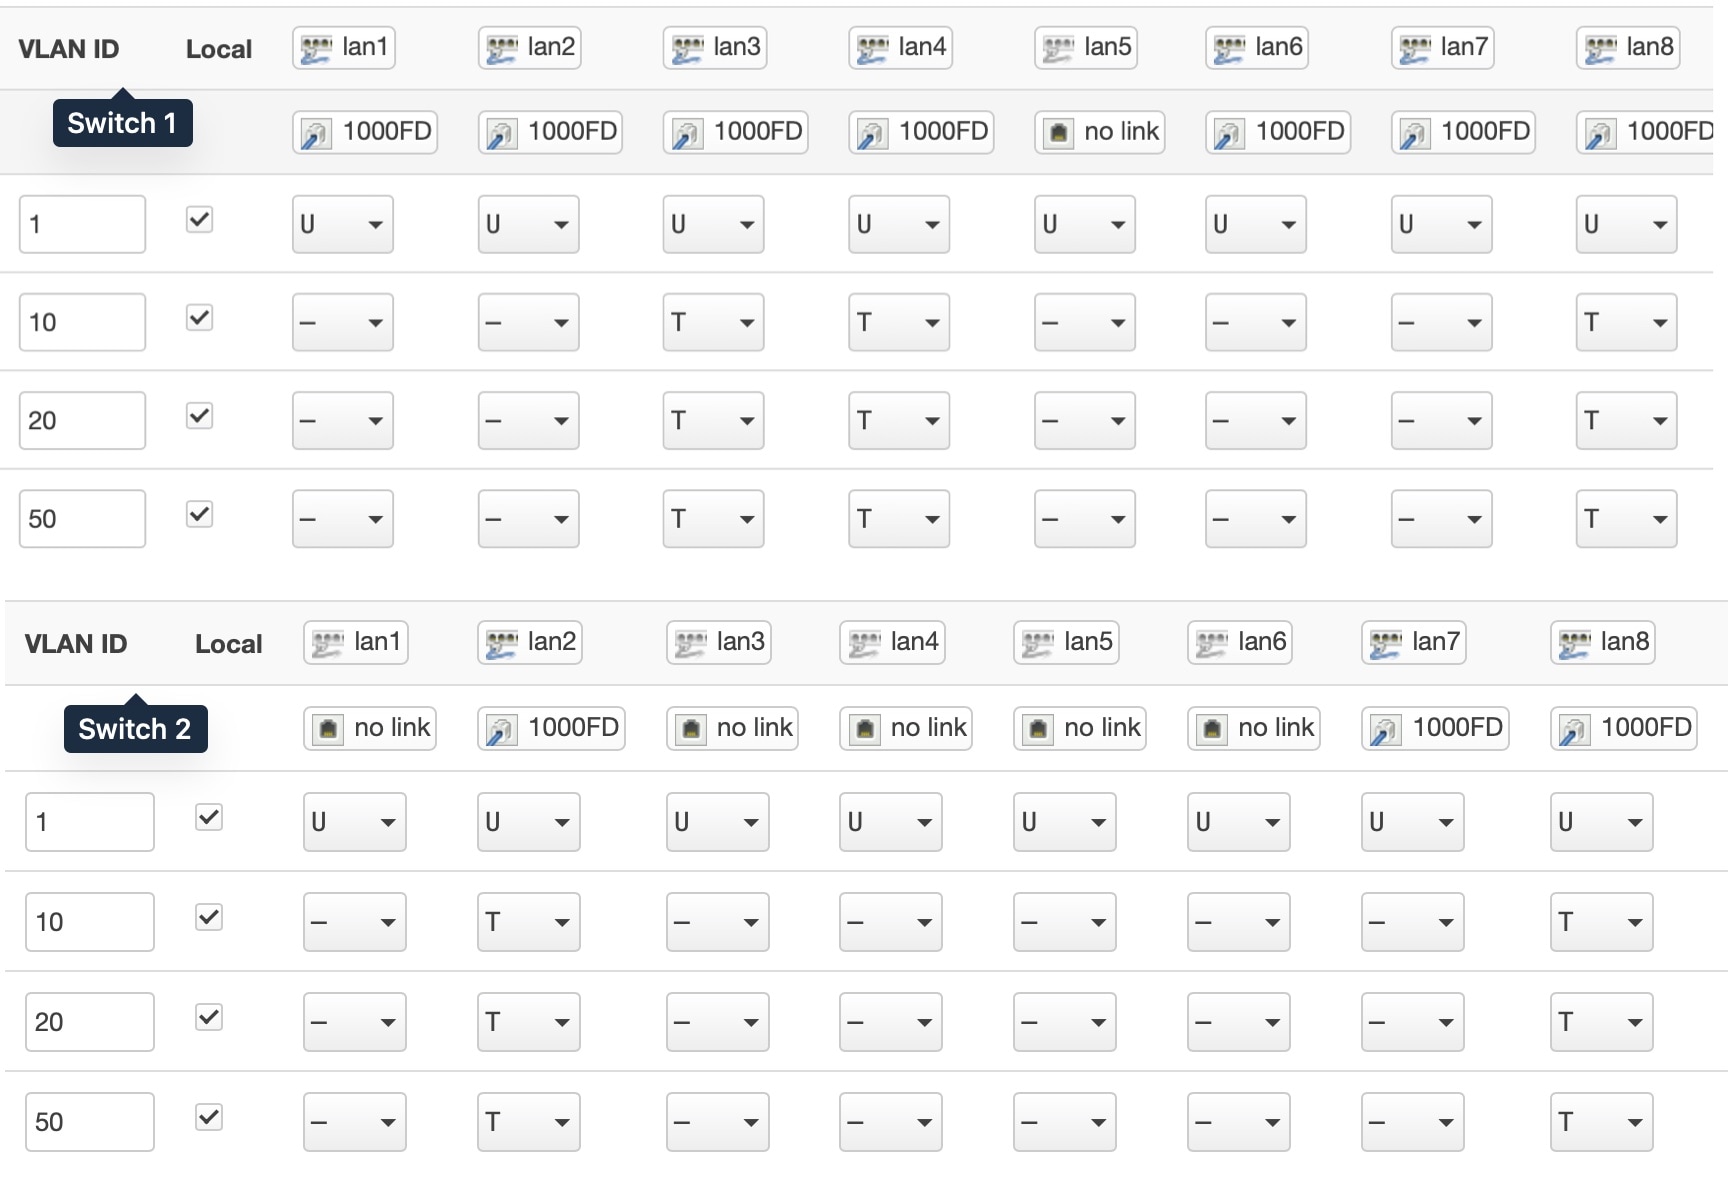
Configuration
Regarding the software, I named it ‘switch 2’ and connected the router to it via port 2, while I used port 8 as the link between the two switches.
I had to bring the tagged IoT and Guest VLANs from the router to the switch and then to the other switch. So, on the new switch, port 2 and port 8 have the default VLAN untagged, and both the IoT and Guest VLANs tagged on both ports. Simplifying, this:
Tip: to be honest, after I made these changes, my IoT devices were all offline and I was going crazy trying to understand why. After an hour of thinking about what errors I could have made, without success, I simply rebooted the switch, and then it worked. Usually, when you edit the VLANs configuration, a reload of the network interfaces is sufficient and you don’t have to reboot the device… anyway, didn’t want to investigate; I opted for the “it just works” approach.
External SSD for Pi-Hole
I started to always stay connected to my Pi-Hole for DNS, even when I’m away from home, using WireGuard’s ‘Enable On-Demand’ feature and split tunneling mode on my iPhone or MacBook.

So, in order to have something more reliable than the microSD, and because I had a spare 128GB SSD lying around, I cloned the microSD to the SSD (USB 3 of course).
…and no, I didn’t notice any speed improvement in the network, I did it just for the improved reliability of the SSD (and for faster system updates when using apt upgrade -y or pihole -up)
And the old iPad Air 2
After updating to Grafana 11, Safari on iPadOS 15.8 can no longer access the Grafana web view, so I’ve relegated the iPad Air 2 in the bathroom for viewing weather info, calendars, Bitcoin prices, and occasionally controlling a few Home accessories via the Homebridge web interface (which is still supported)
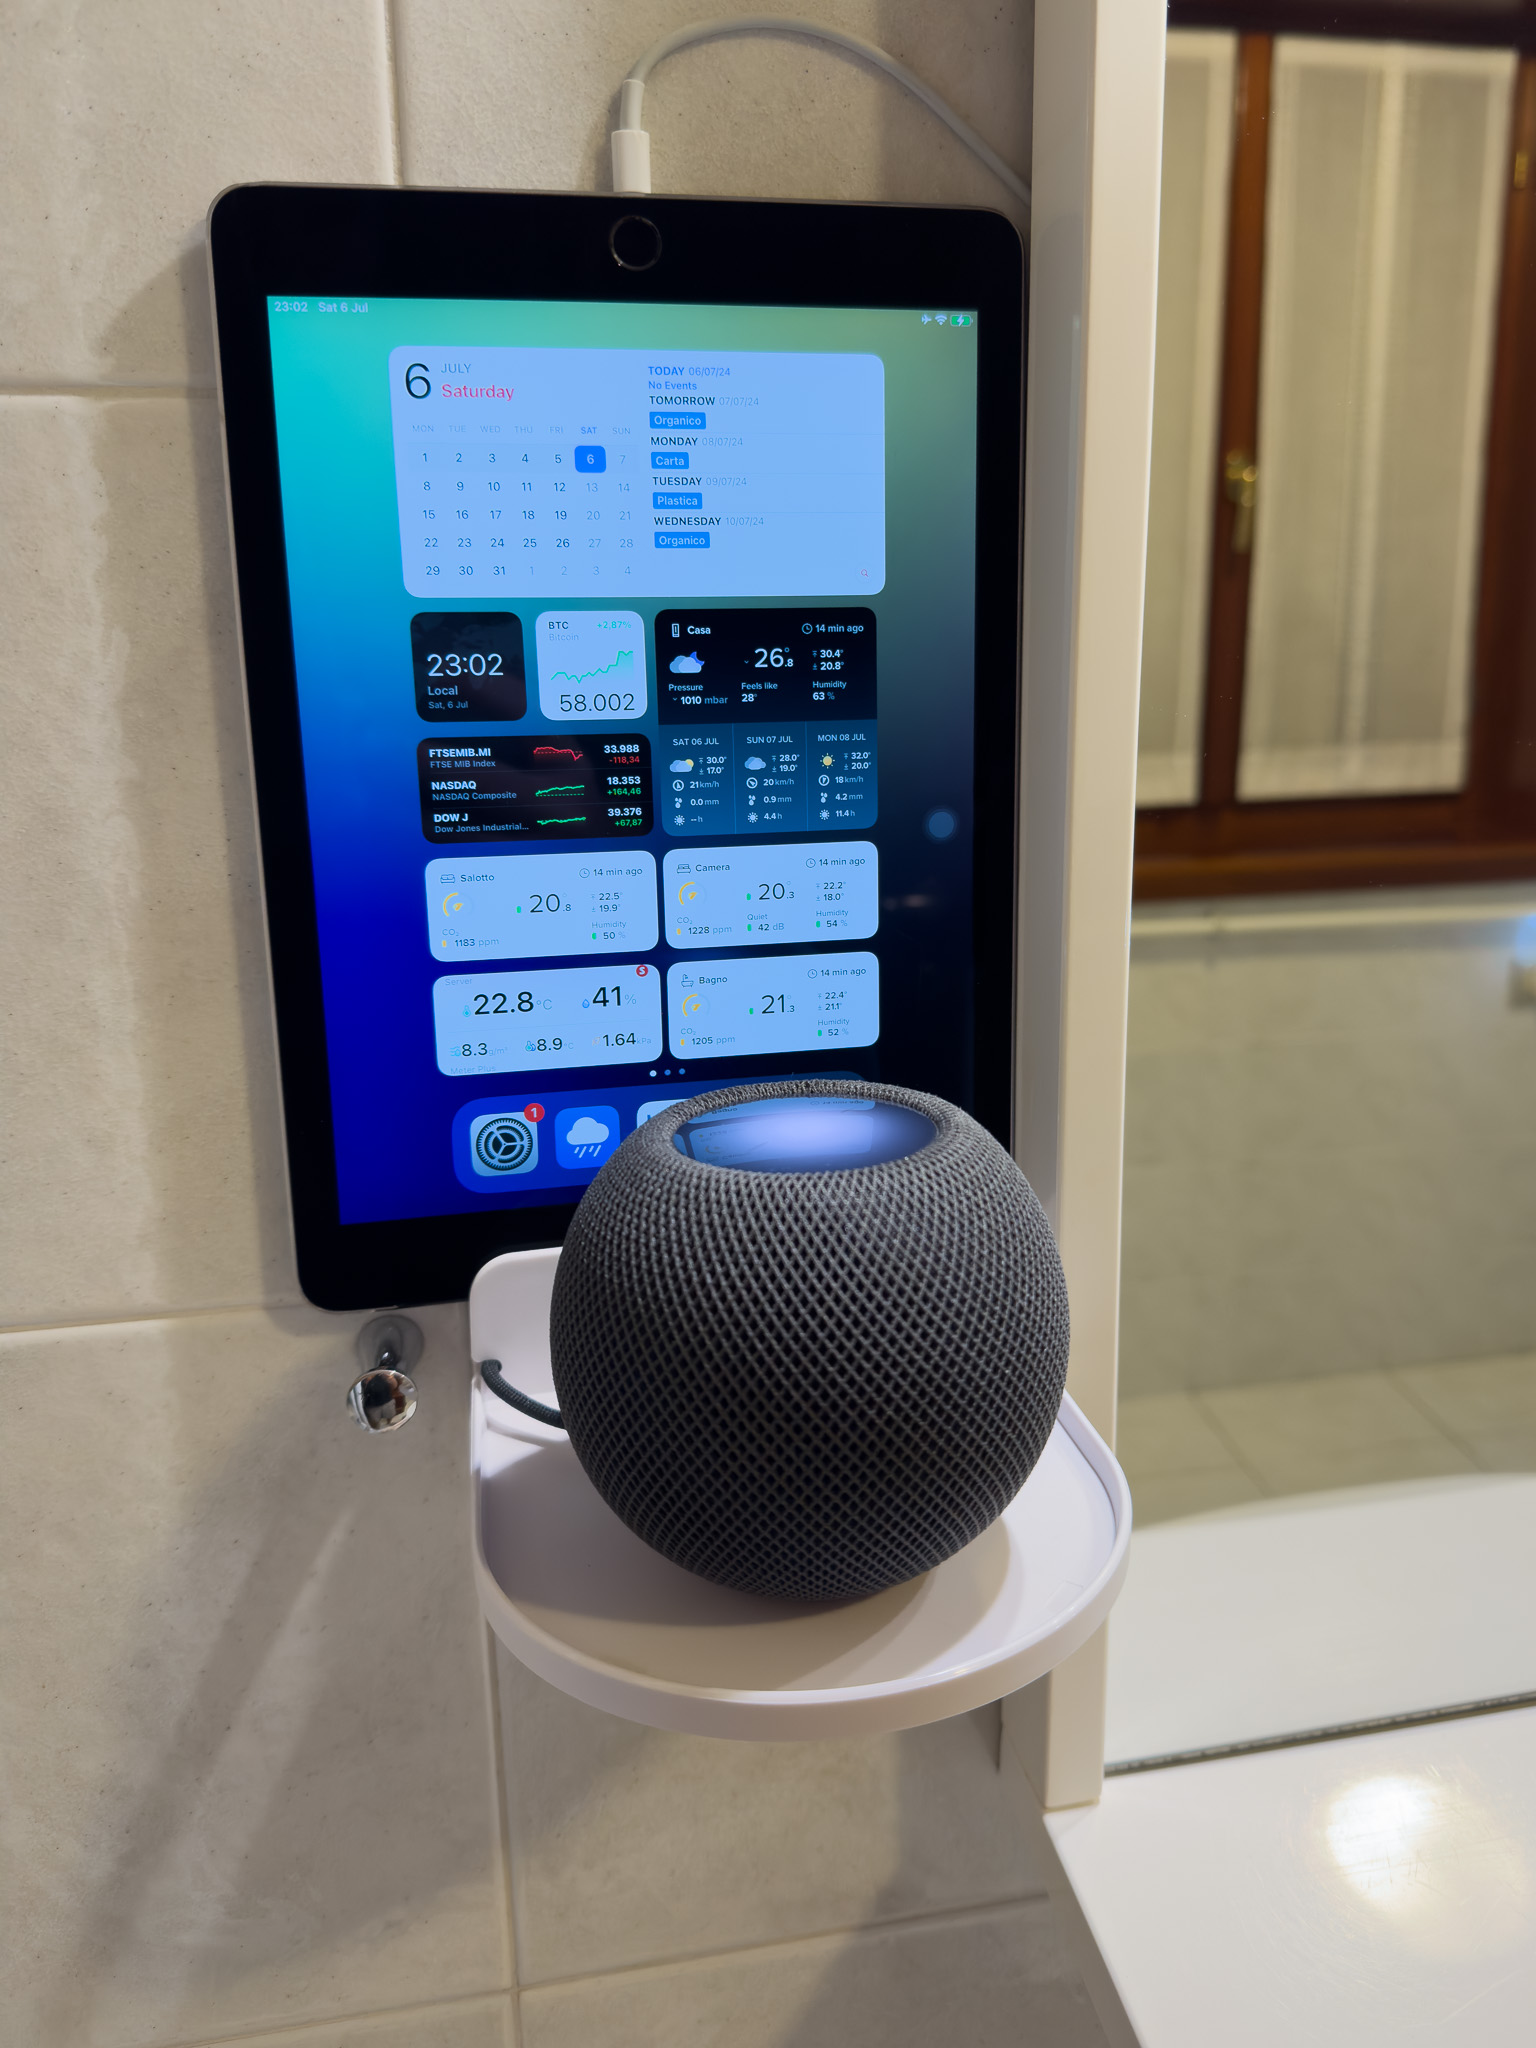
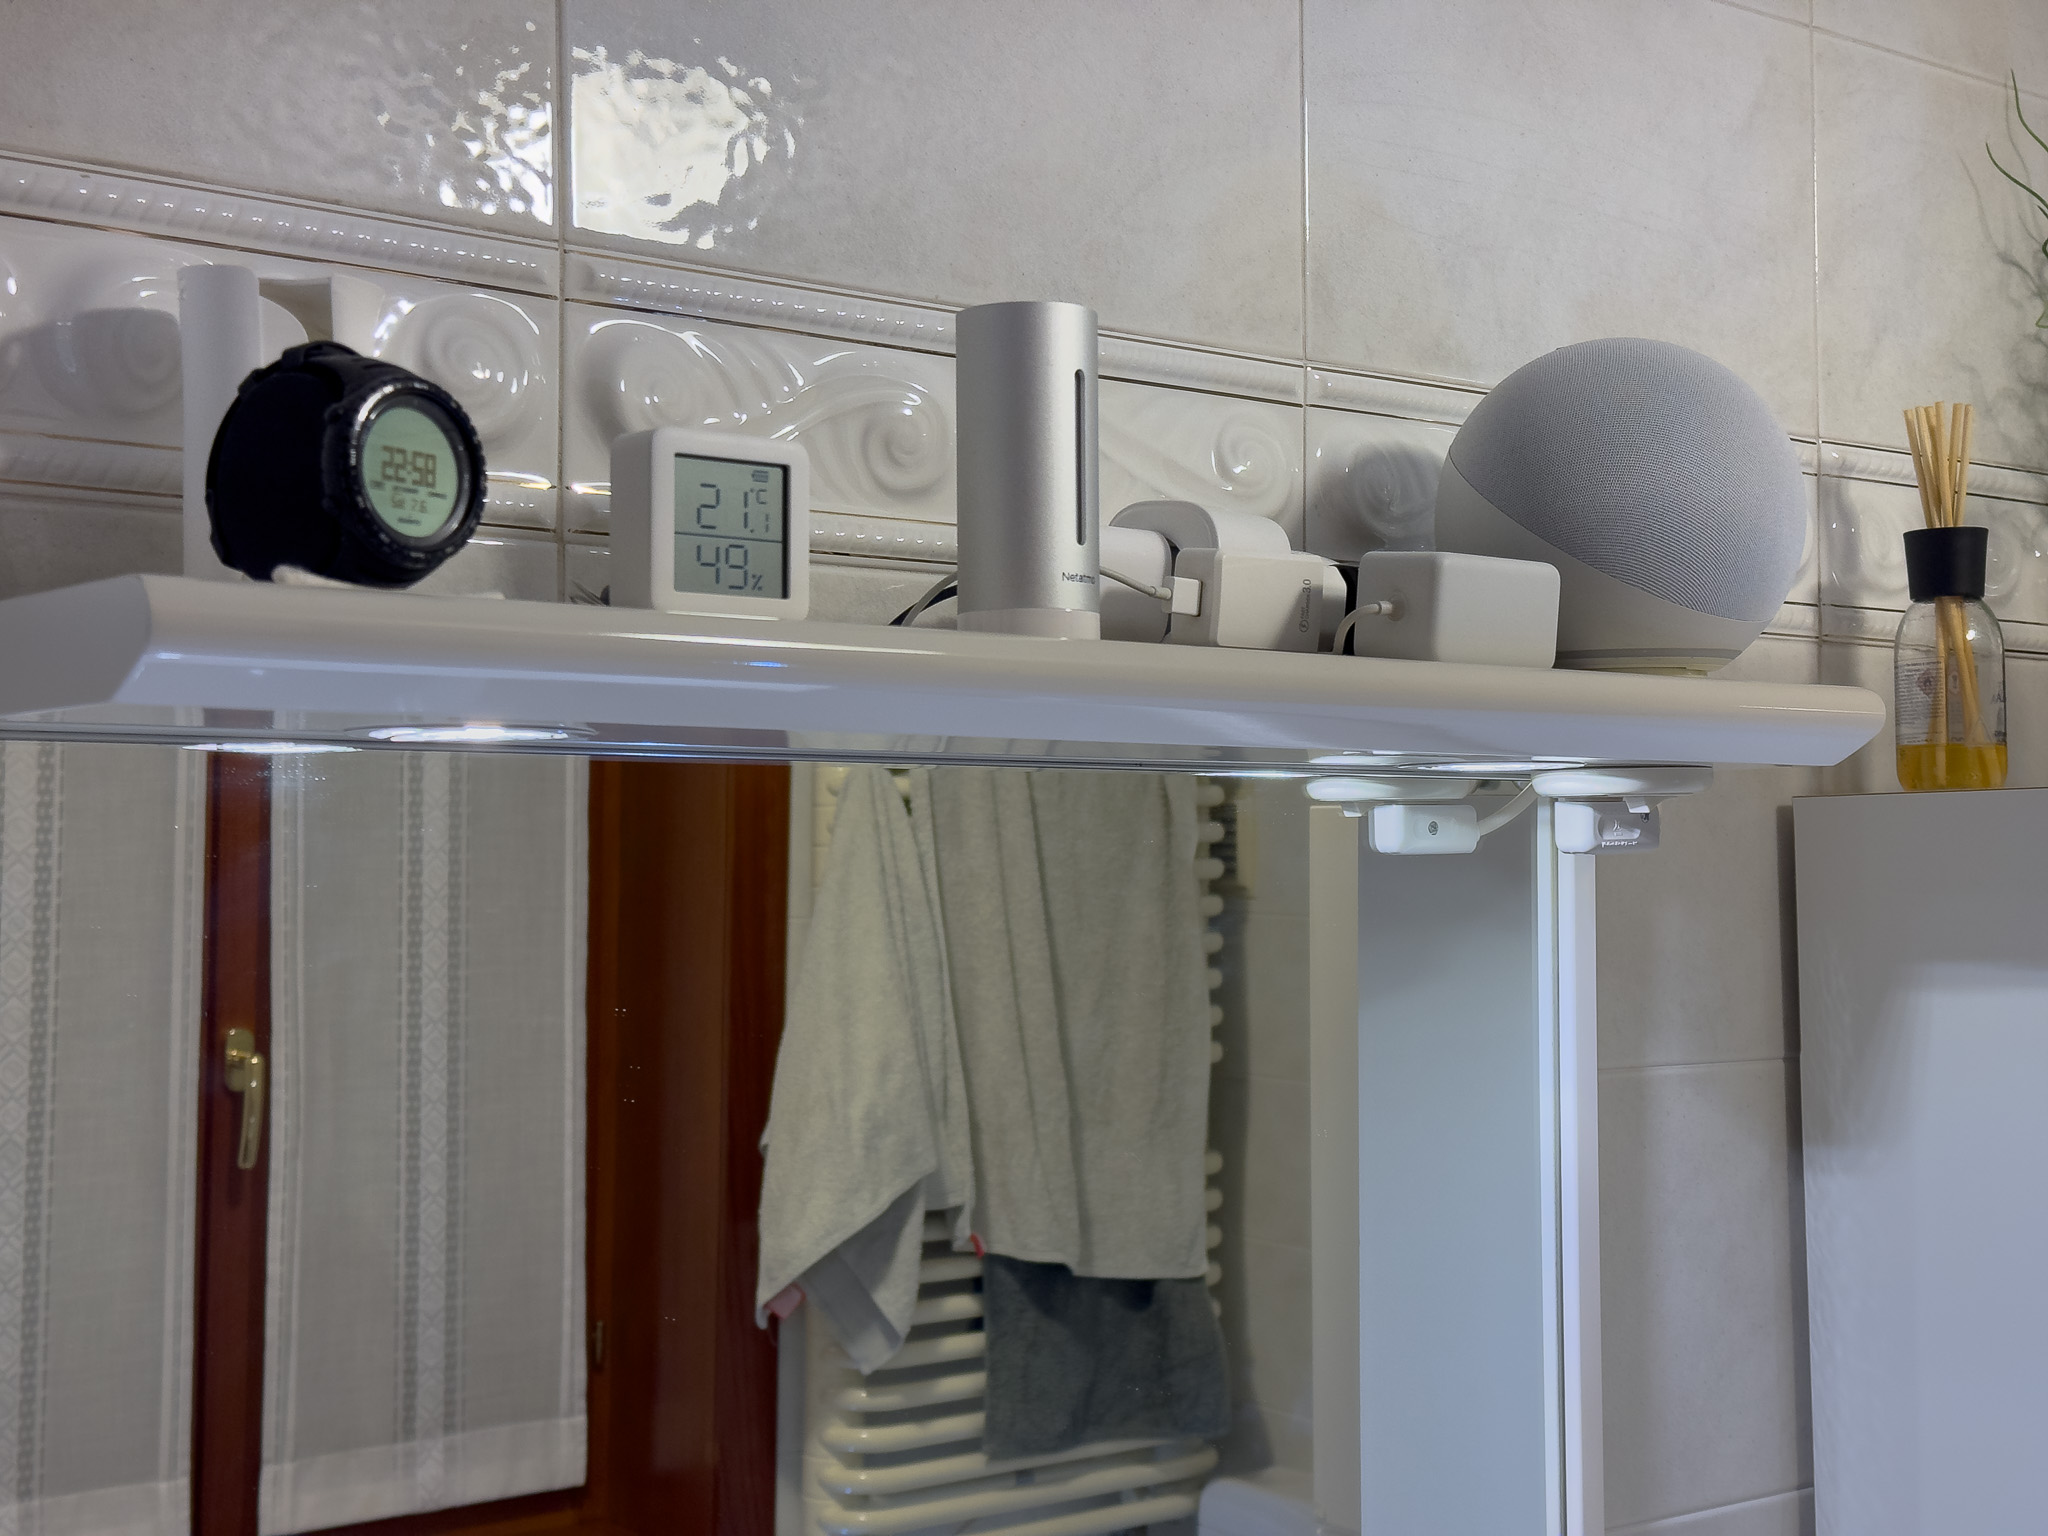
Oh, and there are a couple of other tech gadgets in the bathroom… probably this thing is getting out of hand :) But I found a Netatmo sensor on sale (at Amazon Warehouse) and bought it for the bathroom, where I was previously using a SwitchBot Meter (see the photo). The main reason was to have a CO2 sensor, and secondarily, to have all the “weather monitoring devices” in my home under the same brand.
Conclusion
To be honest, I’m not entirely sure what to write here, but including a “Conclusion” paragraph makes this post seem more substantial =]
Anyway, I want to clarify that these steps are documented briefly. I haven’t delved deeply into every detail, and there are some additional “intermediate/easy” steps I haven’t mentioned, so If you need more specific information about anything, feel free to ask in the comments or send me an email.
A curious information: I started to write this post on 22 May 2024 and finished/published on 7 July.