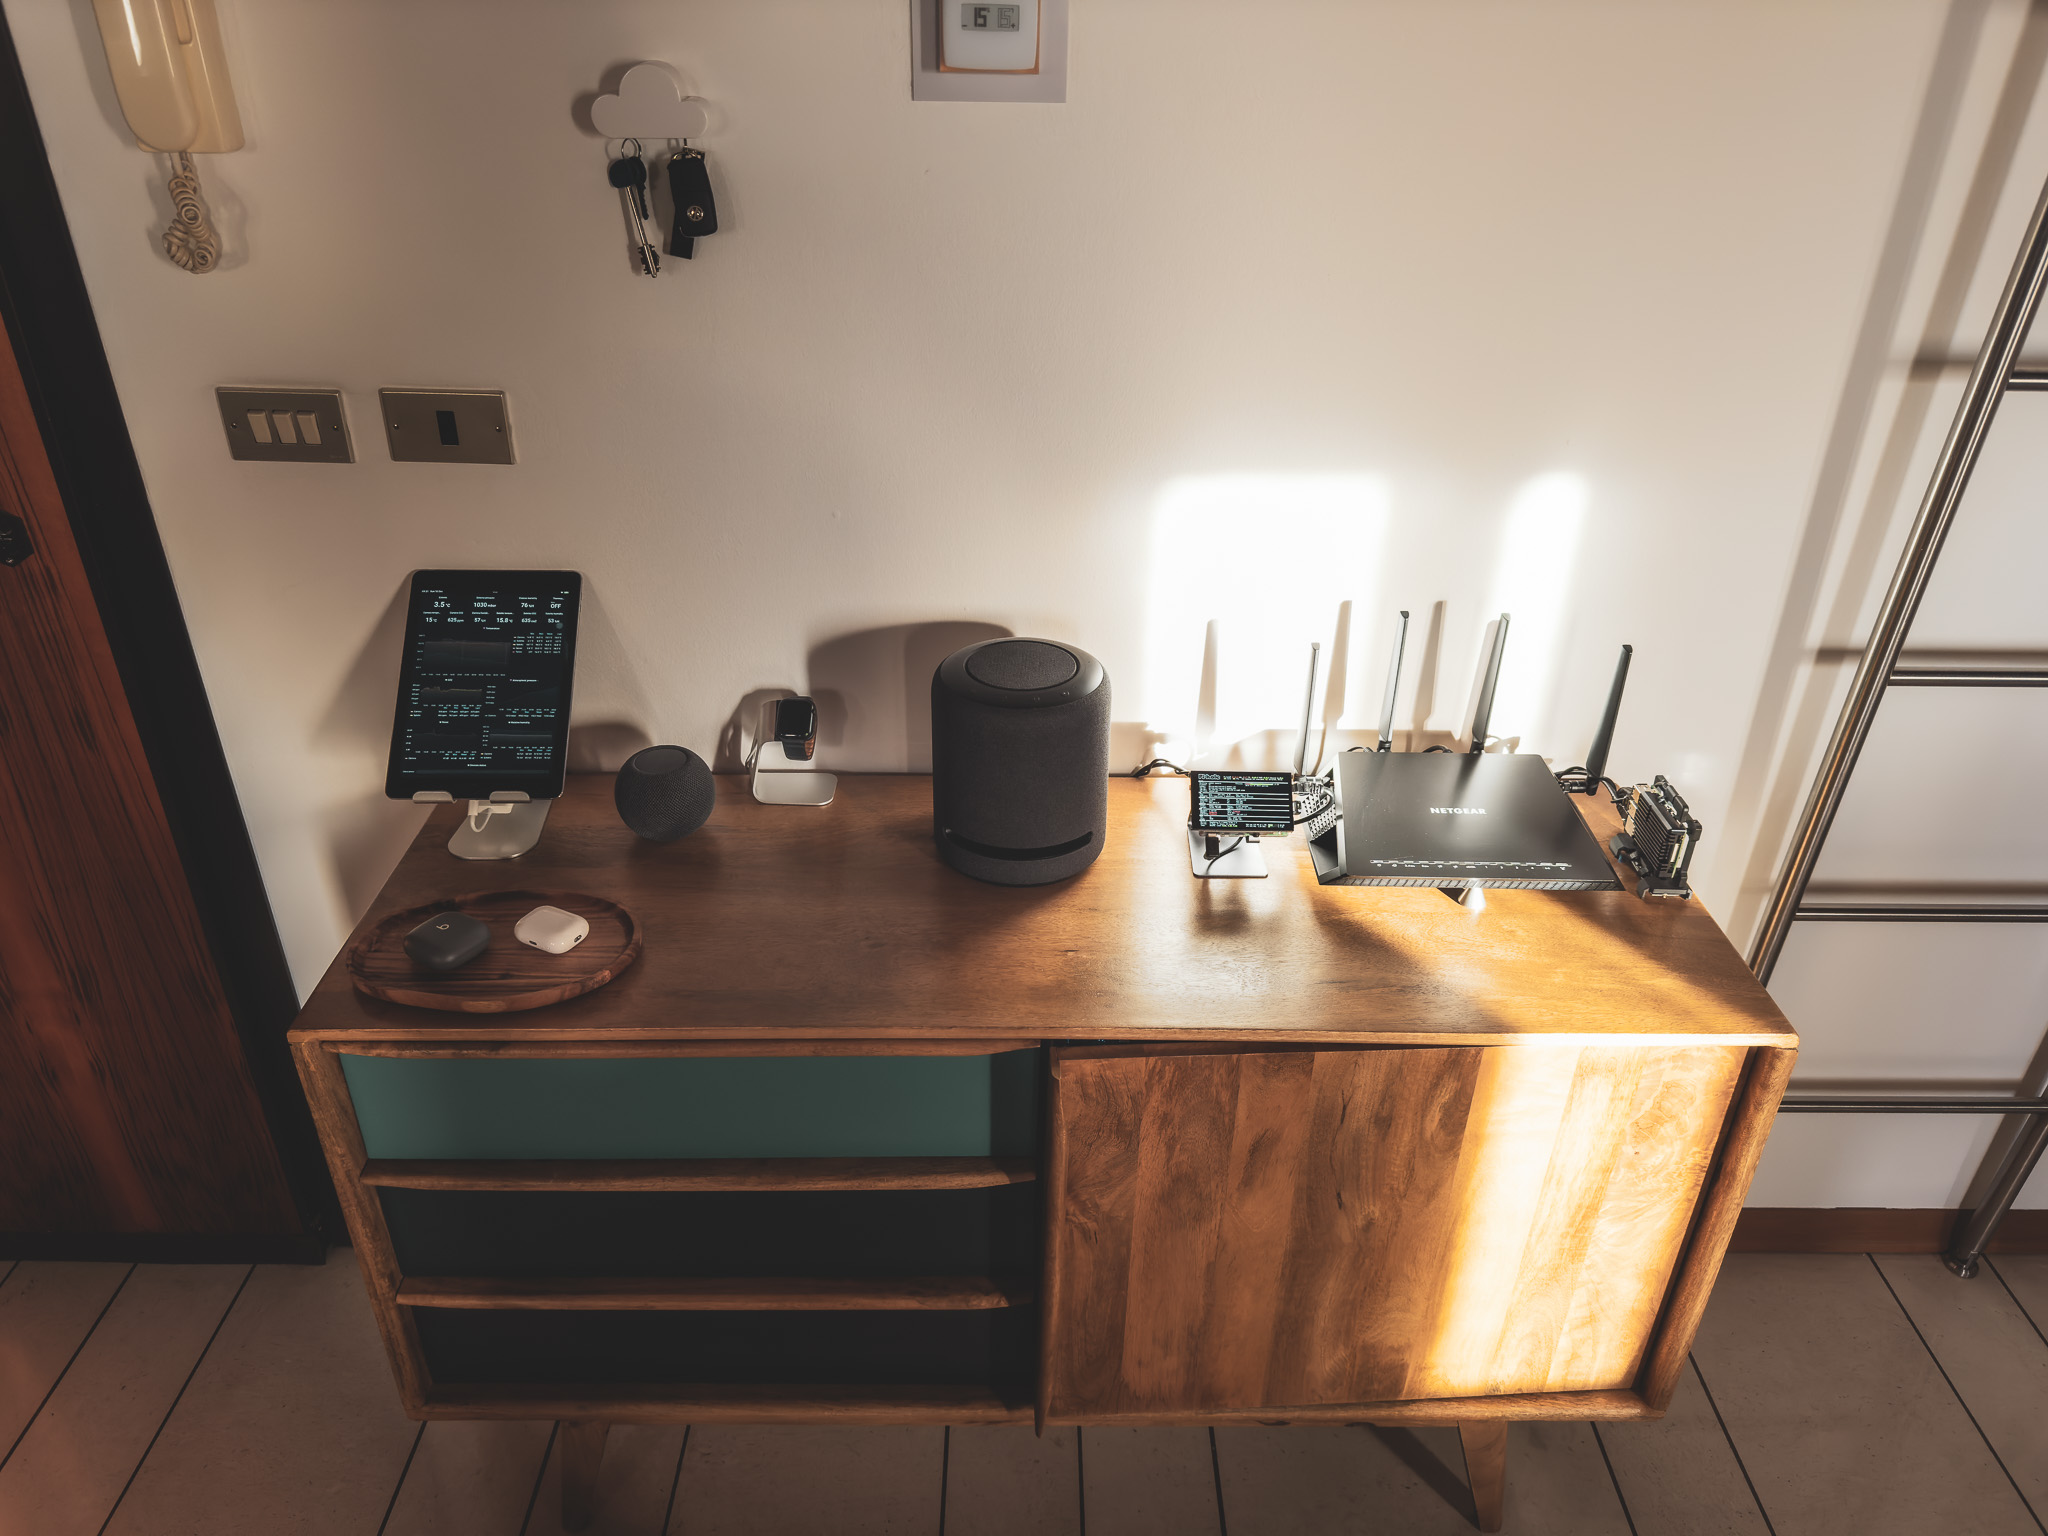
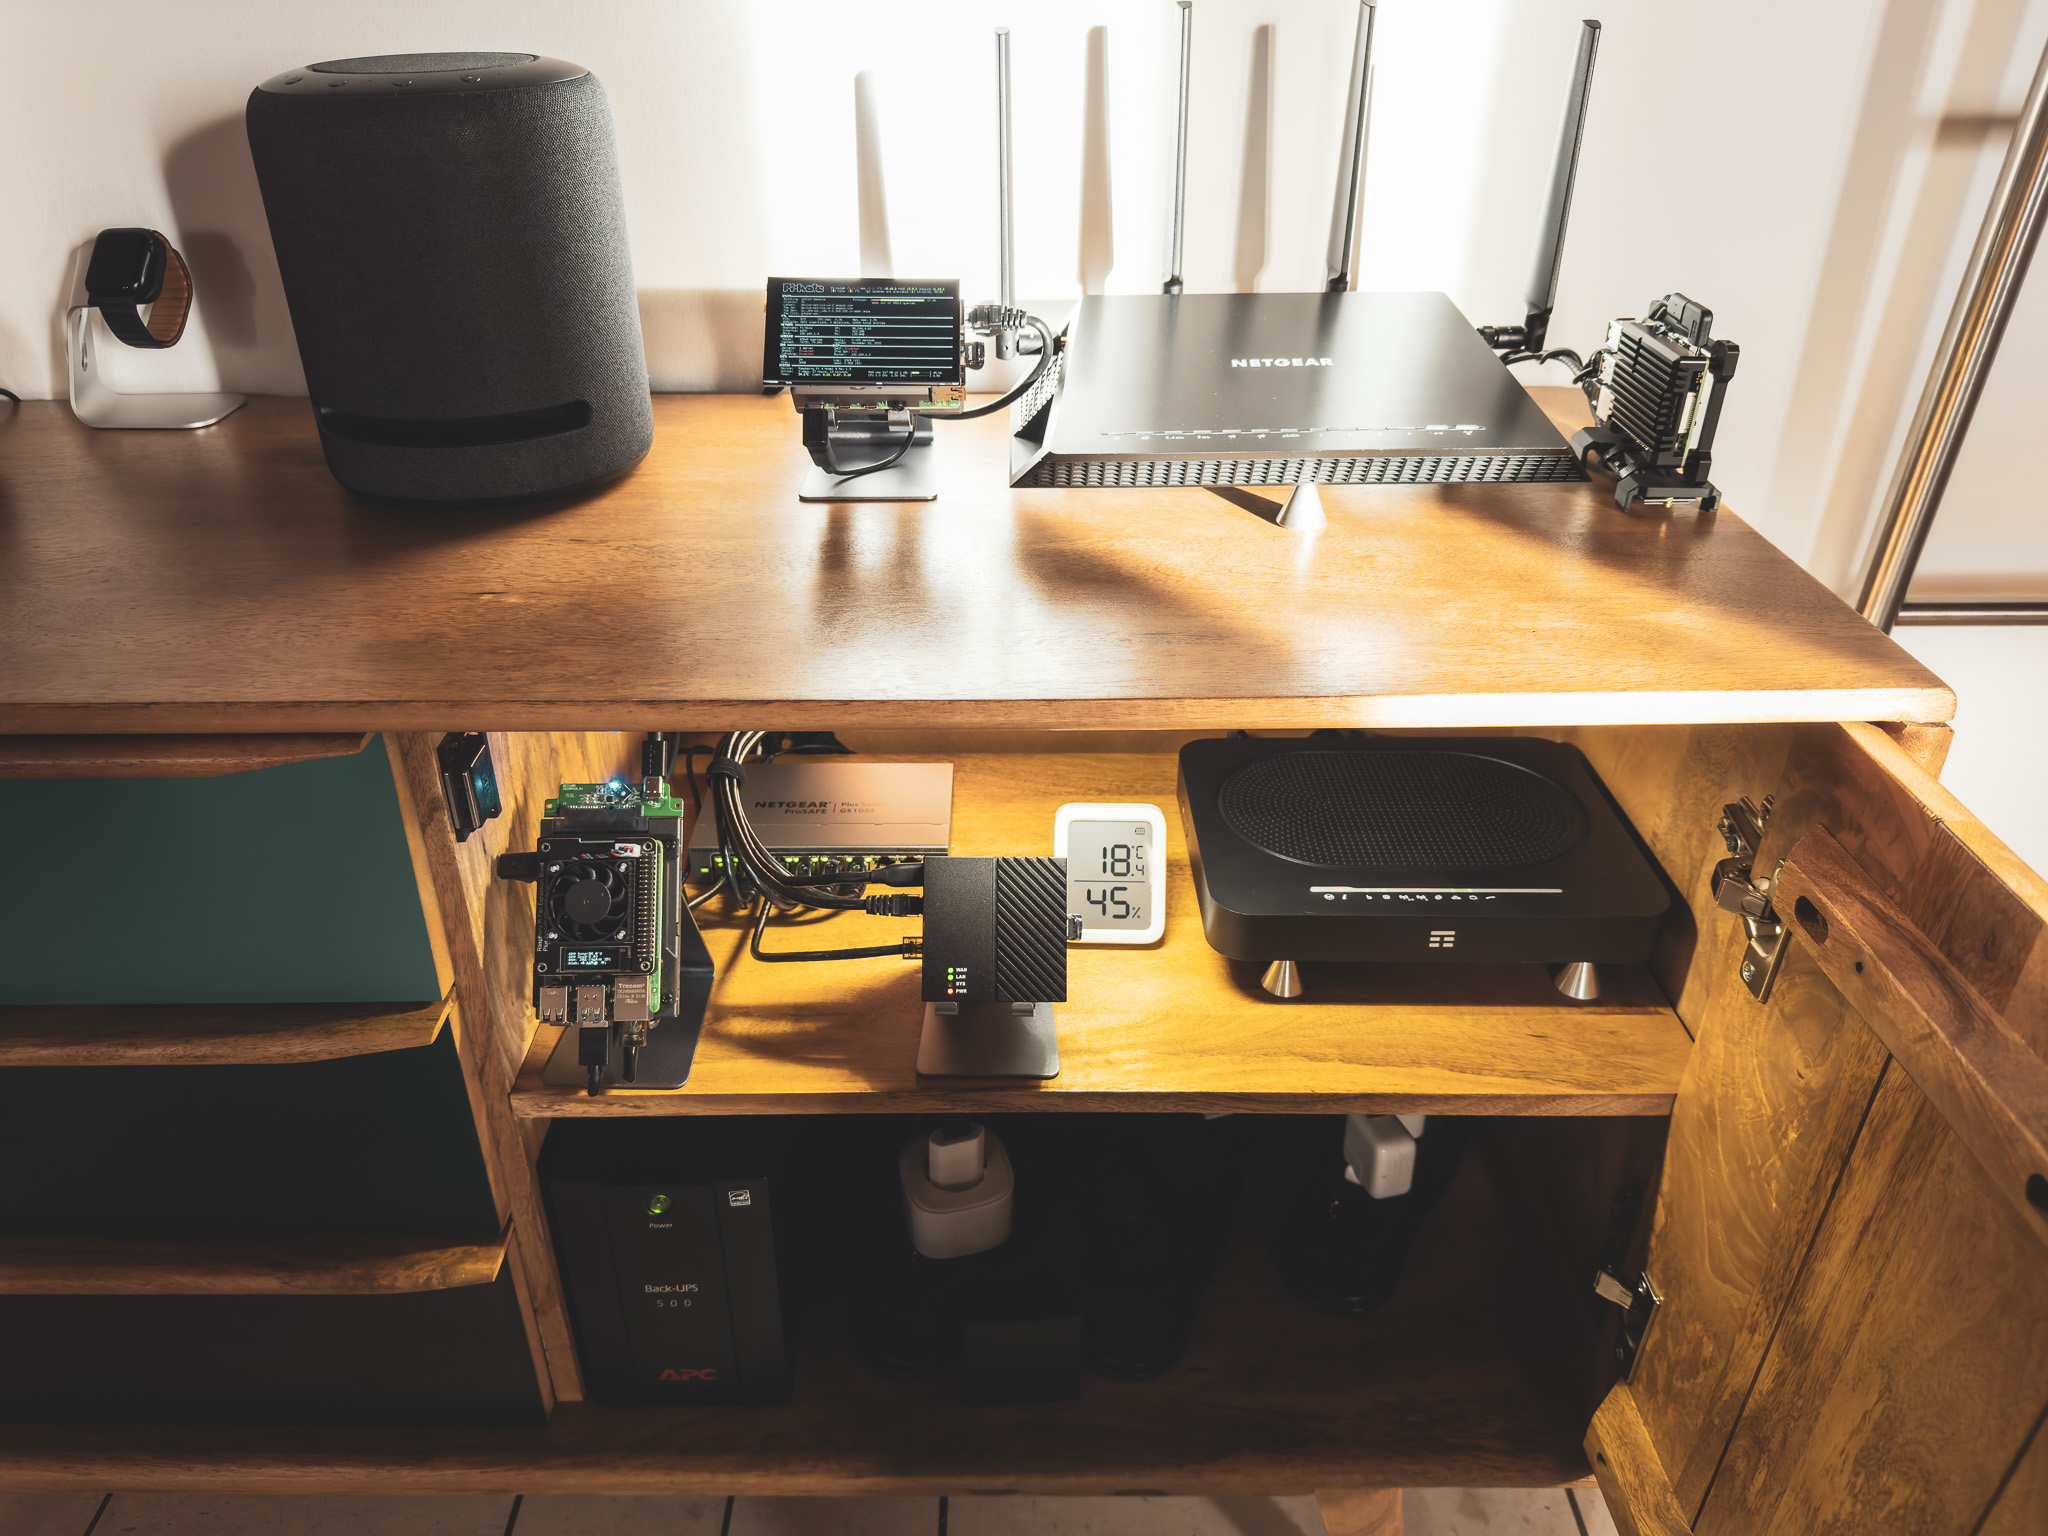
This project consists in a way to receive the stats of my Grafana dashboards (home network, Netatmo Weather Station/Thermostat, home consumption/Homebridge, Pi-Hole, servers, etc…) from my Grafana server delivered automatically to my inbox every time I want (usually daily and weekly).
I’ve made this project alongside the project to receive the push notifications with the critical info from my Grafana dashboards/environment: Some custom push notifications that improved my life
In this way I can make a little more use of the power of the Raspberry PIs 4 power in a useful way.
Why? Because the stats that Grafana builds are beautiful and they’re very useful if you give a glance at them regularly, in order to understand your habits and what is “the situation” in your environment. But after few weeks of hype, I totally forgot to see them. And this makes those beautiful dashboards, almost useless and interesting.
So I wanted to have these stats delivered to my mail as images, in order to give them a periodical glance. And if I have only to open a mail to see the dashboards, I can do without forgot.
As always, before digging into the tools and informations, I want to show the results: These are the mails, with the dashboards, that I’m receiving in my inbox every time I want (usually daily or weekly), click to open:
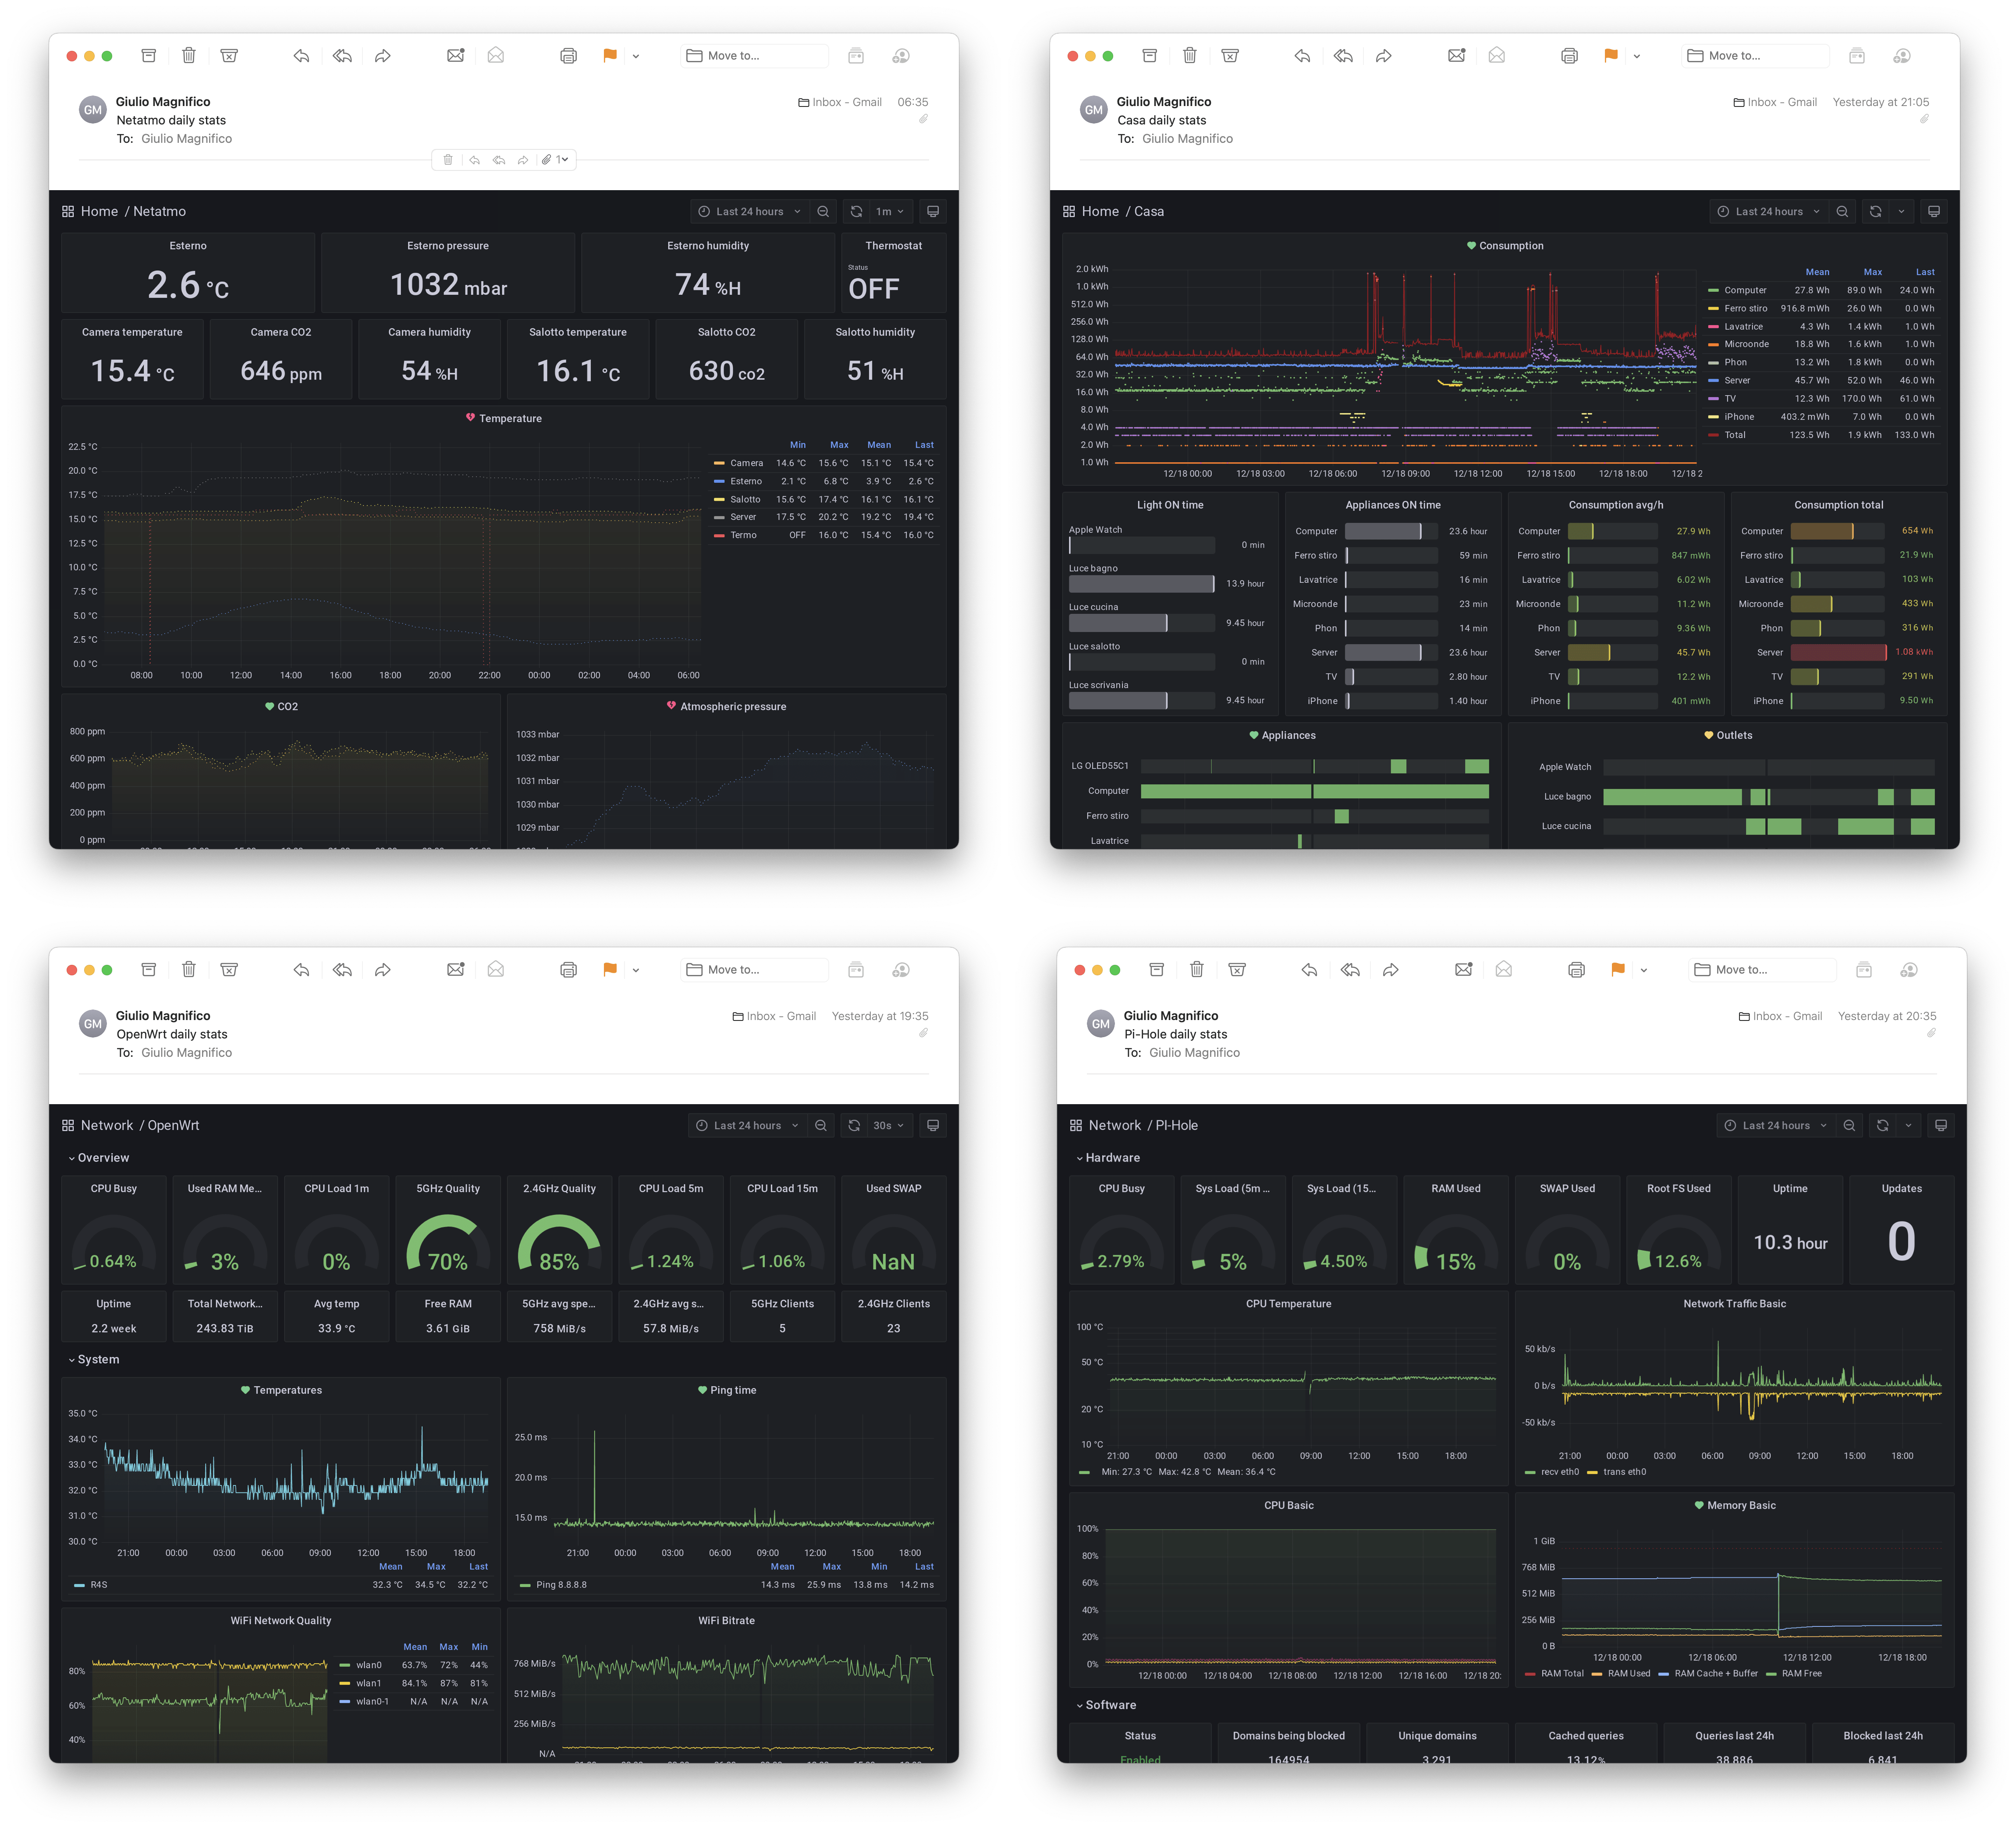
Usually I use this behaviour in order to -or not- open these emails: when I know that I have something to check, I open the mail and watch the dashboard. For example: one day I did a long washing machine with dryer, and I want to know the power it required, I watch it. I want to know the ping time over the day (I discovered that when is raining the ping is slower, uh, funny), or I want to know the trend for the atmospheric pressure, etc… otherwise I directly delete them without even open the mails.
Requirements
The plug-in: Grafana-image-render by Grafana
A Grafana backend plugin that handles rendering of panels & dashboards to PNGs using headless browser
And some Unix stuff: sSMTP and mailutils to send the PNGs via mail, plus cron and curl to automatically extract and send the PNGs
Hardware: I’m running the Grafana instance on a RaspberryPI 4B with 4GB using a spare external SSD as storage (256GB) and DietPI as OS.
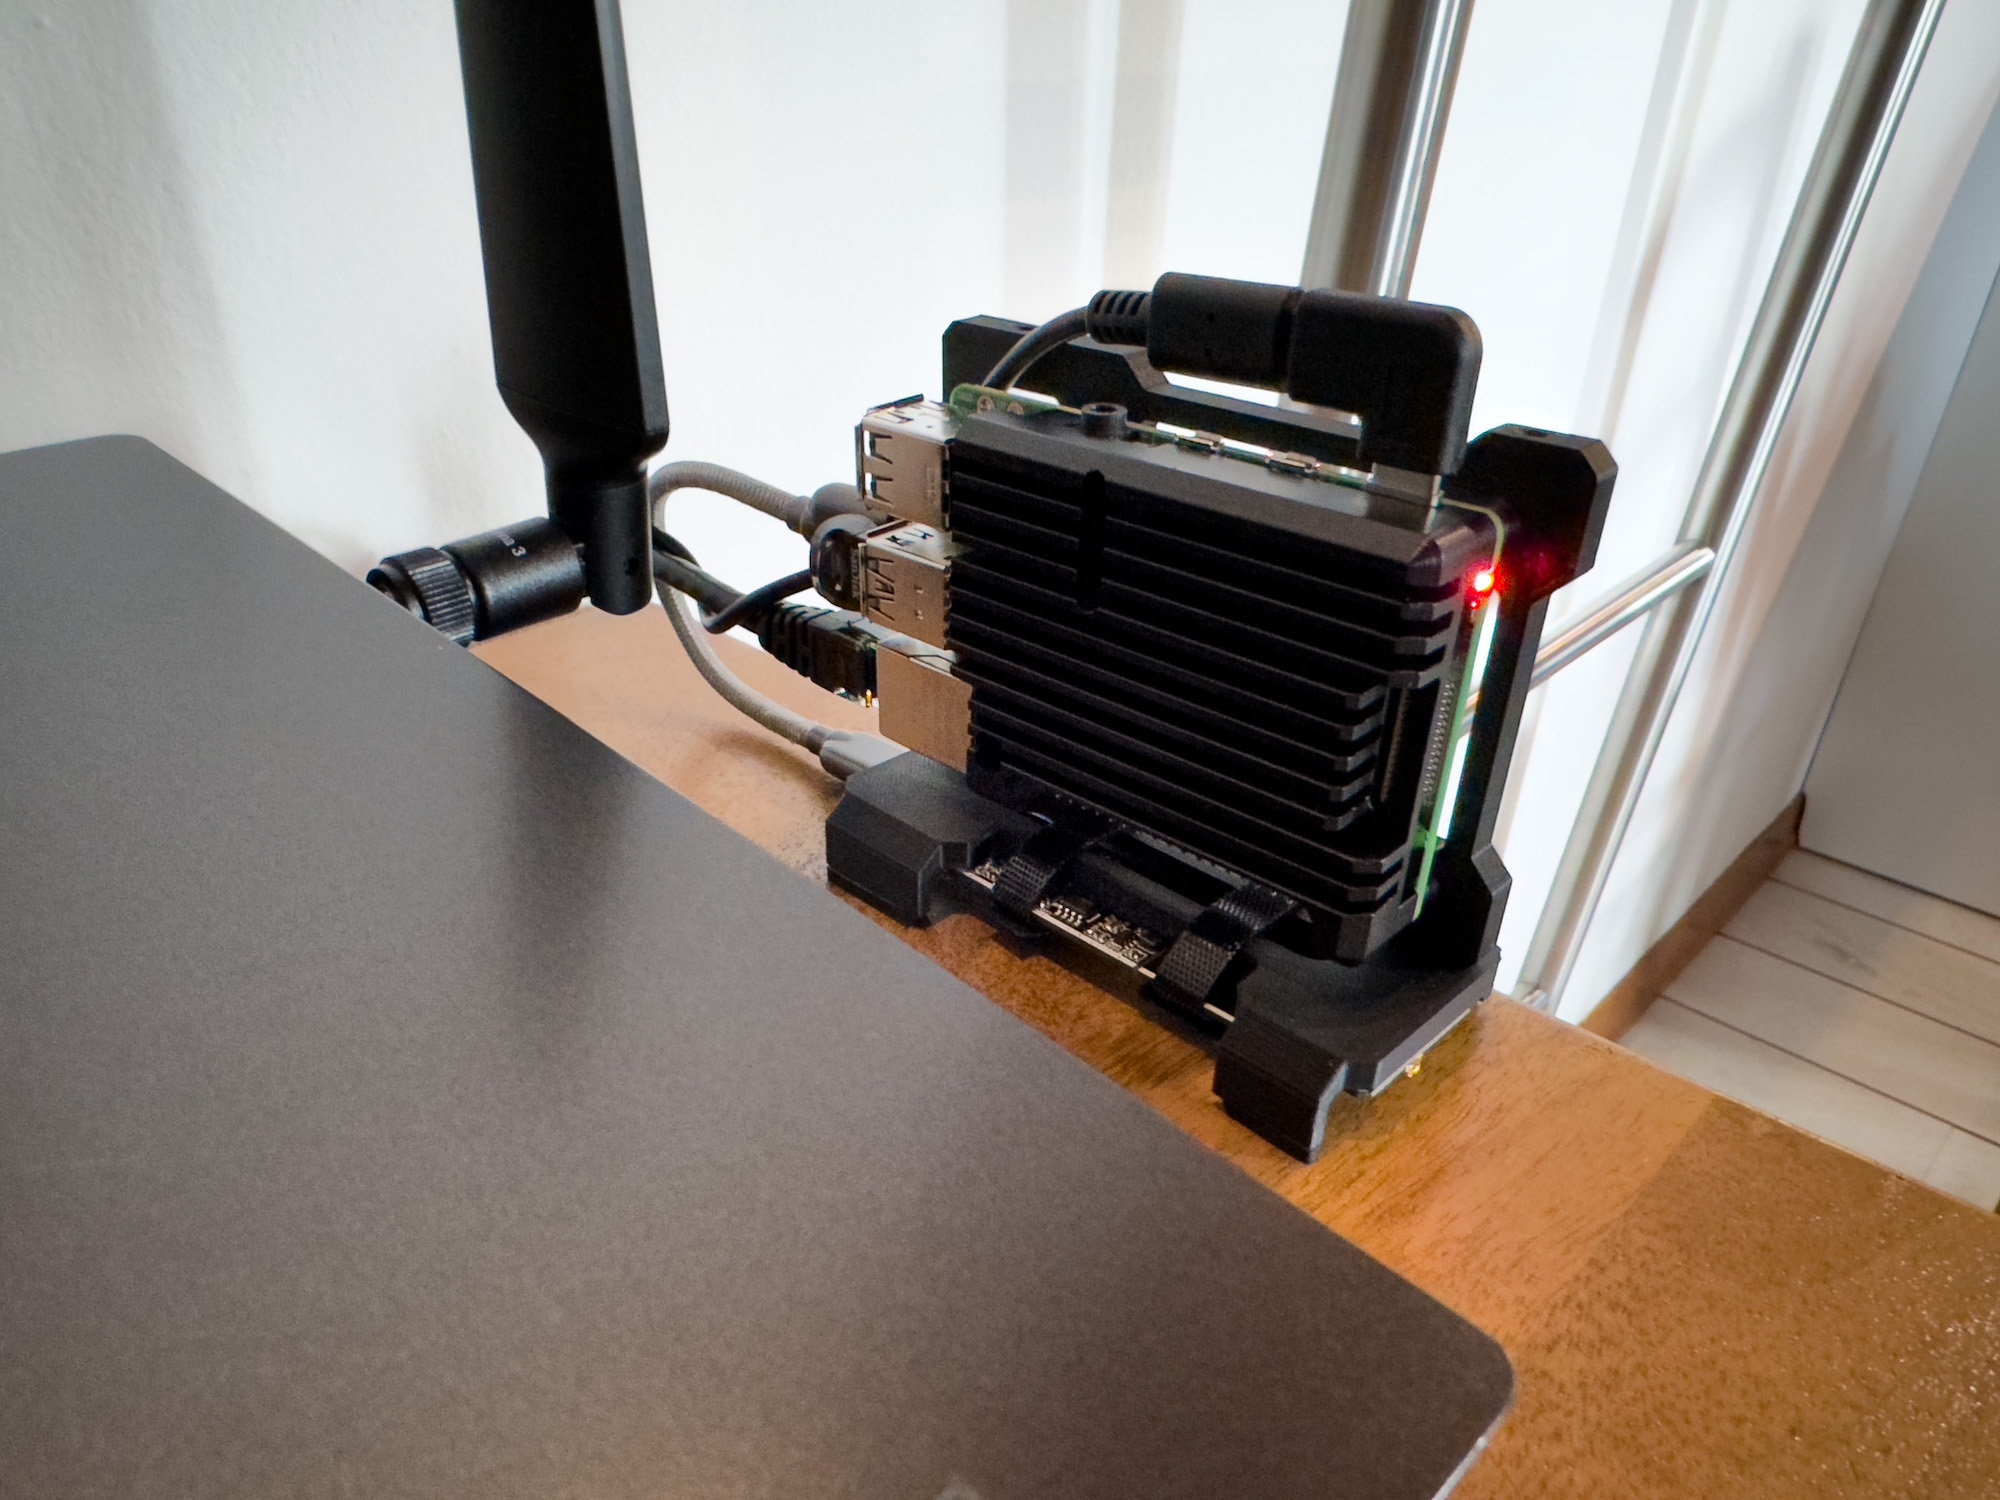
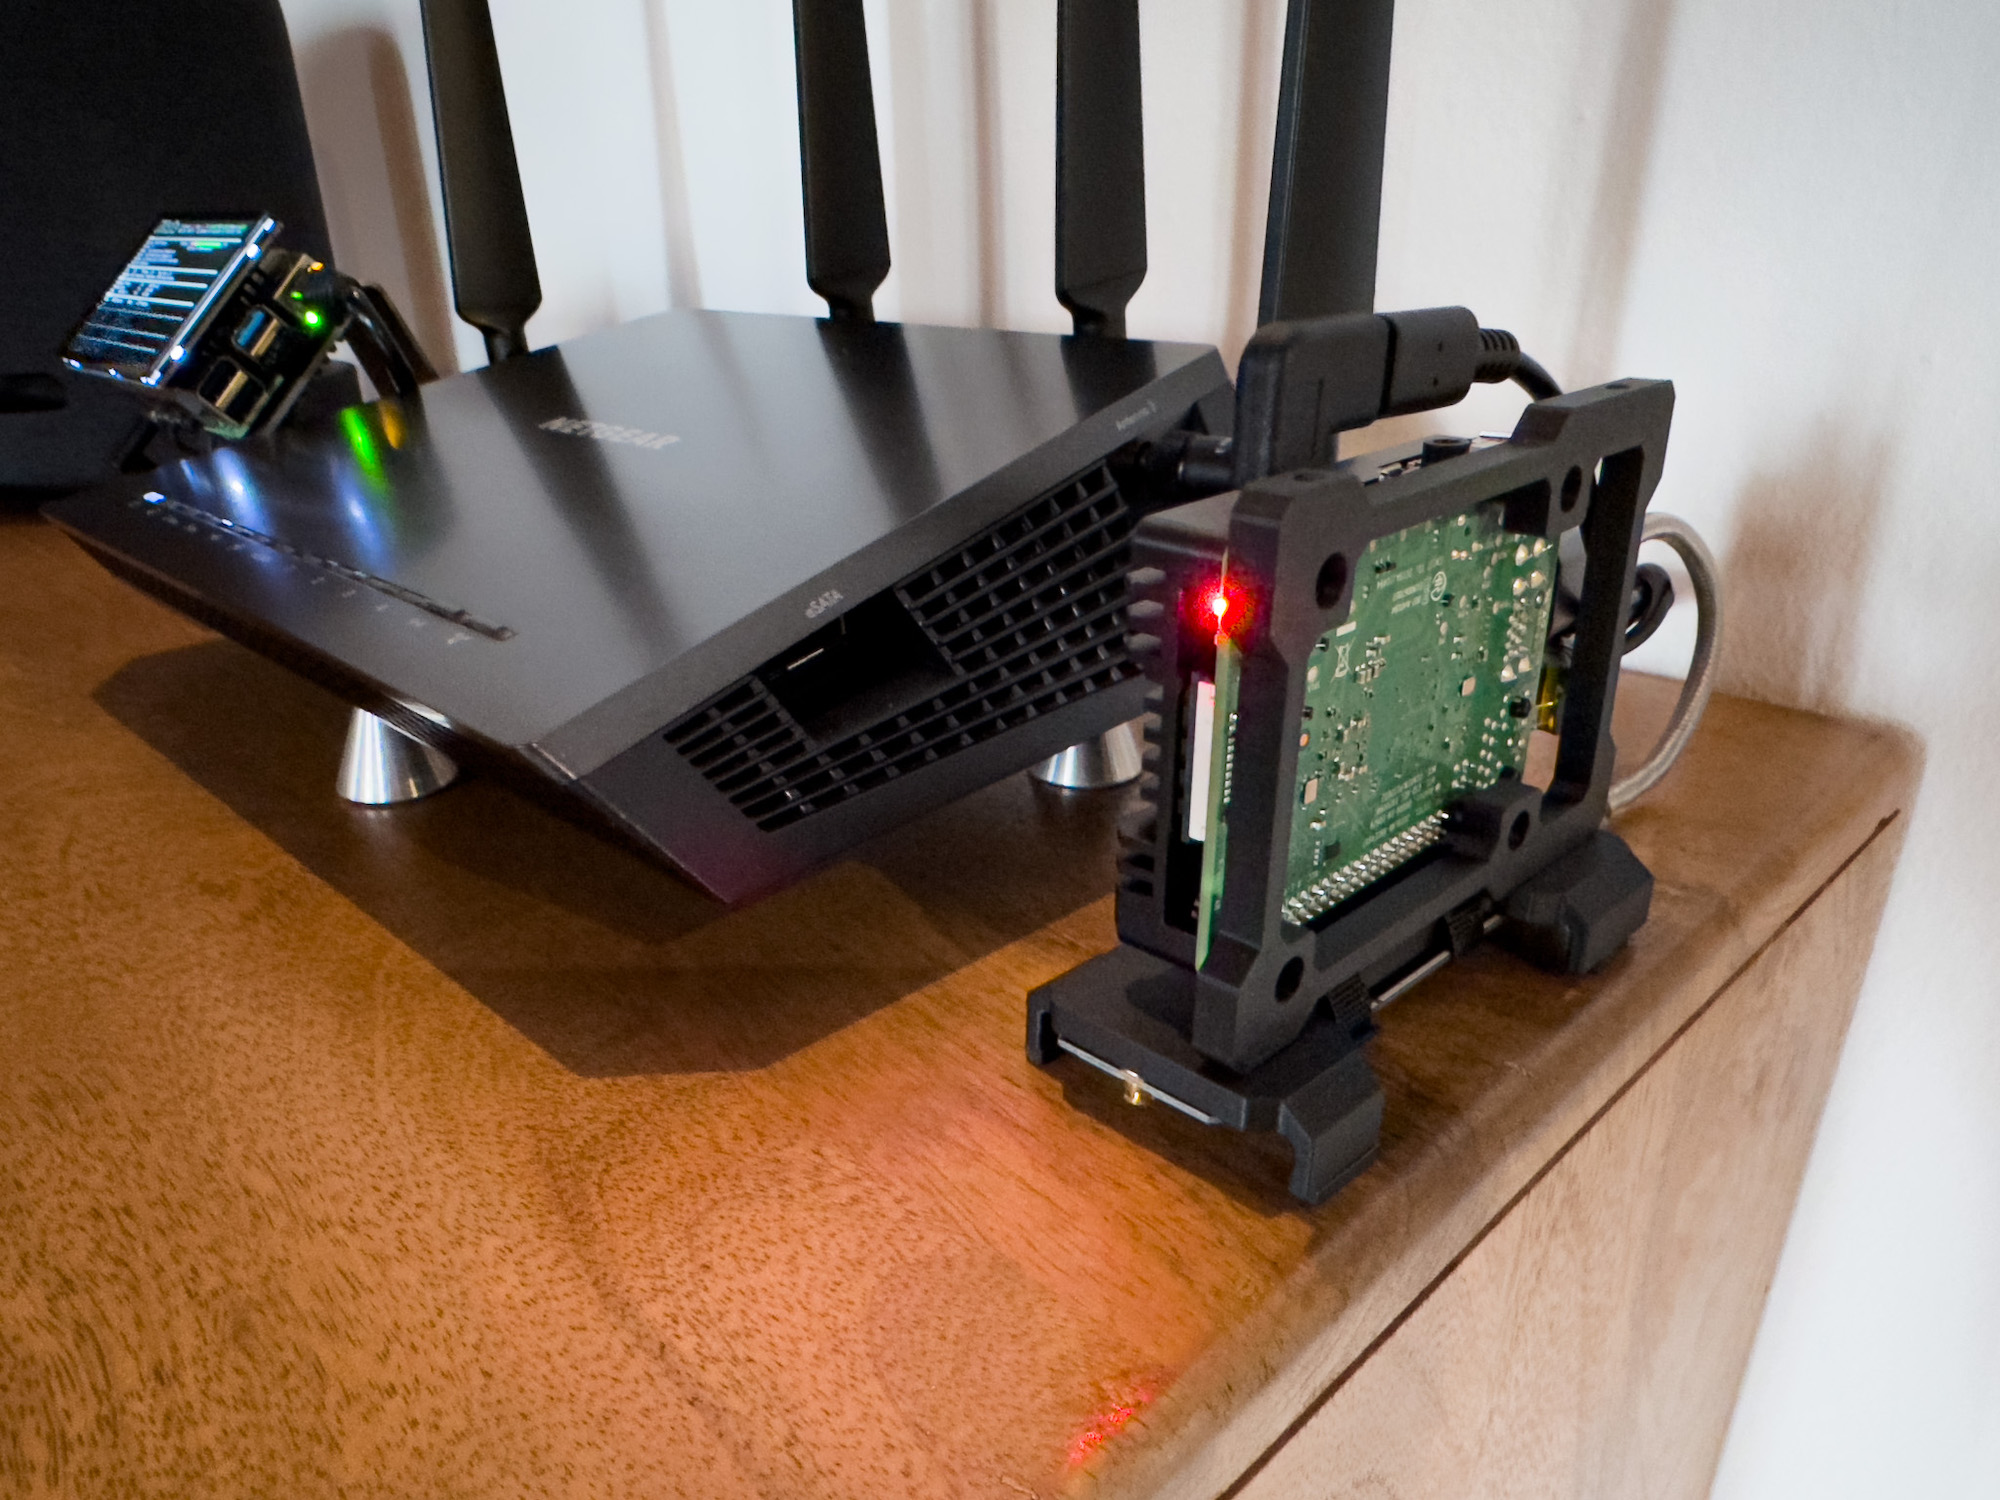
And, obviously, you need something to collect the data/stats from.
I’m building my network dashboards using my nanoPi R4S router and Netgear R7800 as AP, both with OpenWrt. Using the prometheus-node-exporter and collectd-exporter that are writing to a Prometheus database on the Grafana server.
I’m also building a dashboard from my Netatmo weather station, using a scraper from the Netatmo API (always on Prometheus): netatmo-exporter
Prometheus exporter for Netatmo sensor data
and a similar exporter for the Netatmo Energy (smart thermostat/valves): netatmo-energy-exporter
This Prometheus exporter works with the netatmo energy API. It reads the current temperature measurement and set point temperature and exports it in prometheus readable way alongside with other metrics. This exporter publishes metrics per room and per modules
For the Home stats I’m using a plug-in for Homebridge that exports to Prometheus the Homebridge metrics: homebridge-prometheus-exporter
Prometheus metrics exporter for homebridge accessories
And for retrieve the Pi-hole this exporter: PI-Hole Prometheus Exporter
This is a Prometheus exporter for PI-Hole’s Raspberry PI ad blocker
Last, since I’m also monitoring the hardware of the Raspberry PIs (3), one with Pi-Hole, one with Homebridge and the last is the Grafana server, I’m using a node-exporter that is very easy to install and only requires to install it: Prometheus-node-exporter. This is useful to check the temperatures/updates/CPU usage/etc…
The plug-ins I’m using are some examples, obviously is possible to extract the metrics, build the dashboards and receive the reports, from whatever you want (and offers a decent API) like a website analytics, your UPS, Apple Healt app, home energy meter, etc…
Installation
I will not explain how to install Grafana and build the dashboard from the OpenWrt routers, because I’ve already done it in these two post:
I have to write a disclaimer because I’ve made lots of tests before reaching this final setup (also with other plug-in/services) so I hope that I’m remembering all the steps correctly. If you read something absurd, just write me in the comments or use the official install tutorials from the GitHub pages. And I’m also running this setup as a root user for simplicity, because I’m lazy and my Grafana server is inside my LAN behind a firewall and not open to external.
Grafana image render
If you’re using Grafana OSS, then you need the grafana-image-render plug-in. But, because it isnt compiled for ARM, it’s not possible to install it in the easy way, using the Grafana command line with grafana-cli command. So it should be downloaded and compiled. If you’re using a x86 device then use the Grafana CLI.
Get the latest version of Node.js for ARM, then unpack and enter into the node-xyz folder and make a symbolic link to the Unix executive folder cp -R * /usr/local/, or update your .bashrc with the path to the node executive (or search a full tutorial on how to install Node.js).
Then get the official grafana-image-render sources:
git clone https://github.com/grafana/grafana-image-renderer
Get the yarn package manager via Node.js
npm install —global yarn
Get the chromium dependencies
apt install chromium-browser
Build and run
yarn install --pure-lockfile && yarn run build
(maybe you have to use yarn install --ignore-engines && yarn run build if you’re using a newer Node.js version)
Now you can test it
node build/app.js server --port=8081
And see if it output something without errors.
But in order to have the plug-in enabled in Grafana you have to add this section to your grafana.ini:
server_url = http://localhost:8081/render
callback_url = http://localhost:3000/
The grafana-image-render plug-in needs to be launched at the boot as a service, I’ve done it using systemd.
Create a new service file inside /etc/systemd/system called: grafana-image-rendered.service with this text:
[Unit]
Description=grafana-image-rendered

[Service]
WorkingDirectory=/root/grafana-image-renderer/
ExecStart=node build/app.js server --port=8081
Restart=always
Type=simple
RestartSec=10
User=root

[Install]
WantedBy=basic.target
Give to the file 755 permissions and reload the daemon
systemctl daemon-reload
Start it using systemctl
systemctl start grafana-image-renderer
And check if it’s running fine
root@Grafana:~# systemctl status grafana-image-renderer
● grafana-image-renderer.service - Grafana-image-renderer
     Loaded: loaded (/etc/systemd/system/grafana-image-renderer.service; disabled; vendor preset: enabled)
     Active: active (running) since Sat 2022-12-17 10:42:25 CET; 6s ago
   Main PID: 1401 (node)
      Tasks: 7 (limit: 4531)
        CPU: 4.843s
     CGroup: /system.slice/grafana-image-renderer.service
             └─1401 node build/app.js server --port=8081

Dec 17 10:42:25 Grafana systemd[1]: Started Grafana-image-renderer.
Dec 17 10:42:29 Grafana node[1401]: {"level":"info","message":"HTTP Server started, listening at http://localhost:8081"}
If it’s running correctly, you only need to enable it at every boot with systemctl enable grafana-image-renderer.service
root@Grafana:~# systemctl enable grafana-image-renderer.service
Created symlink /etc/systemd/system/basic.target.wants/grafana-image-renderer.service → /etc/systemd/system/grafana-image-renderer.service.
Restart also the the grafana-server.service and go back in the browser. Now you should find the option to share the image of a dashboard panel (tap on a panel > share > Direct link rendered image) here:
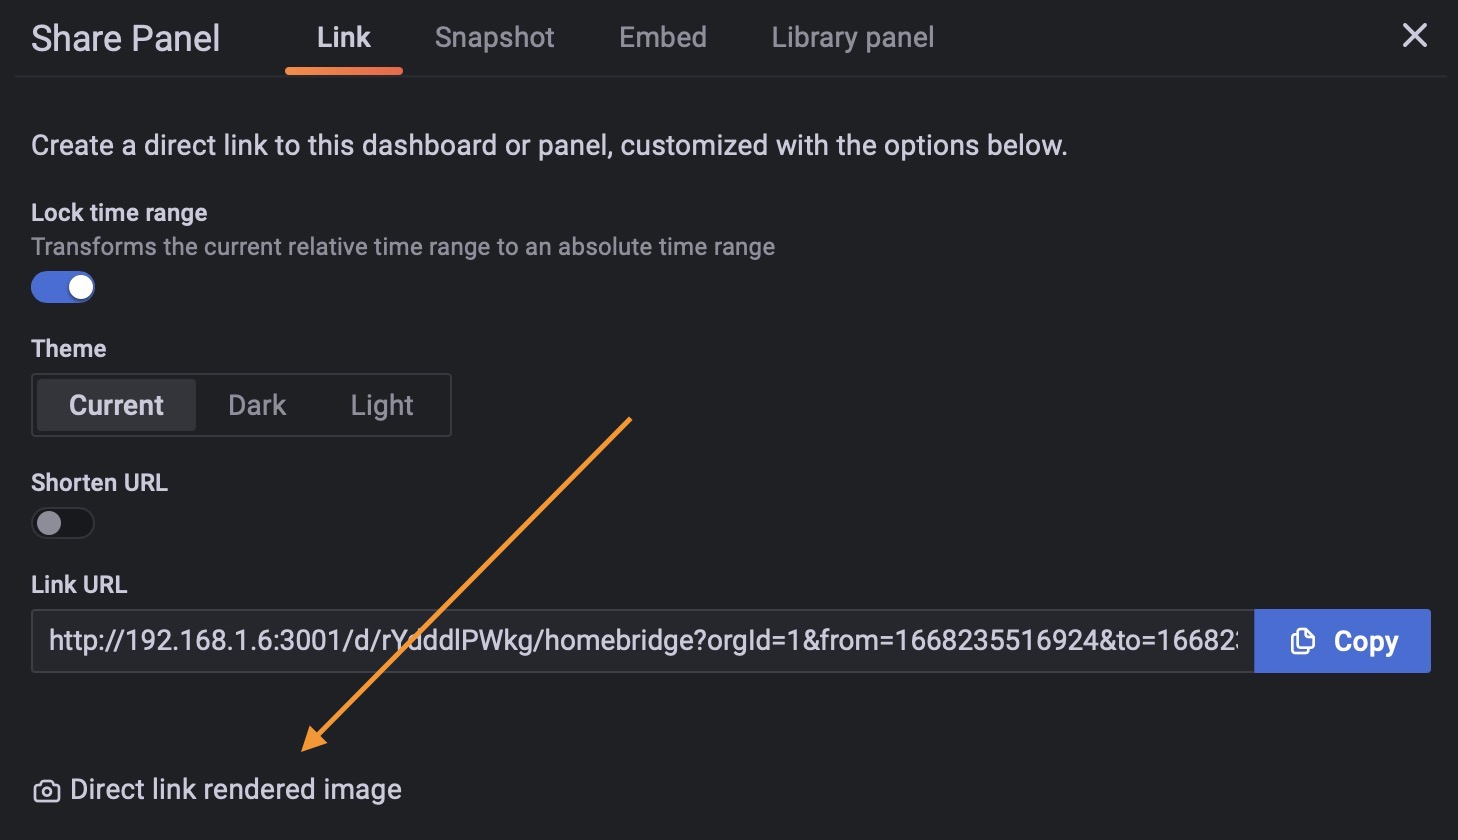
Try to share/build an image and see if it works.
If it works for a single panel, you are also able to render the full dashboard using a url with the render query. Your dashboard url should change from:
192.168.1.6:3001/d/FGioSdO4z/netatmo?from=now-24h&to=now&refresh=1m&kiosk=tv
To
192.168.1.6:3001/render/d/FGioSdO4z/netatmo?from=now-24h&to=now&refresh=1m&kiosk=tv
Note: the render after the IP:port
And you have to add the dashboard pixel size parameters:
192.168.1.6:3001/render/d/FGioSdO4z/netatmo?width=1100&height=1700&kiosk=tv&from=now-24h&to=now
But grafana-image-render by default uses a a non retina resolution and has a limit of 3000px in total length; these values are not sufficient if you want render a big/long dashboard. It will results in a truncated png.
So in order to change the total length size and capture the full dashboard, you need to change the pixel values inside /grafana-image-renderer/src/config.ts
const defaultRenderingConfig = {
    chromeBin: undefined,
    args: ['--no-sandbox', '--disable-gpu'],
    ignoresHttpsErrors: false,
    timezone: undefined,
    acceptLanguage: undefined,
    width: 1000,
    height: 500,
    headed: false,
    deviceScaleFactor: 1,
    maxWidth: 3000,  --> 4000,
    maxHeight: 3000, --> 30000,
    maxDeviceScaleFactor: 4,
    mode: 'default',
And build again the grafana-image-render plug-in: yarn run build
Now it depends on you, because for me this is also not sufficient, because the images are still in low resolution mode, I mean that the texts look “pixelated” (if for you the png rendered is fine, skip this step).
In order to render a retina hi-res png, you need to add the query &scale=2 to the URL (can be used up to 4x).
In the end your complete url query should have these queries:
render / width=1200&height=1700 / scale=2
example:
http://192.168.1.6:3001/render/d/FGioSdO4z/netatmo?width=1200&height=1700&kiosk=tv&scale=2
This query will create a png image of 2200x3400 pixel with a nice resolution.
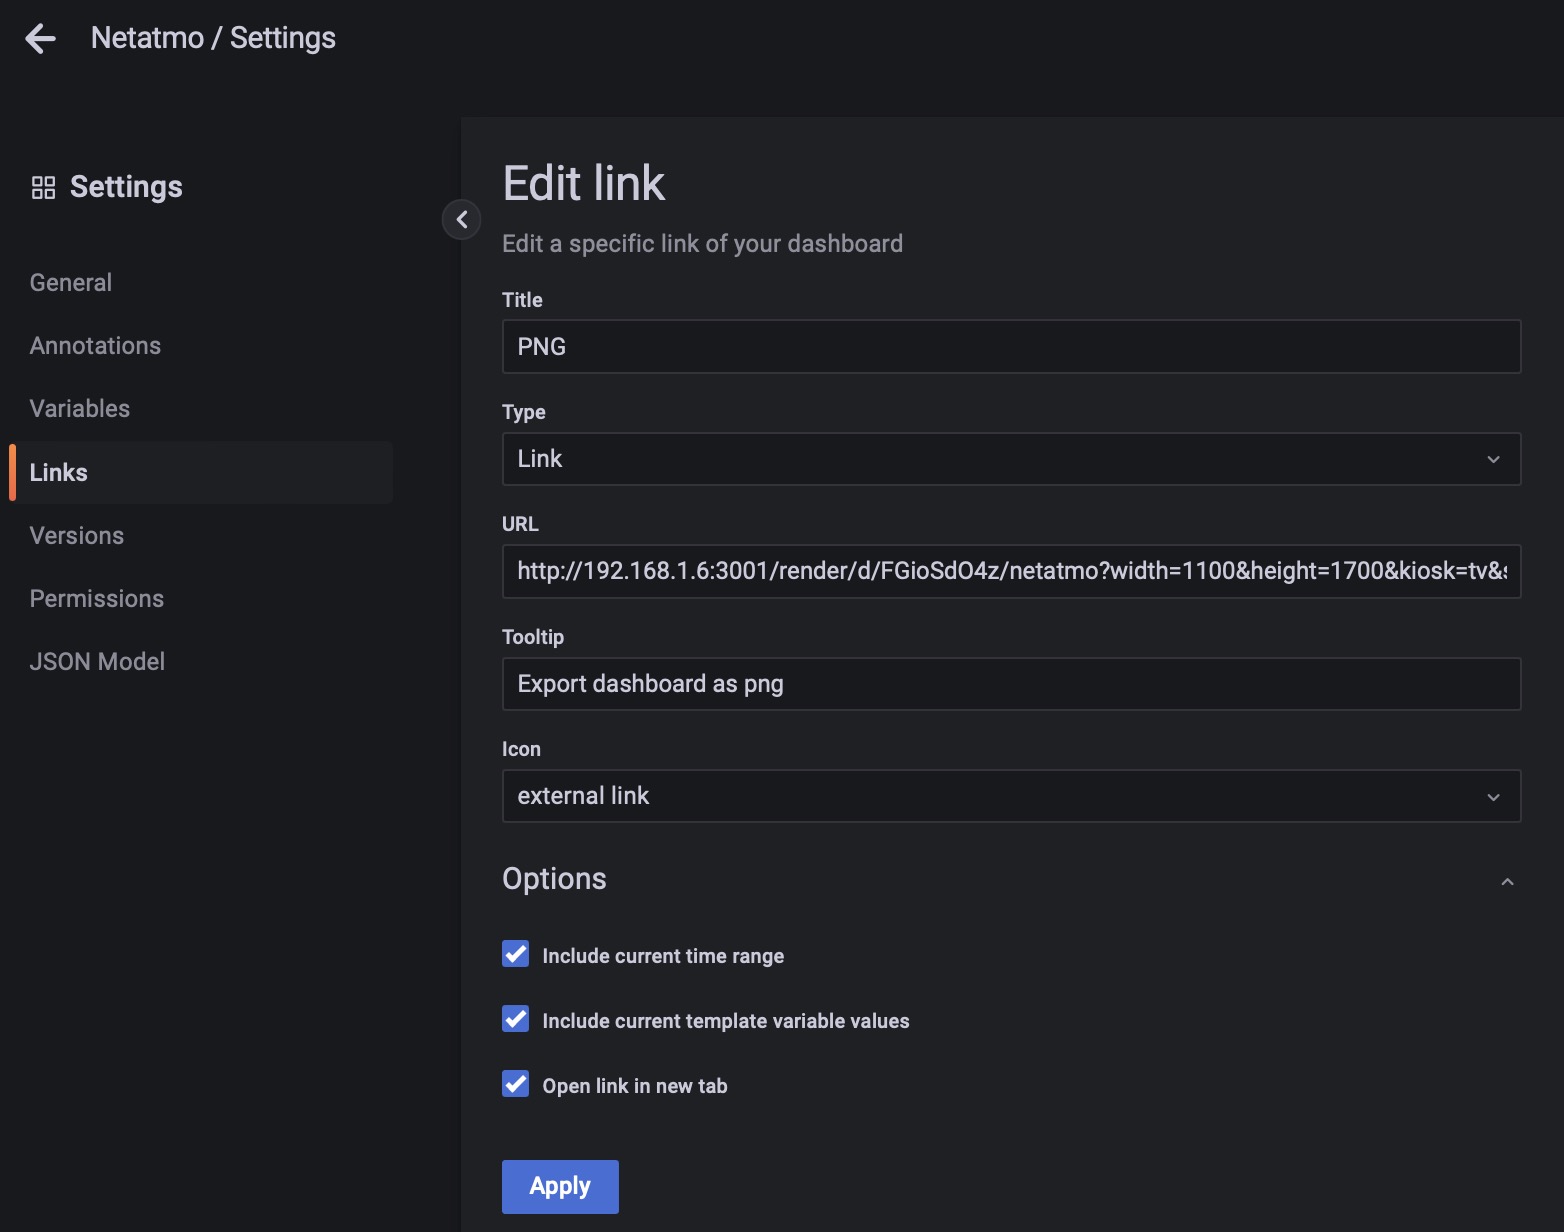
Now you can also add a “Link” to the Grafana dashboard that will create the png with a simple click on it.
Automating the report
For this step you have to install the tools that will send you the dashboard image via mail. I used mailutils and sSMTP. Install them via apt if you don’t have already installed it in your system, and configure it with your mail account/password. I used my “trash account” from Gmail. Edit /etc/ssmtp/ssmtp.conf and at the end of the file add:
AuthUser=your-email@gmail.com
AuthPass=*
mailhub=smtp.gmail.com:587
UseSTARTTLS=YES
But if you have the 2FA enable -as you should- you first need to generate an app specific password. You have to simply go to your Google profile and you will find the “Signing in to Google” section, generate a new password (screenshot) and copy-paste it in the AuthPass field.
Then you have to query the Grafana API via grafana-image-render service to build the png, so I’m using this query in crontab to retrieve the png from Grafana:
#Netatmo daily report
30 06 * * * curl -J -L 'http://192.168.1.6:3001/render/d/FGioSdO4z/netatmo?width=1200&height=1700&from=now-24h&to=now&kiosk=tv&scale=2' --output "Netatmo daily.png"
35 06 * * * echo "" | mail -s "Netatmo daily stats" giuliomagnifico@gmail.com --attach="Netatmo daily.png"
Where
30 06 * * *
is obviously the time and
curl -J -L 'http://192.168.1.6:3001/render/d/FGioSdO4z/netatmo?width=1200&height=1700&from=now-24h&to=now&kiosk=tv&scale=2' --output "Netatmo daily.png
creates the png file with the name “Netatmo daily.png” inside the /root folder.
Unfortunately you have to try the png sizes, untill you reach the correct pixel length/width. Just change the URL in the browser and hit enter, wait and see if the image is too big or truncated.
And the same to generate any other dashboard:
#Casa weekly report
35 06 1 * * curl -J -L '192.168.1.6:3001/render/d/dH3ws5OVk/casa?width=1150&height=1200&from=now-7d&to=now&kiosk=tv&scale=2'  --output "Casa weekly.png"
40 06 1 * * echo "" | mail -s "Casa weekly stats" giuliomagnifico@gmail.com --attach=Casa weekly.png
To test it use your time +1 min and see if it generates the png (it takes 30/60sec to generates the image, depending on the dashboard).
Then you need to send it via email:
echo "" | mail -s "Netatmo daily stats" giuliomagnifico@gmail.com --attach="Netatmo daily.png
I’m using five minutes of delay to give the RaspberryPI the time to build the image. And I’m also using an empty email text (the “”) because I don’t want a text message inside the mail but only the title and attachment.
Try the command via normal command line, to see if you receive the mail.
I suggest you to keep the crontab organized. Mine:
#Netatmo daily report
30 06 * * * curl -J -L 'http://192.168.1.6:3001/render/d/FGioSdO4z/netatmo?width=1200&height=1700&from=now-24h&to=now&kiosk=tv&scale=2' --output "Netatmo daily.png"
35 06 * * * echo "" | mail -s "Netatmo daily stats" giuliomagnifico@gmail.com --attach="Netatmo daily.png"
#Netatmo monday weekly report
25 07 * * 1 curl -J -L 'http://192.168.1.6:3001/render/d/FGioSdO4z/netatmo?width=1200&height=1700&from=now-7d&to=now&kiosk=tv&scale=2' --output "Netatmo weekly.png"
30 07 * * 1 echo "" | mail -s "Netatmo weekly stats" giuliomagnifico@gmail.com --attach=Netatmo weekly.png"
#Netatmo monthly  report
00 07 1 * * curl -J -L 'http://192.168.1.6:3001/render/d/FGioSdO4z/netatmo?width=1200&height=1800&from=now-30d&to=now&kiosk=tv&scale=2' --output "Netatmo monthly.png"
05 07 1 * * echo "" | mail -s "Netatmo monthly stats" giuliomagnifico@gmail.com --attach="Netatmo monthly.png"
#################################################
#Casa daily report
00 21 * * * curl -J -L '192.168.1.6:3001/render/d/dH3ws5OVk/casa?width=1200&height=1510&from=now-24h&to=now&kiosk=tv&scale=2'  --output "Casa daily.png"
05 21 * * * echo "" | mail -s "Casa daily stats" giuliomagnifico@gmail.com --attach="Casa daily.png"
#Casa weekly report
35 06 1 * * curl -J -L '192.168.1.6:3001/render/d/dH3ws5OVk/casa?width=1150&height=1200&from=now-7d&to=now&kiosk=tv&scale=2'  --output "Casa weekly.png"
40 06 1 * * echo "" | mail -s "Casa weekly stats" giuliomagnifico@gmail.com --attach=Casa weekly.png
#################################################
#OpenWrt daily report
30 19 * * * curl -J -L 'http://192.168.1.6:3001/render/d/fLi0yXAWk/openwrt?width=1200&height=5000&from=now-24h&to=now&kiosk=tv&scale=2' --output OpenWrt.png
35 19 * * * echo "" | mail -s "OpenWrt daily stats" giuliomagnifico@gmail.com --attach=OpenWrt.png
################################################
#Pi-Hole daily report
30 20 * * * curl -J -L 'http://192.168.1.6:3001/render/d/MIBVglomg/pi-hole?width=1200&height=1800&from=now-24h&to=now&kiosk=tv&scale=2' --output "Pi-Hole daily.png"
35 20 * * * echo "" | mail -s "Pi-Hole daily stats" giuliomagnifico@gmail.com --attach="Pi-Hole daily.png"
################################################
Tips
To avoid high usage of space in my inbox I’m using a rule in Gmail that auto-delete these daily emails after 3 months.
If your Prometheus exporter service is not running at boot, be sure to have started and enabled it (not only started).
Remember to add all the scraping configs to the prometheus.yml file, i.e. :
   static_configs:
    - targets: ["localhost:9090"]
    - targets: ["192.168.1.2:9100"]
    - targets: ["192.168.1.3:9100"]
    - targets: ["192.168.1.4:9100"]
    - targets: ["192.168.1.4:9617"]
    - targets: ["192.168.1.5:9100"]
    - targets: ["192.168.1.6:9100"]
    - targets: ["192.168.1.6:9210"]
    - targets: ["192.168.1.6:9103"]
    - targets: ["192.168.1.6:2112"]
Bonus: build PDF reports
The bonus tip is build a pdf file instead of the png. This feature comes with Grafana Enterprise (that can costs up to $40,000/year), but fortunately there’s another way to build the pdf, using a FOSS service: Grafana reporter by Izak Marais.
Here are two example pdfs from my dashnoards:
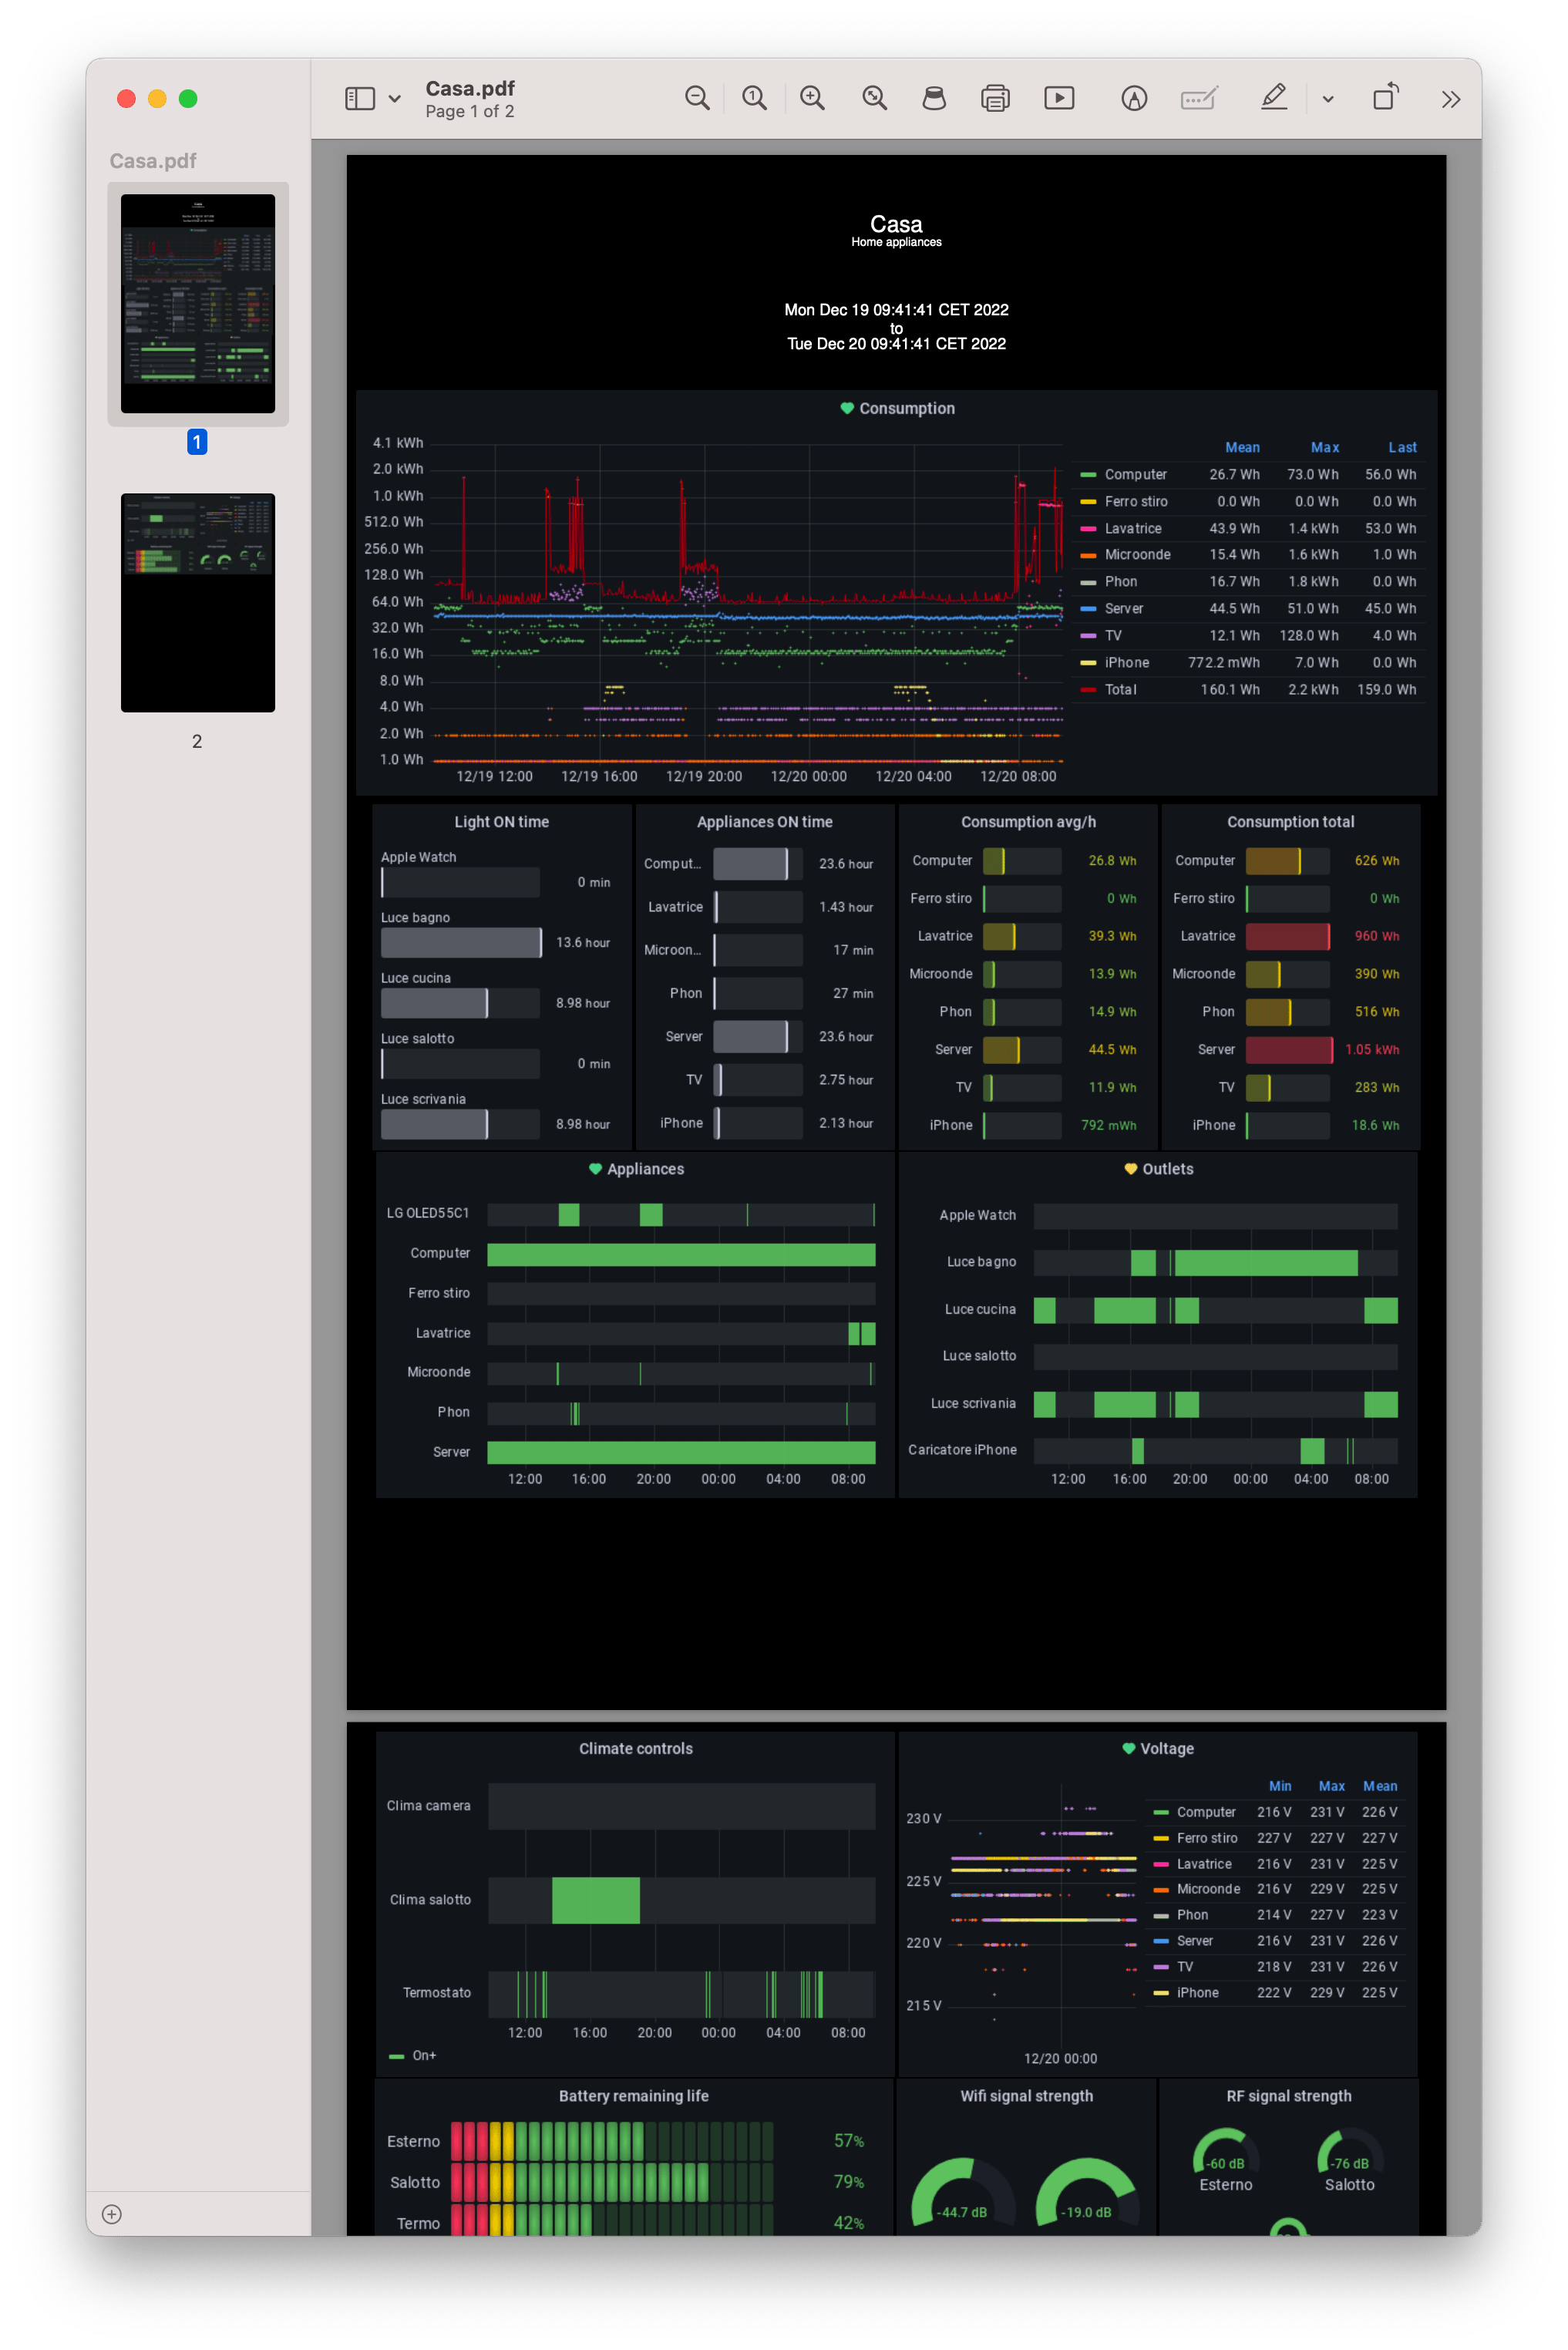
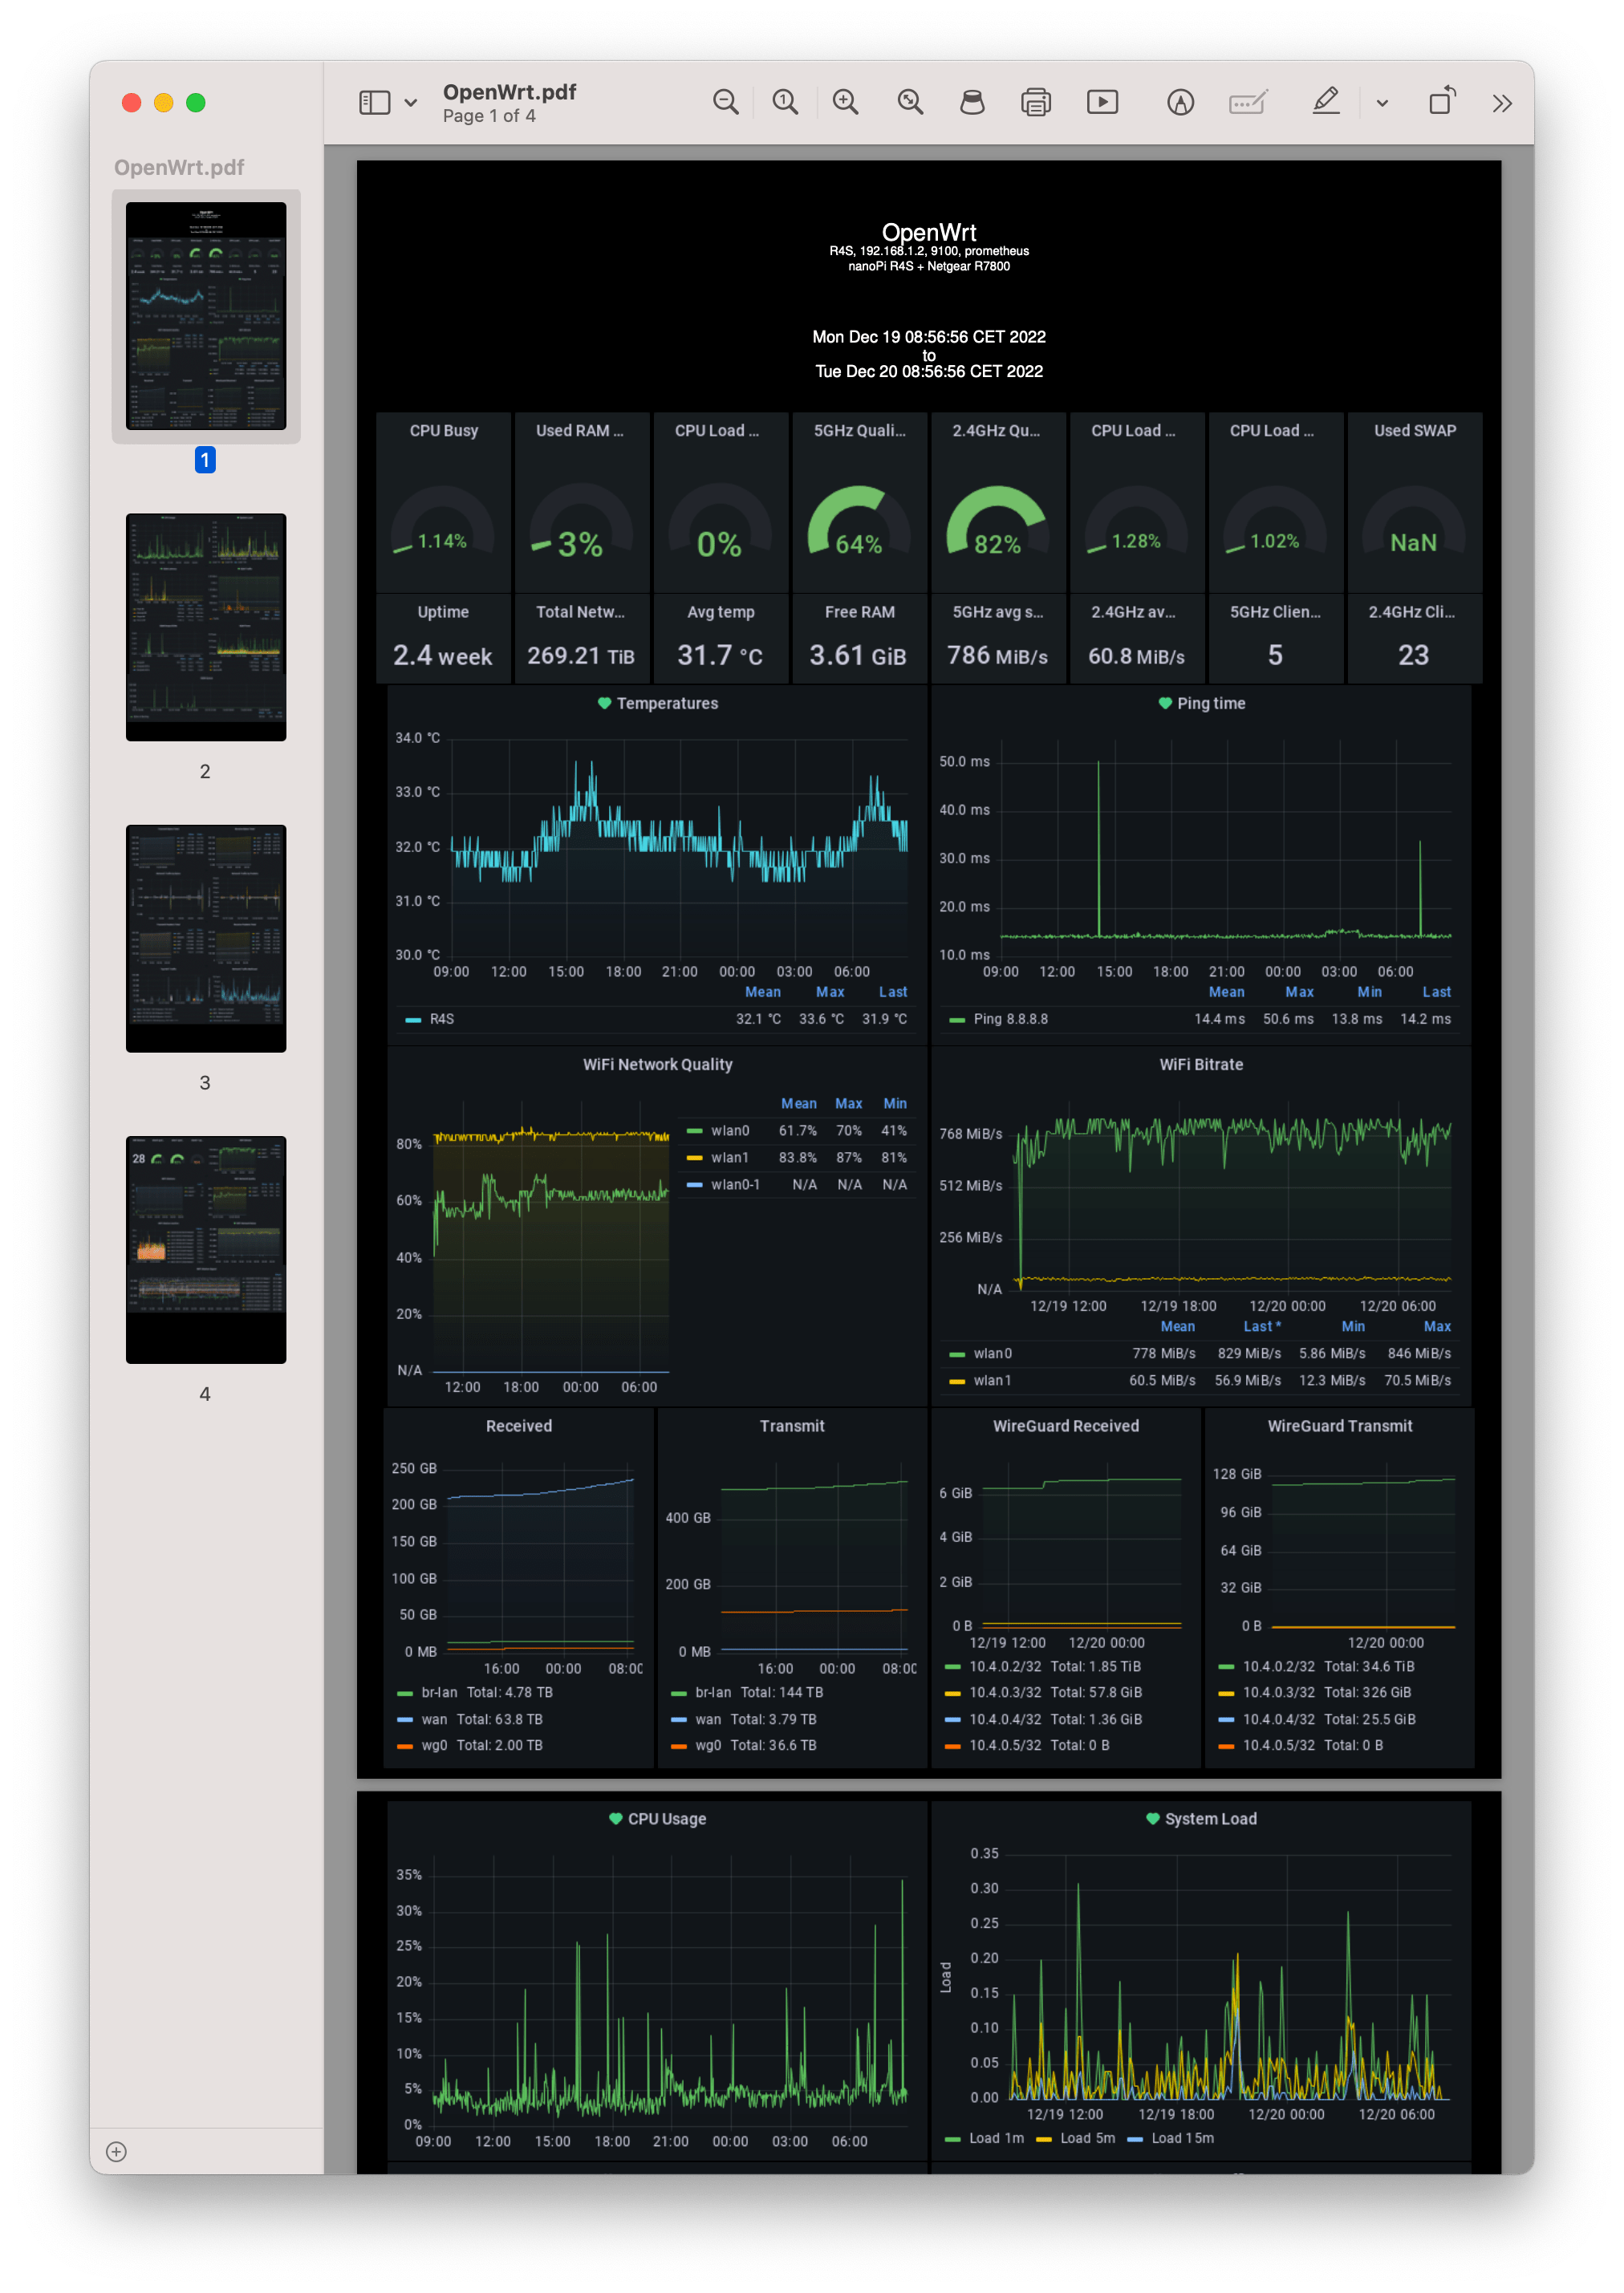 (I’ve made some edits to better fits my “taste” for the fonts, layout and dark theme. More info below)
I have to say that I prefer to use the png images because they’re lighter than the pdf files, they take less time to be rendered, and I don’t have to rely on a third party service. But sometimes I use also the pdf files, since the pdf can be handy in some situation, particularly if there’re texts instead of graphs and if you want to have a header.
In order to run it read the grafana-reporter page on GitHub. You only have to install Golang, PDFLATEX and some dependences:
apt install texlive-latex-base texlive-fonts-recommended texlive-fonts-extra
And Golang from the official website: go.dev/dl. Unpack the file, move the go folder to your /usr/local/, give it the executive permissions and update the $PATH of your .bashrc.
After you need to grab the sources and build the service using
go install github.com/IzakMarais/reporter/cmd/grafana-reporter@latest
Test it
grafana-reporter
(if you don’t have the correct path written in your .bashrc, you have to launch it adding it: /your/path/go/grafana-reporter )
I’m running it with the options to build the graphs with the grid , see the GitHub page as reference for the available flags
grafana-reporter -ip 192.168.1.6:3001 -grid-layout
Now, if the grafana-reporter is running fine, you can start to generate the PDF of your dashboard using the “Link” option in the dashboard config:
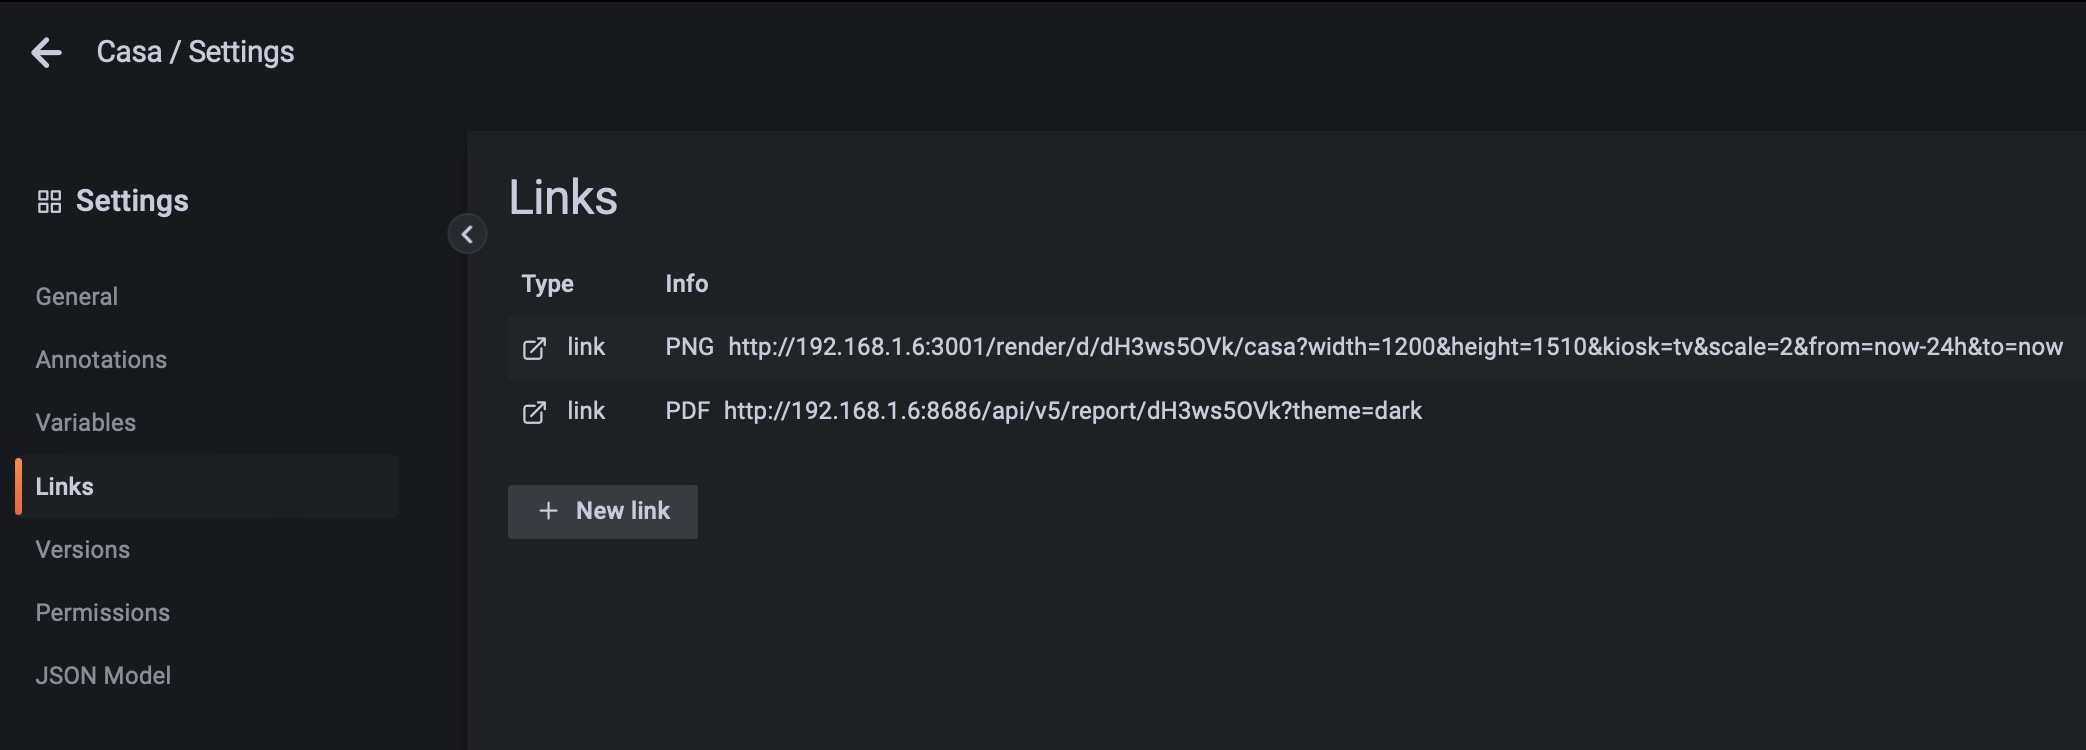
http://192.168.1.6:8686/api/v5/report/dH3ws5OVk
If all is working you will…have to wait (depending on how many dashboard panels you have, anyway it’s slower than the png) and then your PDF will be rendered in a new tab.
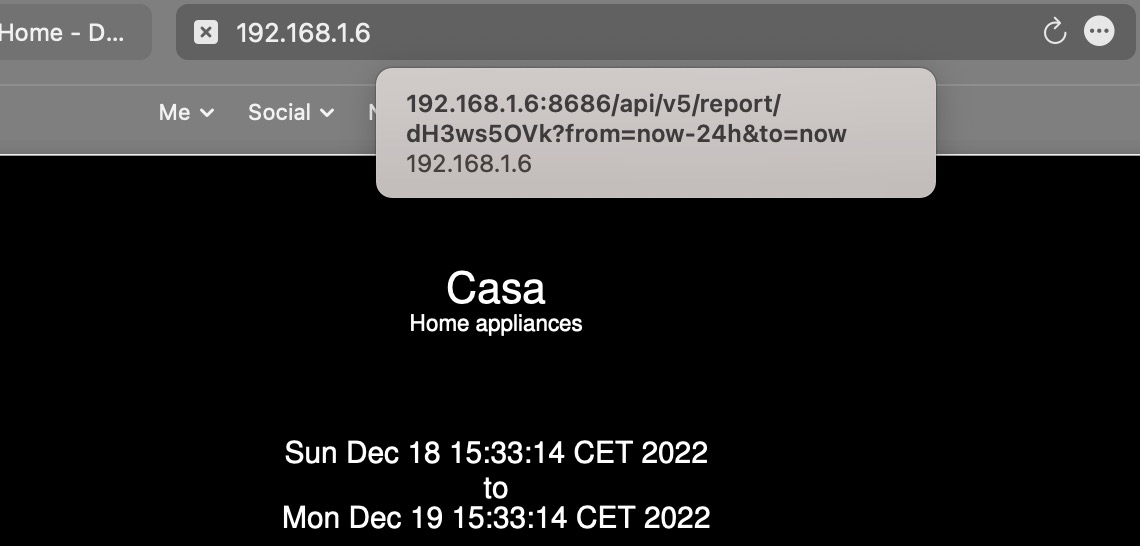
And you will also see in your terminal the info of the running grafana-reporter that is building the PDF:
root@Grafana:~/go/bin# grafana-reporter -ip 192.168.1.6:3001 -grid-layout
2022/12/19 10:17:54 grafana reporter, version: 2.3-1 hash: 6cfc3e220dc4f8fc0175ae0ec8698d35546d8c10
2022/12/19 10:17:54 serving at ':8686' and using grafana at 'http://192.168.1.6:3001'
2022/12/19 10:17:54 SSL check enforced
2022/12/19 10:17:54 Using grid layout.
2022/12/19 10:19:22 Reporter called
2022/12/19 10:19:22 Called with api Token:
2022/12/19 10:19:22 Called without variable
2022/12/19 10:19:22 Called with dashboard: dH3ws5OVk
2022/12/19 10:19:22 Called with time range: {now-24h now}
2022/12/19 10:19:22 Connecting to dashboard at http://192.168.1.6:3001/api/dashboards/uid/dH3ws5OVk
2022/12/19 10:19:22 Populated dashboard datastructure: {Title:Casa Description:Home appliances VariableValues: Rows:[] Panels:[{Id:4 Type:timeseries Title:Consumption GridPos:{H:9 W:24 X:0 Y:0}} {Id:20 Type:bargauge Title:Light ON time GridPos:{H:8 W:6 X:0 Y:9}} {Id:19 Type:bargauge Title:Appliances ON time GridPos:{H:8 W:6 X:6 Y:9}} {Id:17 Type:bargauge Title:Consumption avg/h GridPos:{H:8 W:6 X:12 Y:9}} {Id:16 Type:bargauge Title:Consumption total GridPos:{H:8 W:6 X:18 Y:9}} {Id:13 Type:state-timeline Title:Appliances GridPos:{H:8 W:12 X:0 Y:17}} {Id:12 Type:state-timeline Title:Outlets GridPos:{H:8 W:12 X:12 Y:17}} {Id:8 Type:state-timeline Title:Climate controls GridPos:{H:8 W:12 X:0 Y:25}} {Id:6 Type:timeseries Title:Voltage GridPos:{H:8 W:12 X:12 Y:25}} {Id:22 Type:bargauge Title:Battery remaining life GridPos:{H:5 W:12 X:0 Y:33}} {Id:24 Type:gauge Title:Wifi signal strength GridPos:{H:5 W:6 X:12 Y:33}} {Id:26 Type:gauge Title:RF signal strength GridPos:{H:5 W:6 X:18 Y:33}}]}
2022/12/19 10:19:22 Downloading image  20 http://192.168.1.6:3001/render/d-solo/dH3ws5OVk/_?
...
Now you need to run the grafana-reporter at every reboot, as for the grafana-image-renderer plugin, just create a new service and enable it using systemd as I explained before for grafana-image-rendered. The grafana-reporter.service:
[Unit]
Description=grafana-reporter

[Service]
WorkingDirectory=/root/go/bin/
Type=simple
Restart=always
RestartSec=5s
ExecStart=/root/go/bin/grafana-reporter -ip 192.168.1.6:3001 -grid-layout
User=root

[Install]
WantedBy=multi-user.target
Reboot your server and see if the grafana-reporter is running and you can correctly build the PDF report using the dashboard link.
If you want to use the black background, you need to change the theme from “light” to “dark”, line 167 inside the file api.go
values.Add("theme", "dark")
And if you want to change the layout, font, spacing, etc… you have to modify two files: texGridTemplate.go. My version (I hope to remember correctly the files from months ago, otherwise write it in the comments):
package report

const defaultGridTemplate = `
%use square brackets as golang text templating delimiters
\documentclass[a3paper]{article}
\usepackage{graphicx}
\usepackage[margin=0.1in]{geometry}
\usepackage{xcolor}
\usepackage{helvet}

\pagecolor[rgb]{0,0,0}
\color[rgb]{1,1,1}
 \renewcommand{\familydefault}{\sfdefault}

\graphicspath{ {images/} }
\begin{document}
\title{[[.Title]] [[if .VariableValues]] \\ \small [[.VariableValues]] [[end]] [[if .Description]] \\ \small [[.Description]] [[end]]}
\date{[[.FromFormatted]]\\to\\[[.ToFormatted]]}
\maketitle
\begin{center}
[[range .Panels]][[if .IsPartialWidth]]\begin{minipage}{[[.Width]]\textwidth}
\includegraphics[width=\textwidth]{image[[.Id]]}
\end{minipage}
[[else]]\par
\vspace{0.2cm}
\includegraphics[width=\textwidth]{image[[.Id]]}
\par
\vspace{0.2cm}
[[end]][[end]]

\end{center}
\end{document}
`
and texTemplate.go. My version:
package report

const defaultTemplate = `
%use square brackets as golang text templating delimiters
\documentclass{article}
\usepackage{graphicx}
\usepackage[margin=1in]{geometry}

\graphicspath{ {images/} }
\begin{document}
\title{[[.Title]] [[if .VariableValues]] \\ \large [[.VariableValues]] [[end]] [[if .Description]] \\ \small [[.Description]] [[end]]}
\date{[[.FromFormatted]]\\to\\[[.ToFormatted]]}
\maketitle
\begin{center}
[[range .Panels]][[if .IsSingleStat]]\begin{minipage}{0.3\textwidth}
\includegraphics[width=\textwidth]{image[[.Id]]}
\end{minipage}
[[else]]\par
\vspace{0.5cm}
\includegraphics[width=\textwidth]{image[[.Id]]}
\par
\vspace{0.5cm}
[[end]][[end]]

\end{center}
\end{document}
`
And remeber to recompile the grafana-reporter (with go install) and restart the the service with the new executable file (with systemctl restart)
Conclusion
I know that you can argue “what a boring feature to have those emails to read”, indeed it is if you feel like “I must read them”. Usually I watch these graphs when I go to bed, they are relaxing and conciliate sleep =]
Anyway I find these reports useful to check:
- the appliances wattage consumption and usage
- the weather trends
- the automations start/stop (I.e. when the thermostat or A/C turn on and for how long)
- the amount, and type, of data in my network and what the clients are doing
- the wi-fi stats and connected clients
- the temps, load of hardware and updates
My full setup, if you’re curious (I will write a post with the latest hardware updates):
