In this post I want to describe how Pushover and Grafana are helping me to get some important push notifications of my life, health, home and nerdy stuff.
Disclaimer: I hate to be full of useless push notifications! For that I have really few push notifications active on my phone, as always I’m a minimalistic guy and I like to focus on few things that are important. If I receive a push, it must be useful, so I blocked all the useless (maybe also dangerous) push notifications, consequentially this is not a post that would explain how to get dozens of pointless notifications. Although at first it might appear as such.
Indeed at the beginning this post can sound like “What an annoying things receive all of these notifications”. But instead I found some of these notifications very useful, that have improved the quality of my life (especially the weather and home notifications). And I’m receiving only the notifications that I’m sure I need and want.
Diclaimer 2: I’ve written also a post on “how to retrieve these stats via mail as png or pdf”, that pairing with this post, read it here: Retrieve a scheduled report of your Grafana dashboards via mail - etcetera
Introduction
Getting back on topic: why Grafana and Pushover?
Because almost all apps can only send a push when “something” happens, but not when it happens for x time or when the value comes back to normal.
For example: I want an alert if the external pressure drops below 990mb but also when the pressure returns above 990mb.
Or I want to have a notification when a sum of my home appliances (like a wash machine) consumption is above 1.5Kwh, but only if this happens for more than 5mins.
Or a push when the temperature in the bedroom is low, but not after few minutes (that means I’m only changing the air), only after 30 minutes (that means it’s cold or I forgot the window opened). Or the same when the CO2 in my bedroom is above 1000ppm for more than 1 hour, and more important, I want to know when it goes back below 1000ppm (translated, when I open the window to change the air).
All of these conditions can be executed/met by the Grafana alert manager. And not with the Netatmo app, where you can get the push when the temperature is low but you can’t change the trigger time, or you can’t get a push when the conditions are back to normal. Same for the other similar apps.
In addition I want to have these notifications with a different sound/warning depending on the account that is receiving the notifications. In order to understand if the just received push is a important notification without read it but only listening the sound of it (for example “high CO2 in bedroom” or a useless one “SQM traffic high”).
All of these fancy stuff can be achieved by using Grafana as Alert Manager and Pushover as a notifications delivery system. But it’s not easy, neither complicated, I think it’s complex.
In order that you can better understand, and to make a recap, I’m using Pushover to get detailed notifications from:
- Home temperatures, air quality, pressure, noise, humidity, etc.. using the Netatmo weather station (2 internal +1 external modules)
- Leaving home scene executed from Home app/HomeKit
- Home network with OpenWrt router and AP
- Home wattage consumption, light turned ON, batteries level, etc..
- My 3 Raspberry PI temperatures, usage, updates that are my servers for Grafana, Pi-Hole, Homebridge
- Pi-hole ADs blocked or if a client is flooding the DNS server
(PS: I’m writing another post on how to integrate all of these data in Grafana and get daily/weekly/whenever report as png delivered to your mail when you want)
Until now my push alerts from Grafana/Pushover were not well formatted and I have never spent time on them, I was receiving the push alert with the title and a weird query… this terrible thing:

For these reasons I decided that I want to receive useful push notifications, that show me the value of the query/alert, a direct link to the panel ID + dashboard ID and from different accounts/sounds regarding l the importance and the instance, or environment, like home/weather/network/servers.
The final results
So after some investigations and test, this is my final result.
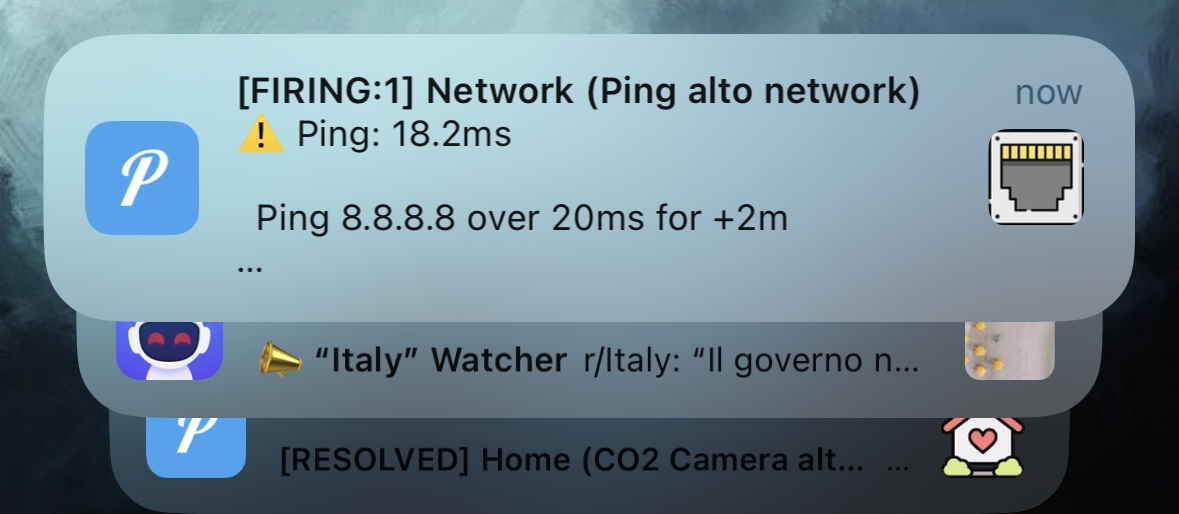
The summary of a push in the Lock Screen:

The detail of the alert if I tap on it:
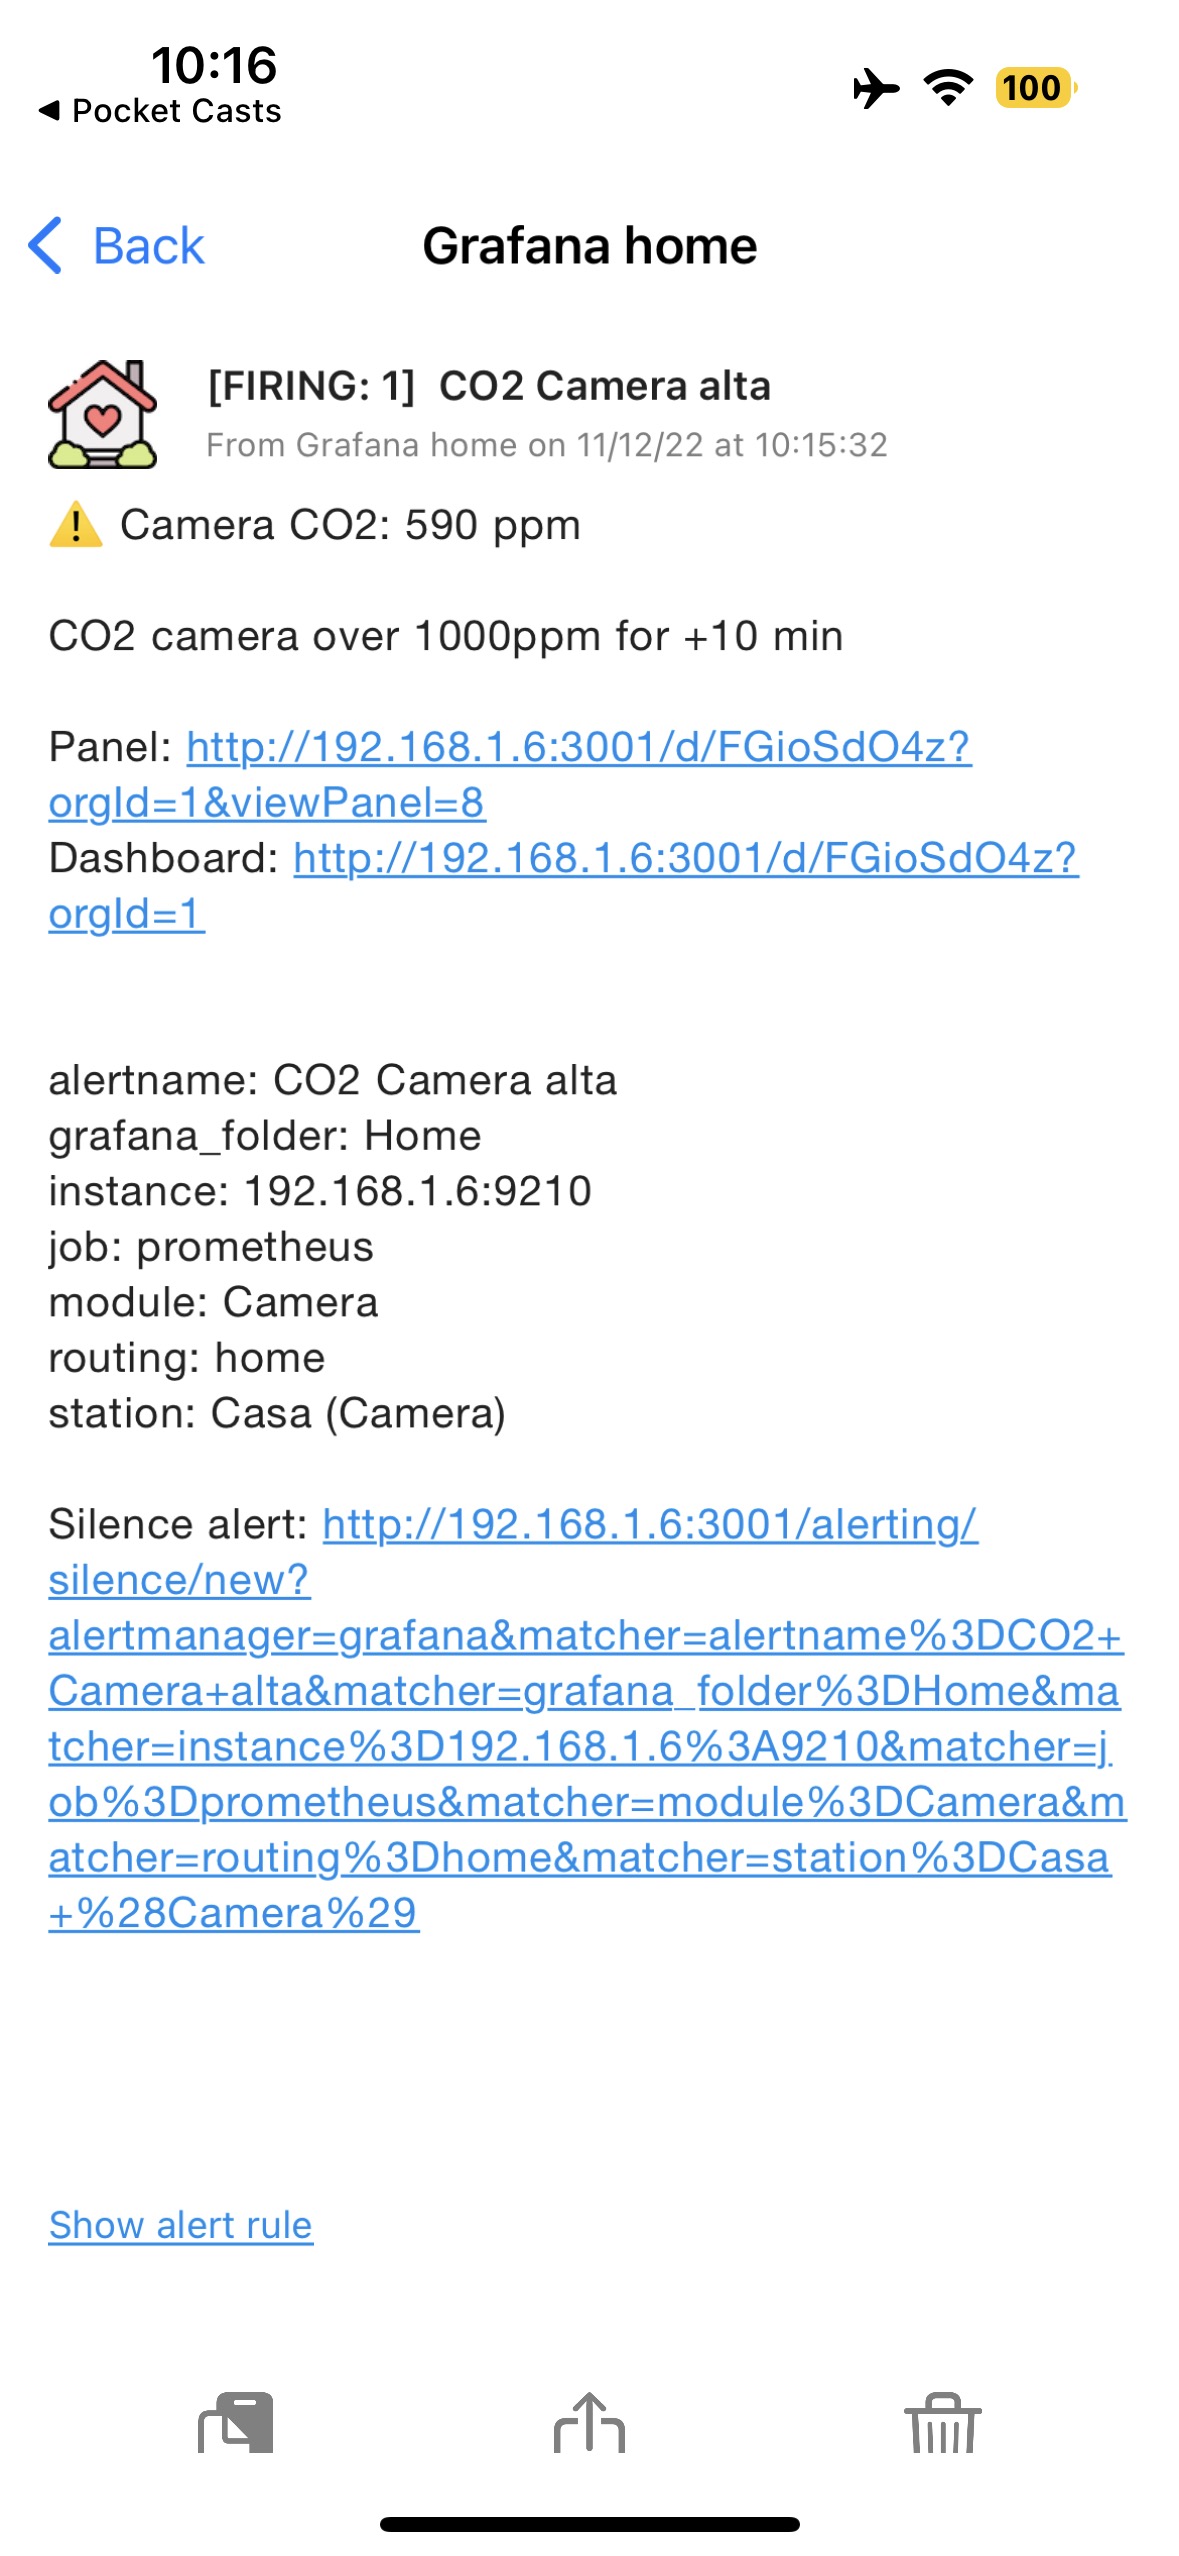
And when the alert is resolved/back to normal:

This is the overall view of my Pushover app:
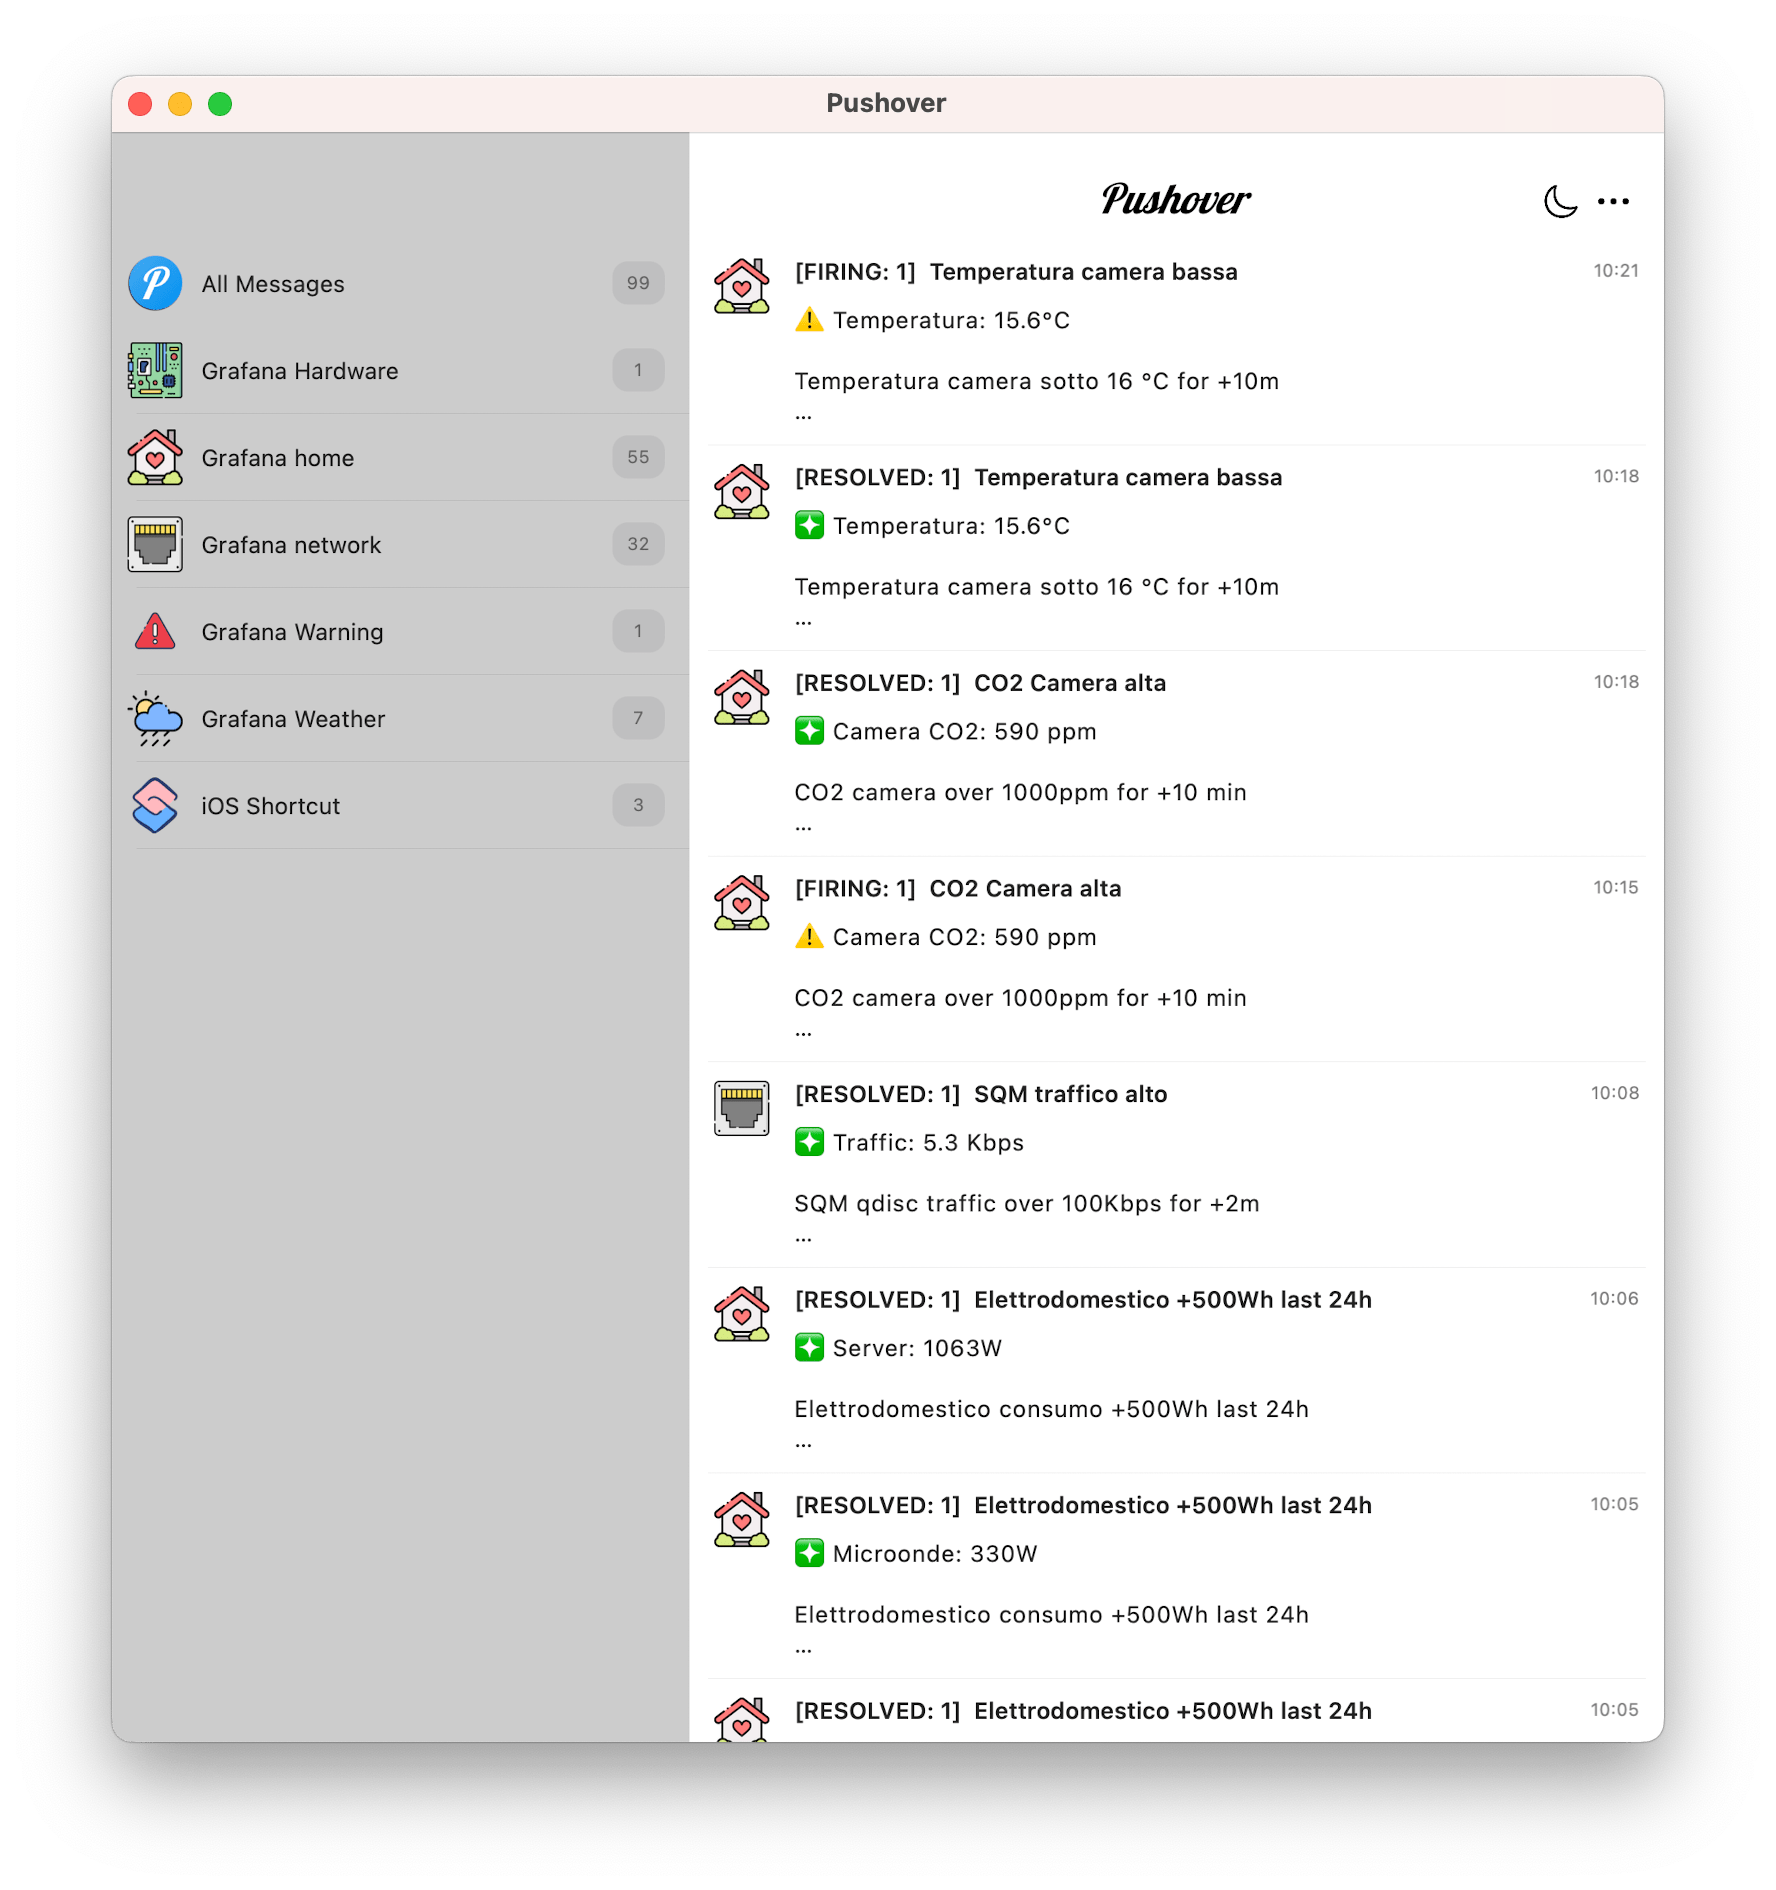
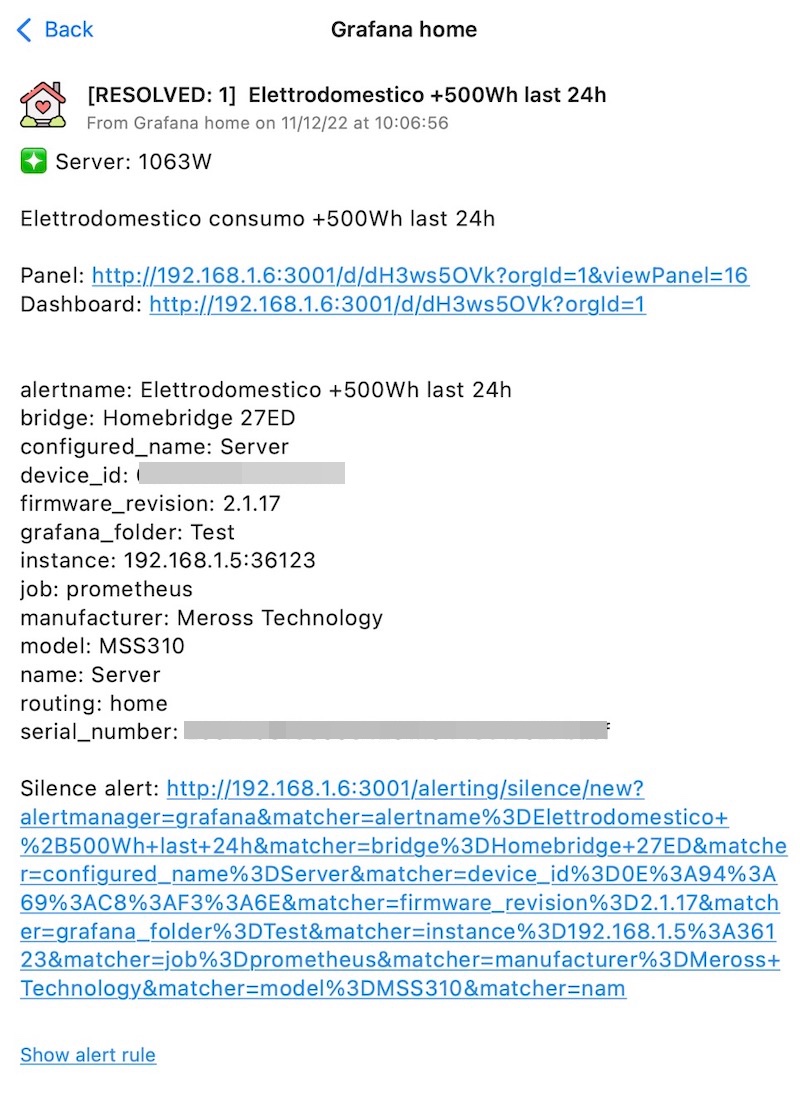
As you can see now the first thing I read is the title and name of the alert, then I can quickly view with a glance if the alert is firing or is resolved (using the emoticons ⚠️ and ❇️), the value of the query that is firing or is resolved, a link to the panel and a link to the dashboard. In addition the other standard fields to silence or view the rule.
This stupid notification turned out very complex to be achieved.
Building the notification system
First: there isn’t a precise order to do theese steps, but is important to configure all, because all is tuned together:
- Pushover
- Grafana alert contacts and message templates
- Grafana new rules and details
- Pushover istances in Pushover and Grafana
The requirements are a server that is running Grafana and a Pushover account obviously.
First I want to show you the screenshots of the overall setup, so you can understand where are the things and how they should appear at the end.
Pushover istances
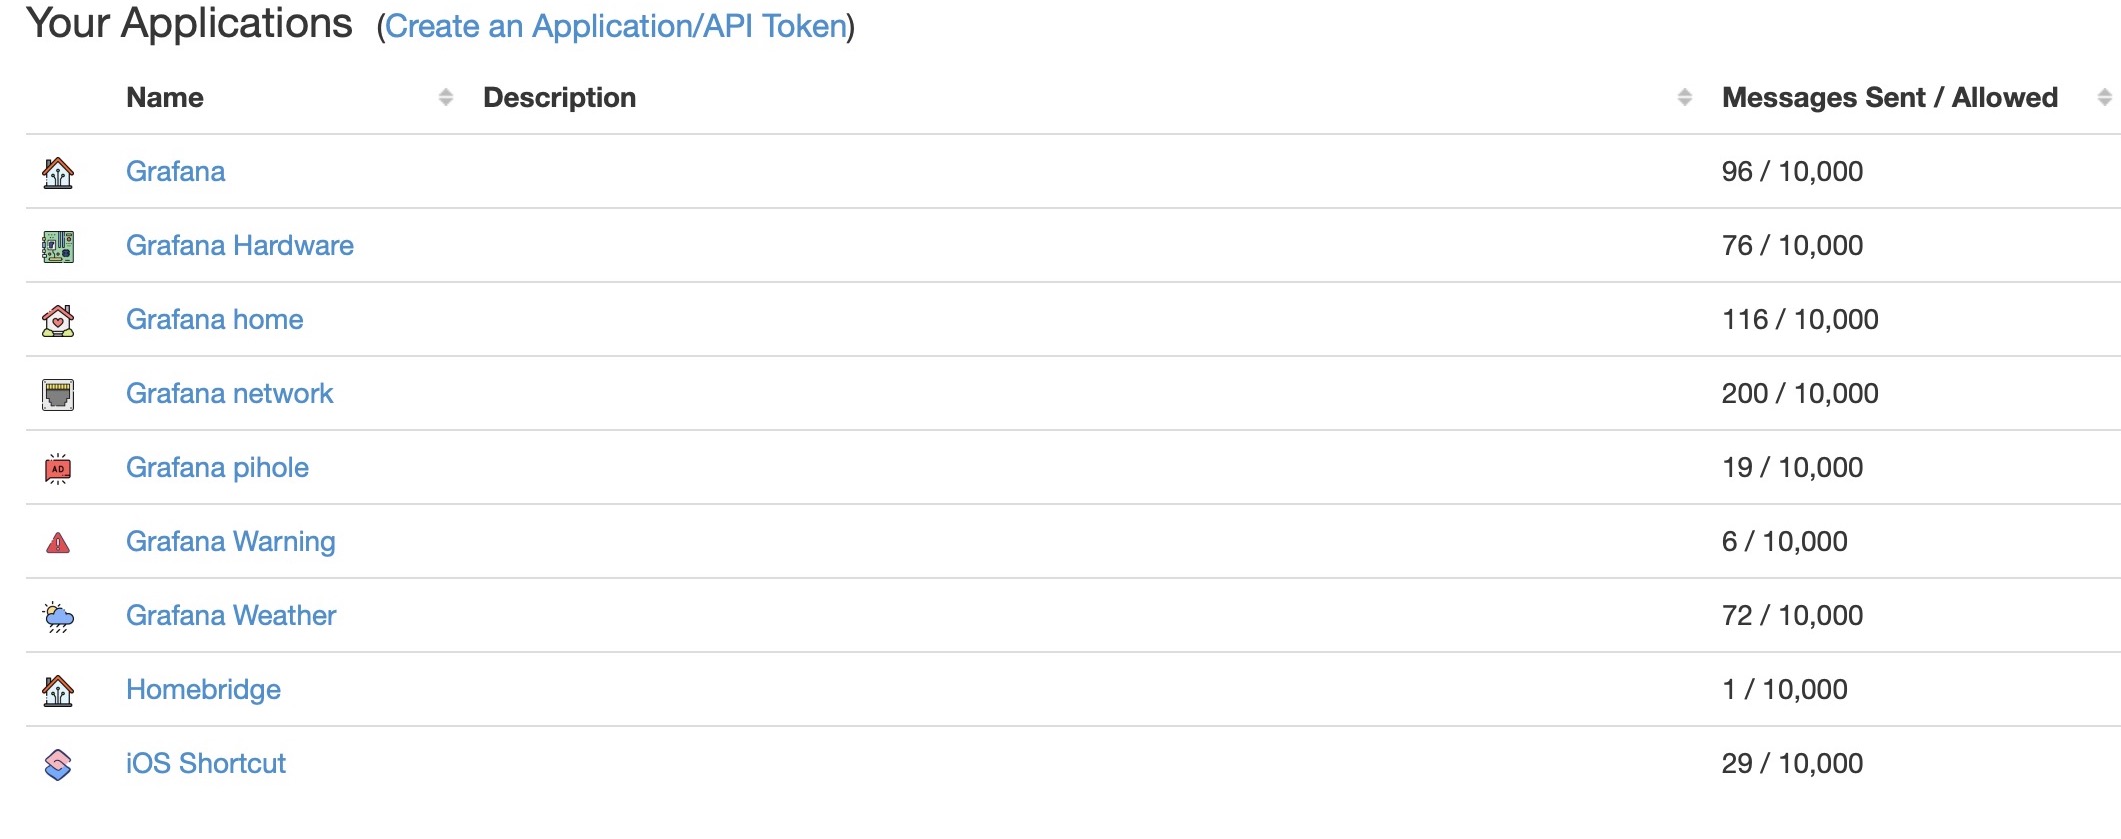
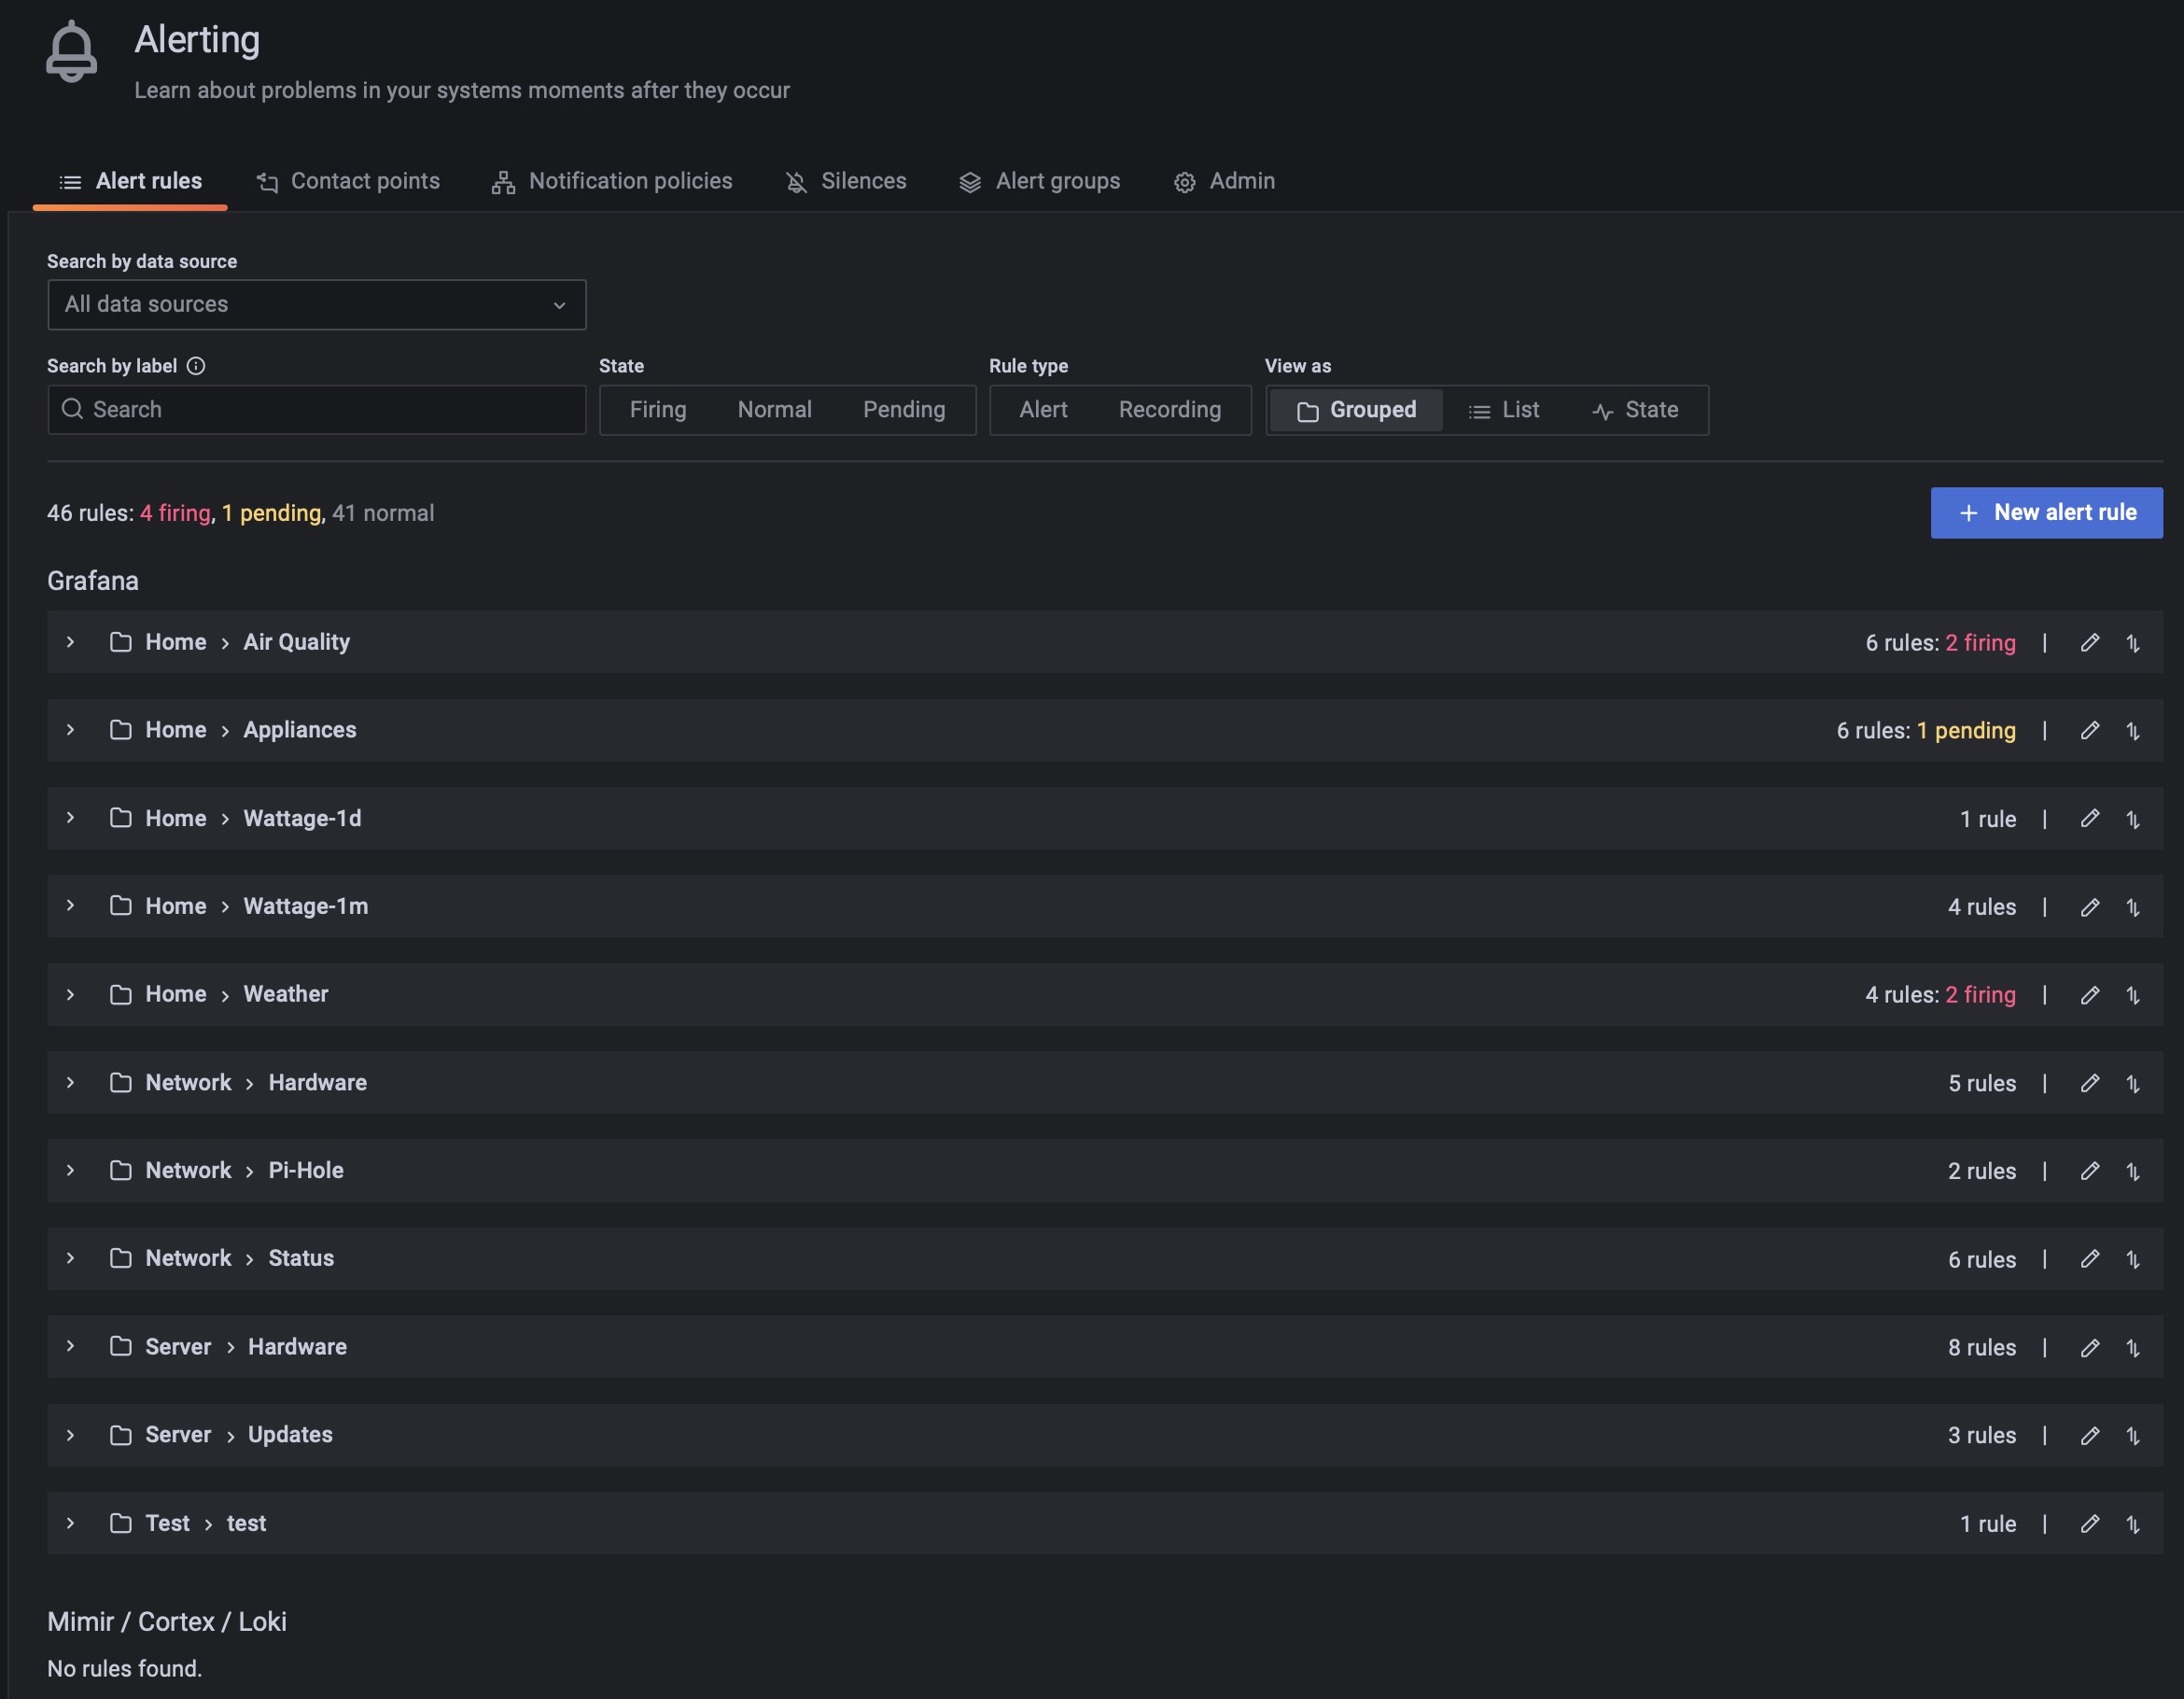
Grafana Alerts Folders and Groups
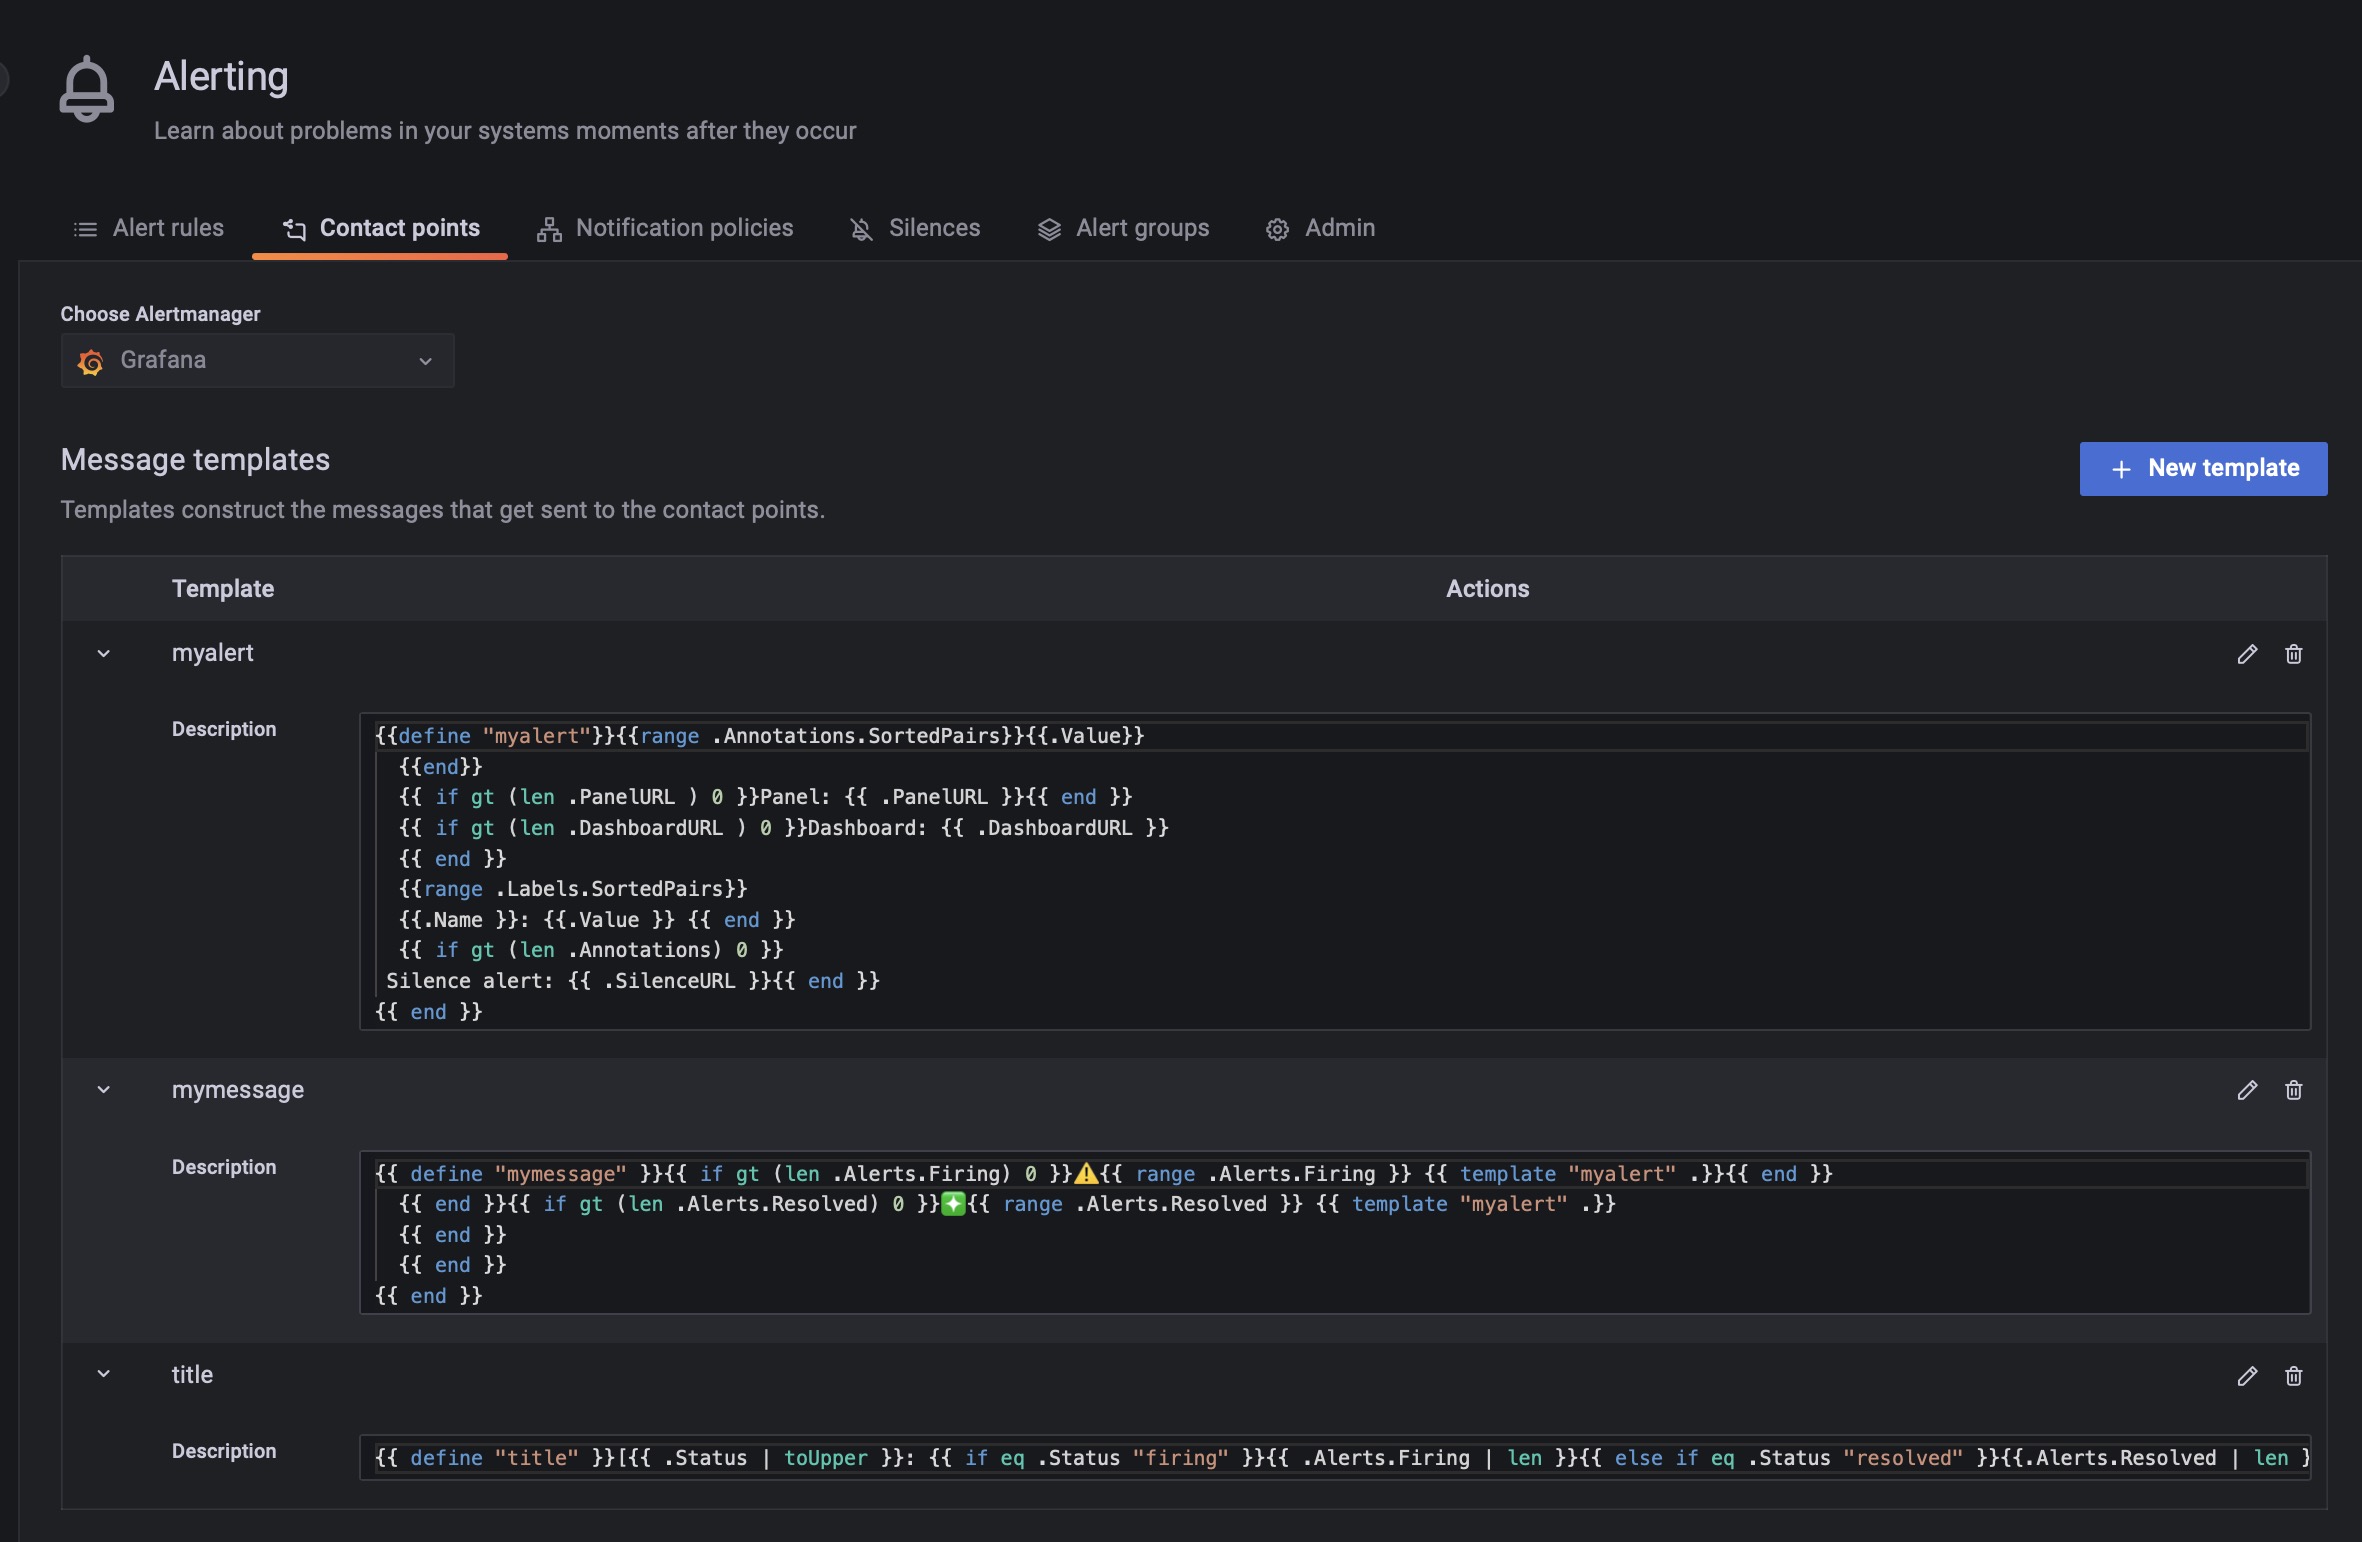
Grafana Contact Points
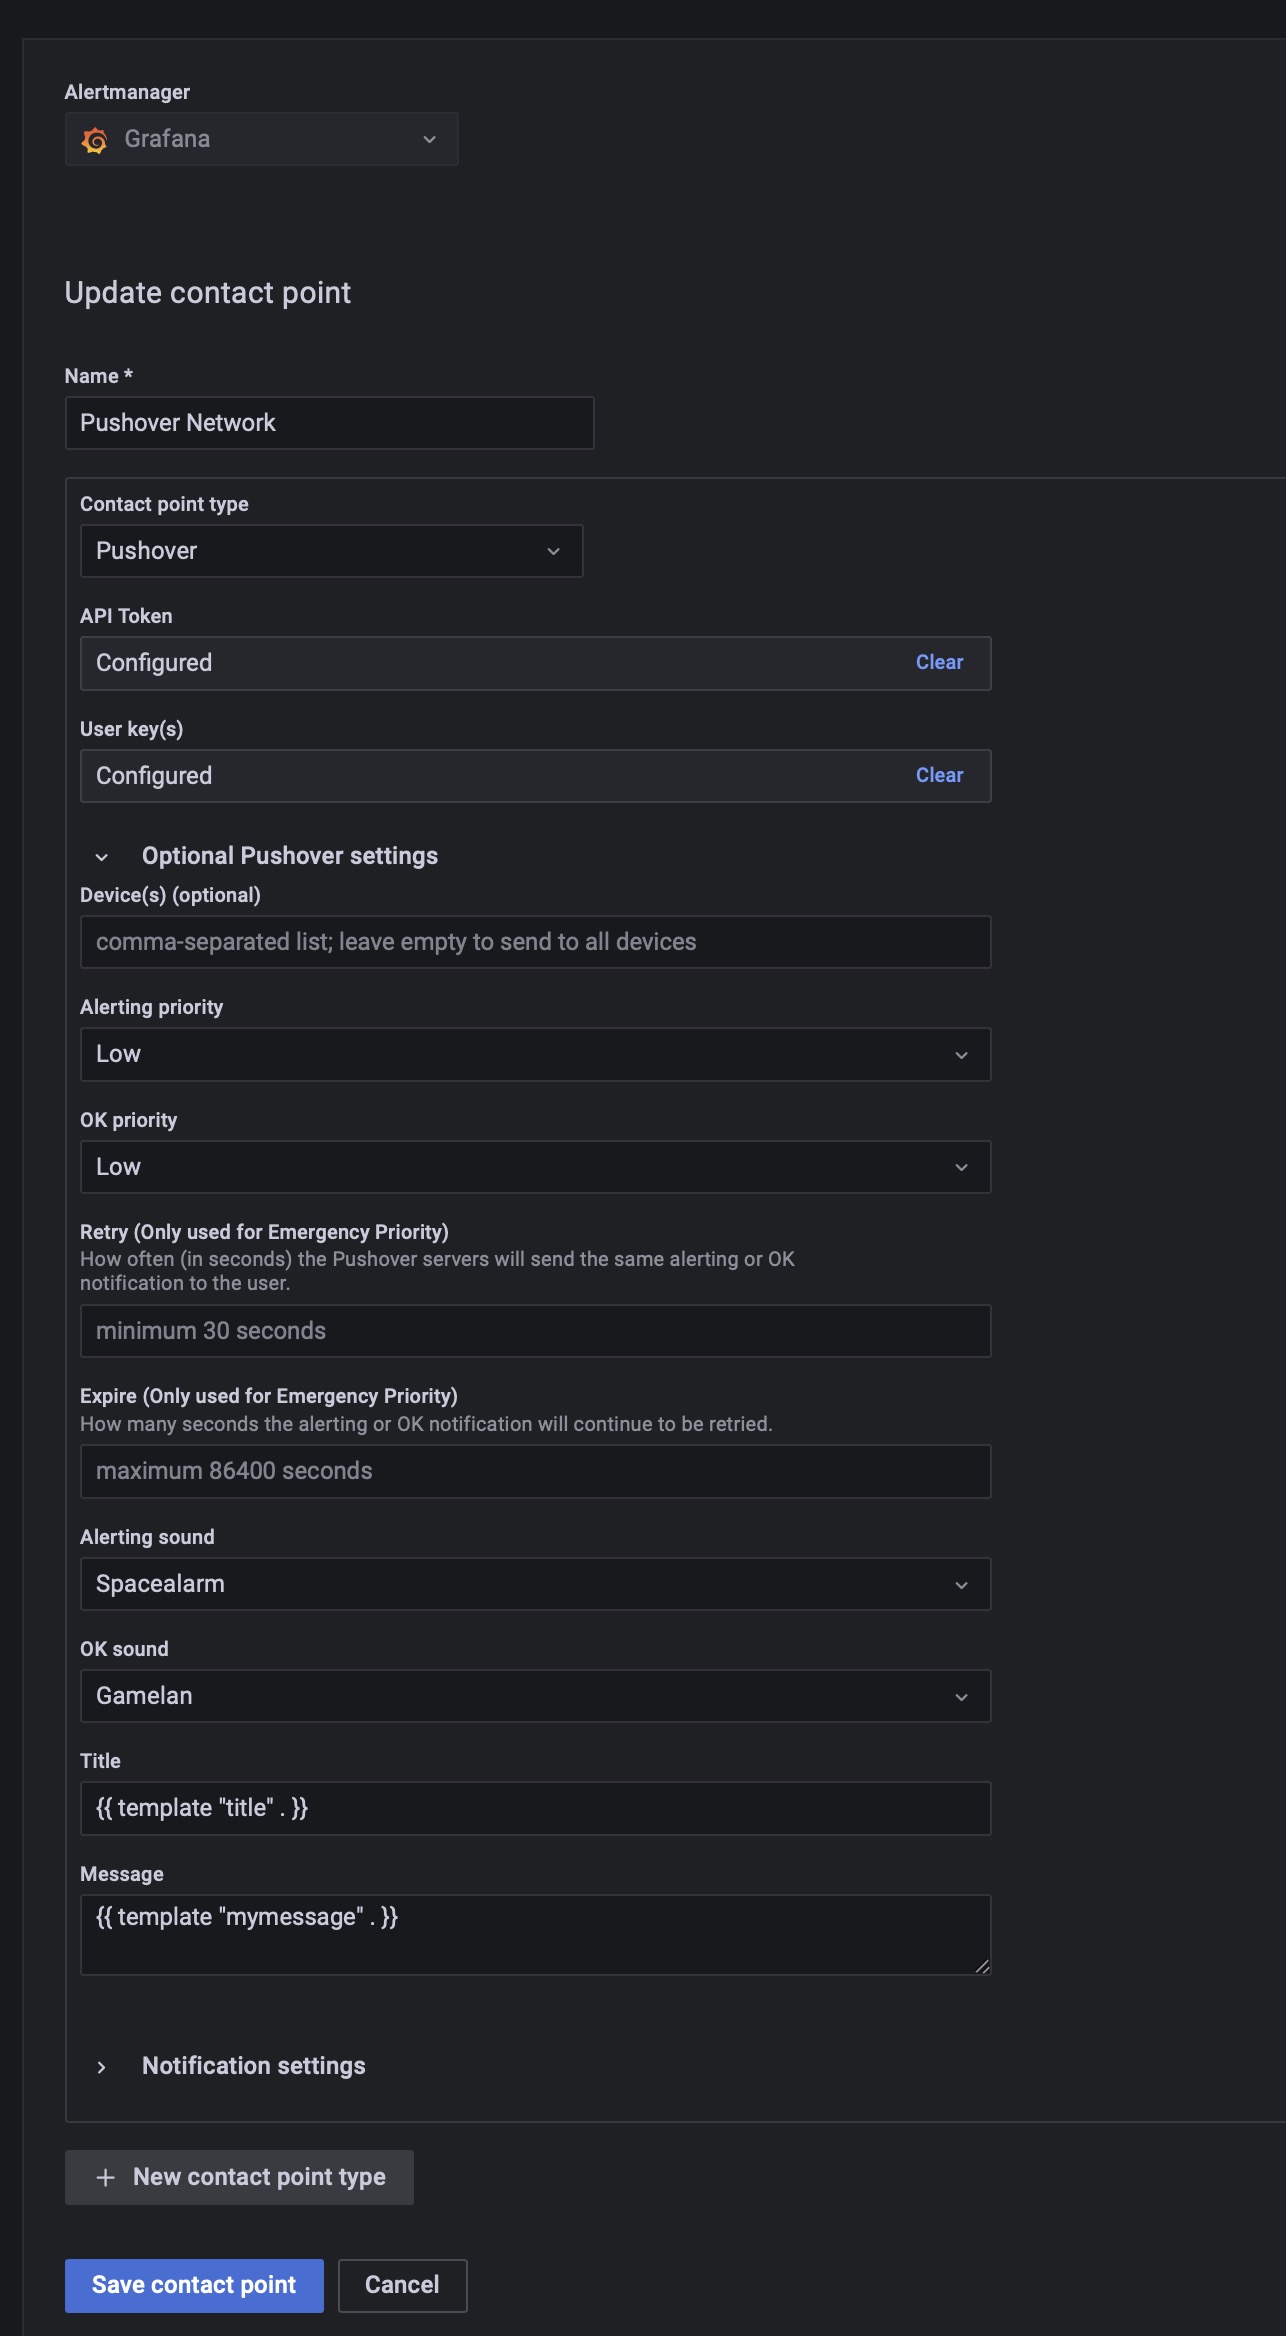
A single Pushover instance
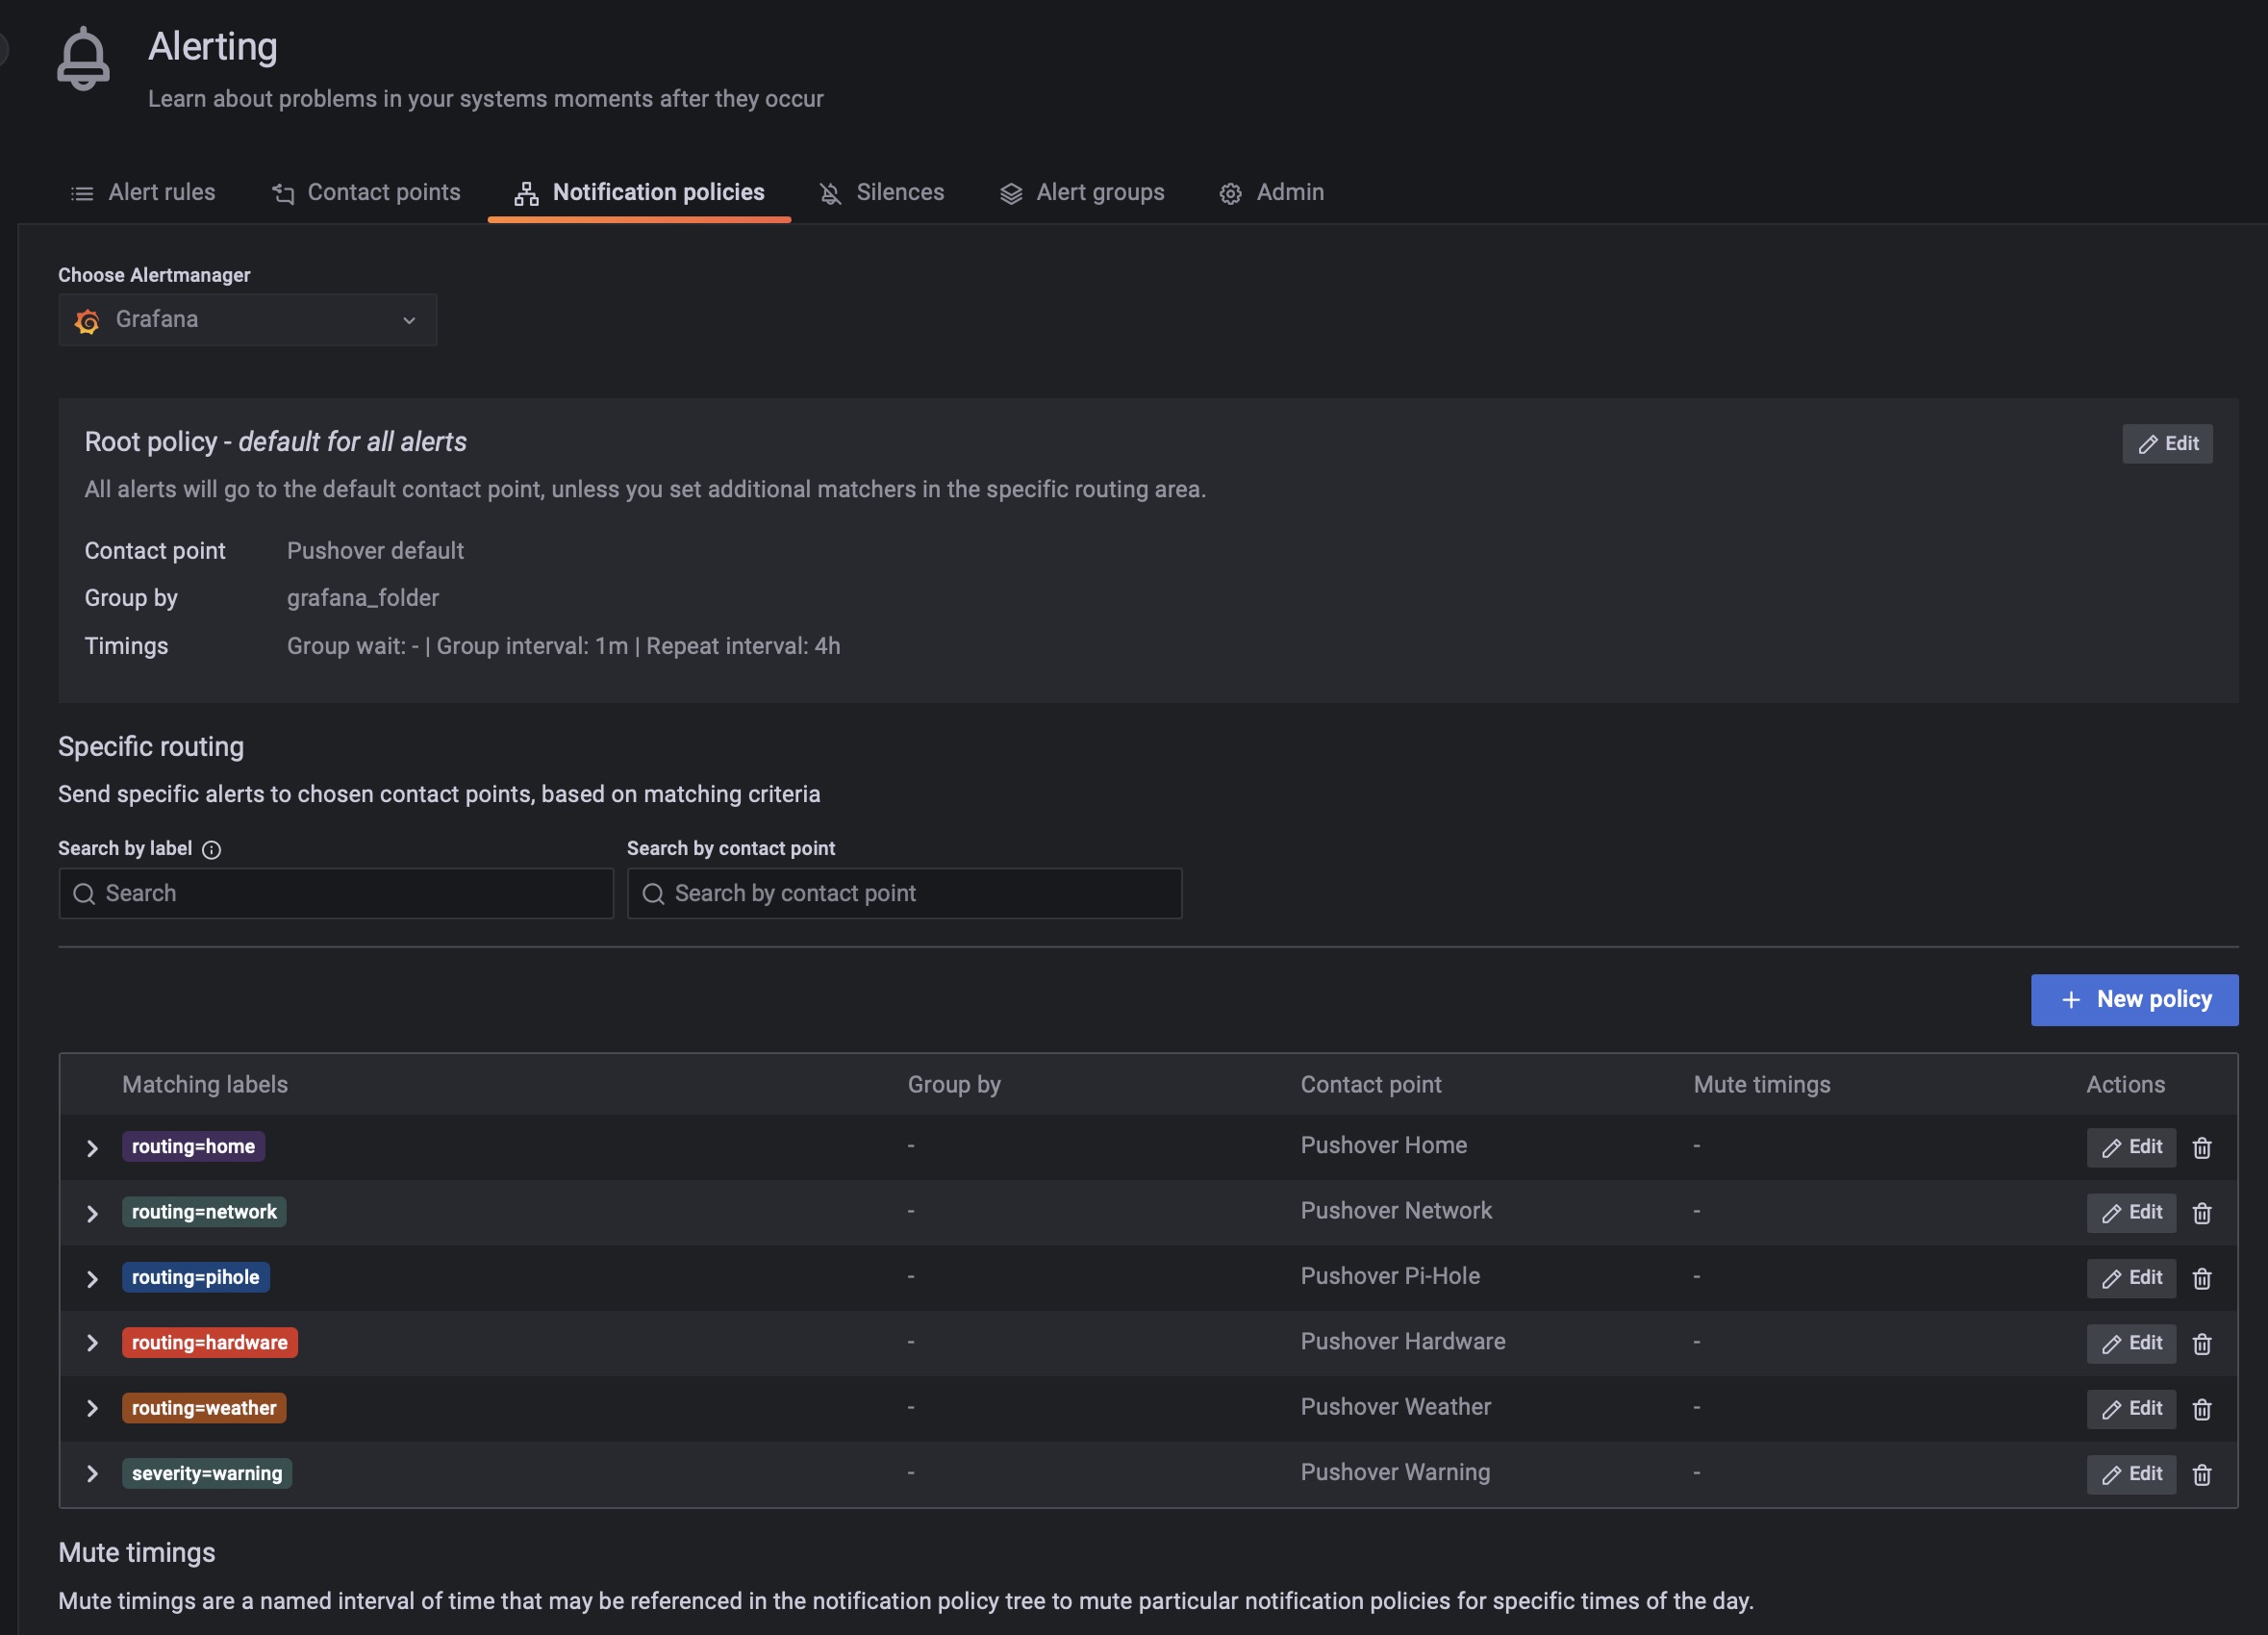
Grafana Notification policies
Okay, then you have to create the alert layout with the code:
{% highlight scala %} {% raw %} {define “myalert”}}{{range .Annotations.SortedPairs}}{{.Value}} {{end}} {{ if gt (len .PanelURL ) 0 }}Panel: {{ .PanelURL }}{{ end }} {{ if gt (len .DashboardURL ) 0 }}Dashboard: {{ .DashboardURL }} {{ end }} {{range .Labels.SortedPairs}} {{.Name }}: {{.Value }} {{ end }} {{ if gt (len .Annotations) 0 }} Silence alert: {{ .SilenceURL }}{{ end }} {{ end }} {% endraw %} {% endhighlight %}
…a new message layout
{% highlight scala %} {% raw %} {{ define “mymessage” }}{{ if gt (len .Alerts.Firing) 0 }}⚠️{{ range .Alerts.Firing }} {{ template “myalert” .}}{{ end }} {{ end }}{{ if gt (len .Alerts.Resolved) 0 }}❇️{{ range .Alerts.Resolved }} {{ template “myalert” .}} {{ end }} {{ end }} {{ end }} {% endraw %} {% endhighlight %}
with an easy to read title (just the name of the alert)
{% highlight scala %} {% raw %}{{ define “title” }}[{{ .Status | toUpper }}: {{ if eq .Status “firing” }}{{ .Alerts.Firing | len }}{{ else if eq .Status “resolved” }}{{.Alerts.Resolved | len }}{{ end }}] {{ .CommonLabels.severity | toUpper }} {{ .CommonLabels.alertname }}{{ end }} {% endraw %} {% endhighlight %}
Then tell to Pushover to use this layout (repeat this for any instance of Pushover)
{% highlight scala %} {% raw %} {{ template “mymessage” . }} {% endraw %} {% endhighlight %}
and title of course
{% highlight scala %} {% raw %} {{ template “title” . }} {% endraw %} {% endhighlight %}
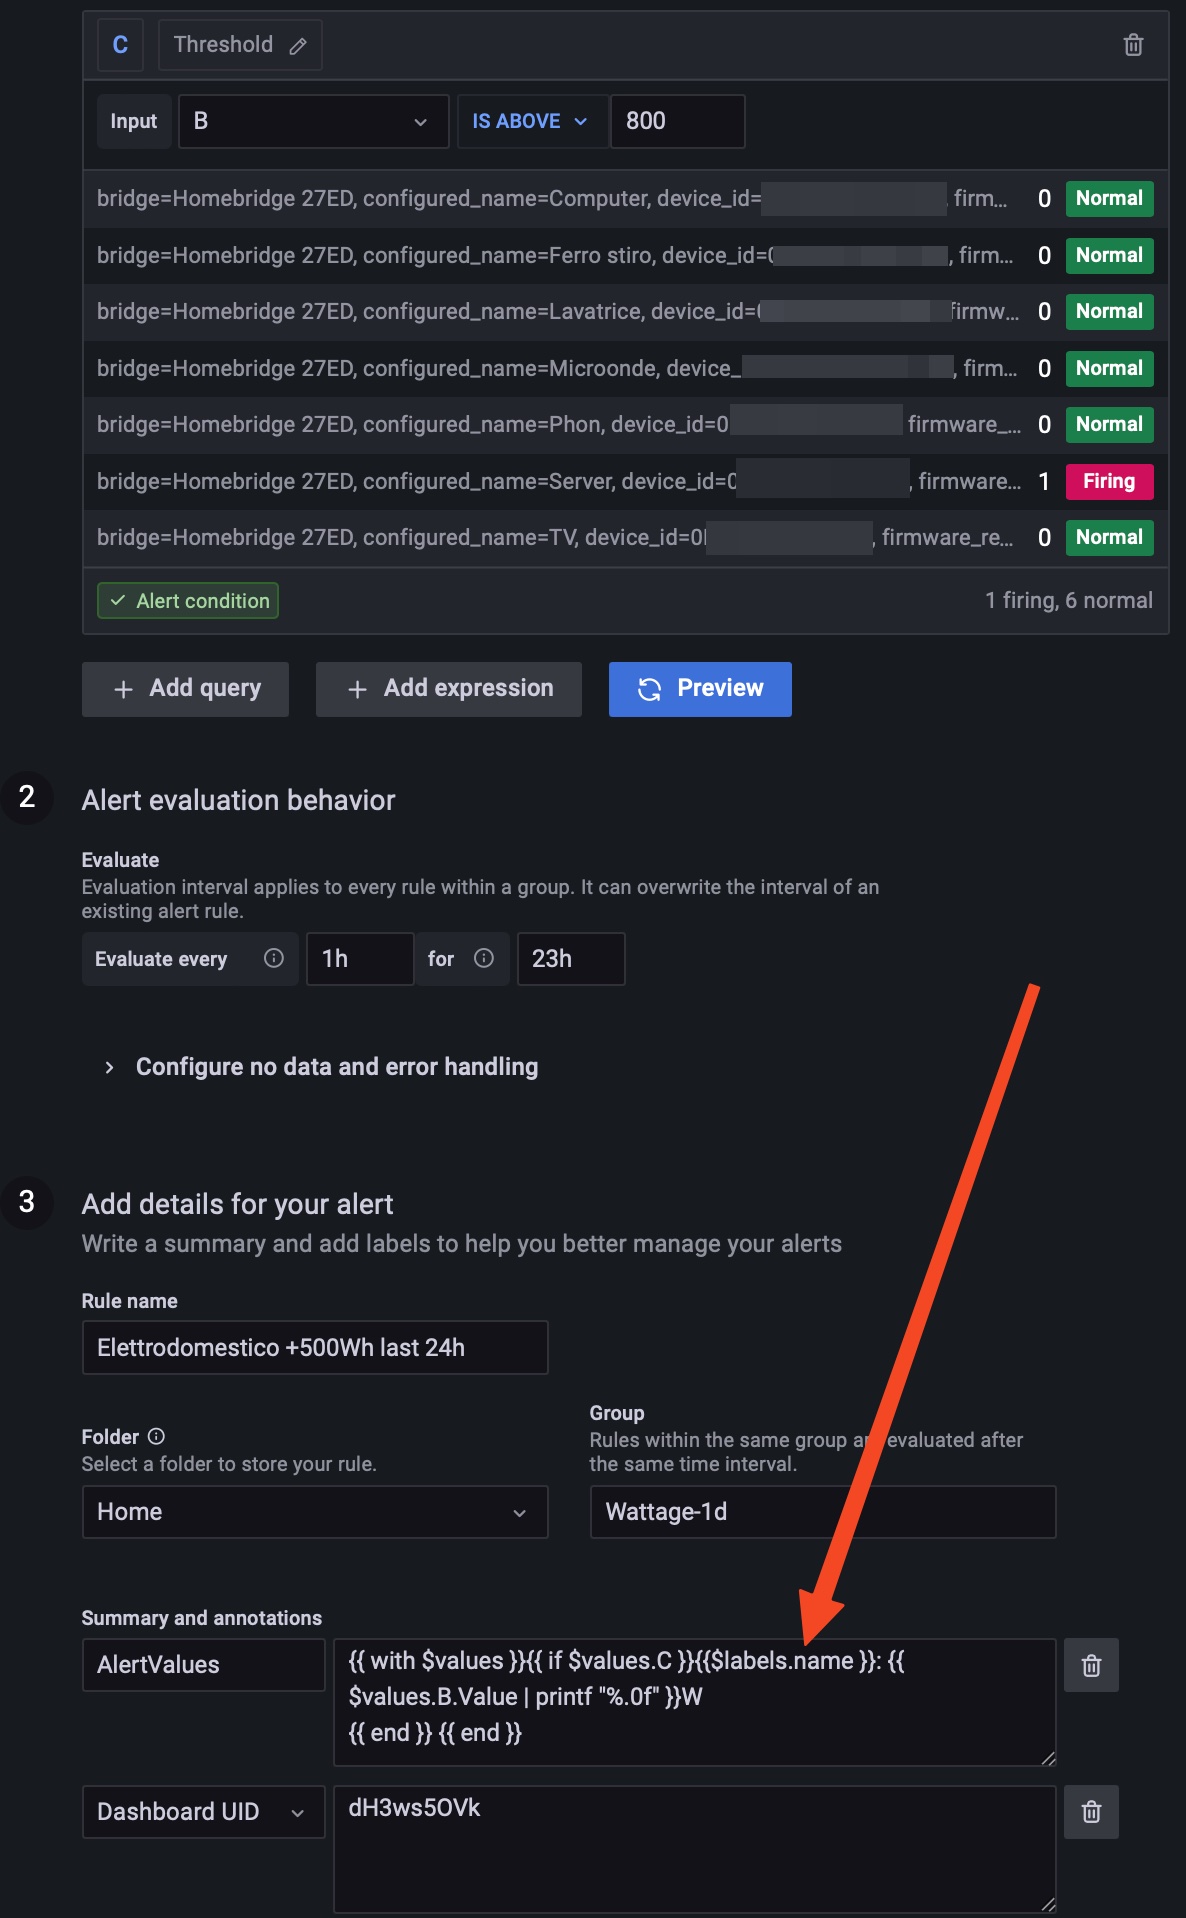
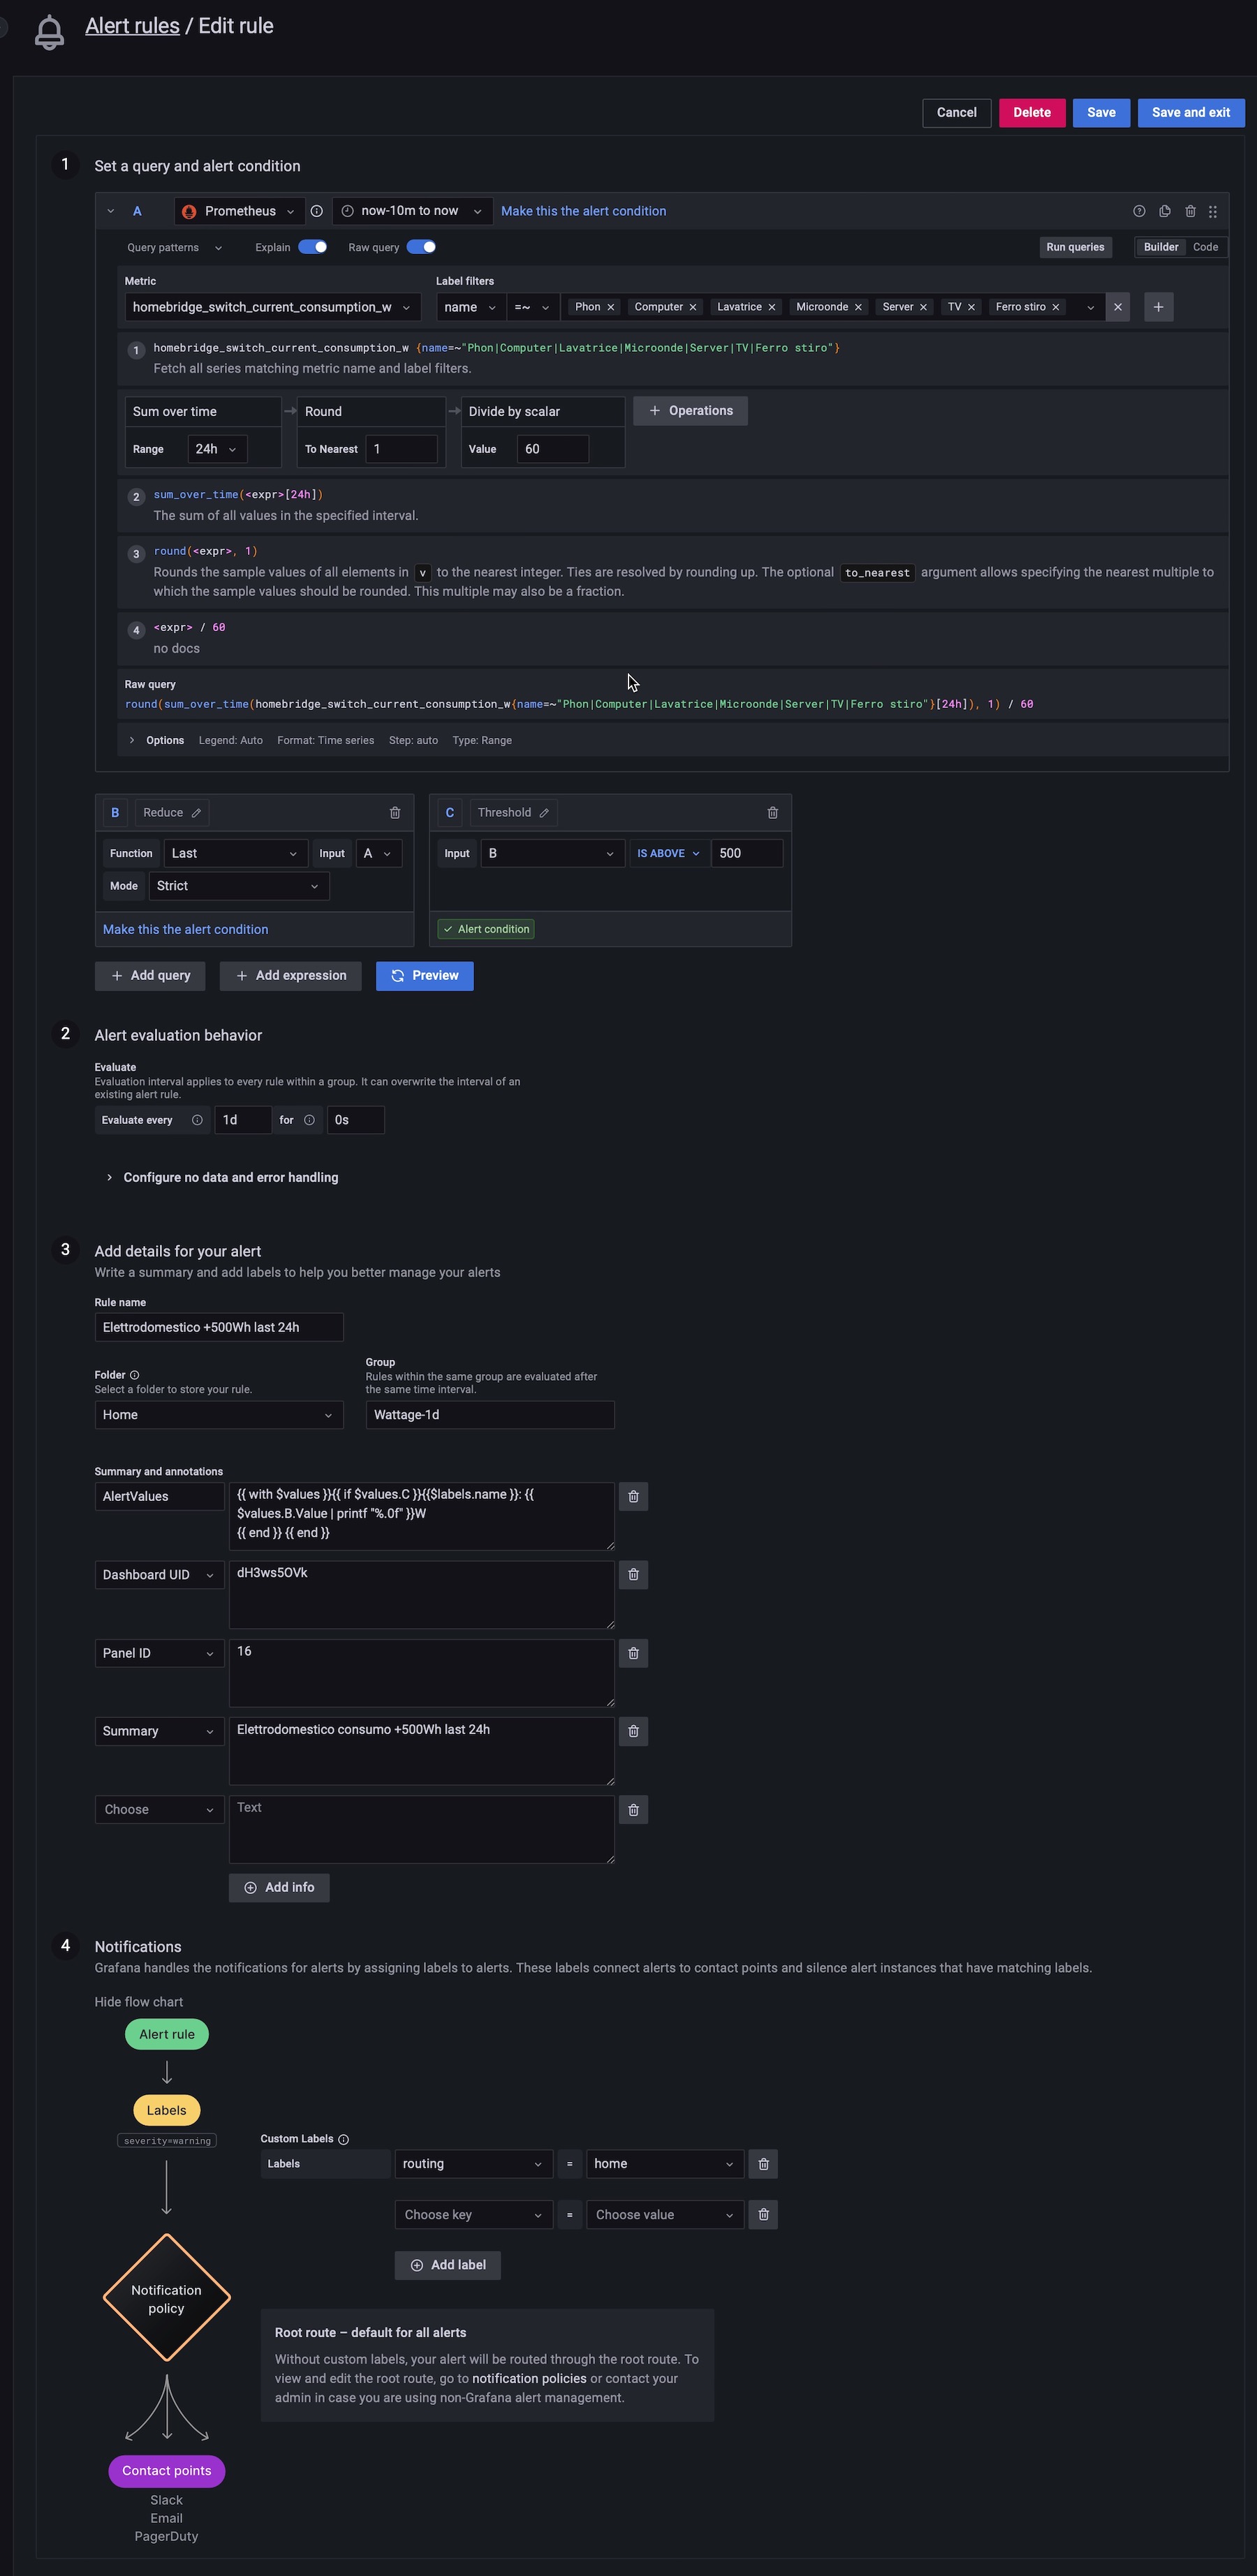
And last, call the query in your alert, using this code in a new value called AlertValues:
{% highlight scala %} {% raw %} {{ with $values }}{{ if $values.C }}Ping: {{ $values.B.Value | printf “%.1f” }}ms {{ end }} {{ end }} {% endraw %} {% endhighlight %}
Initially the value returned by Grafana could be a weird, or long, string, like this:

Fortunately using the the printf %.1f Grafana know how many decimal values include, use 0 if you don’t want decimals and obviously you have to change the name of CPU and the symbol.
1 decimal example:
You can also use {% highlight scala %} {% raw %} {{$labels.nameXYZ}} {% endraw %} {% endhighlight %} if you want to use the labels name. This is useful when you have an alert with a threshold that can trigger more than one push, for example I’m using the labels for an alert that triggers every home appliance that is consumpting +1Kw
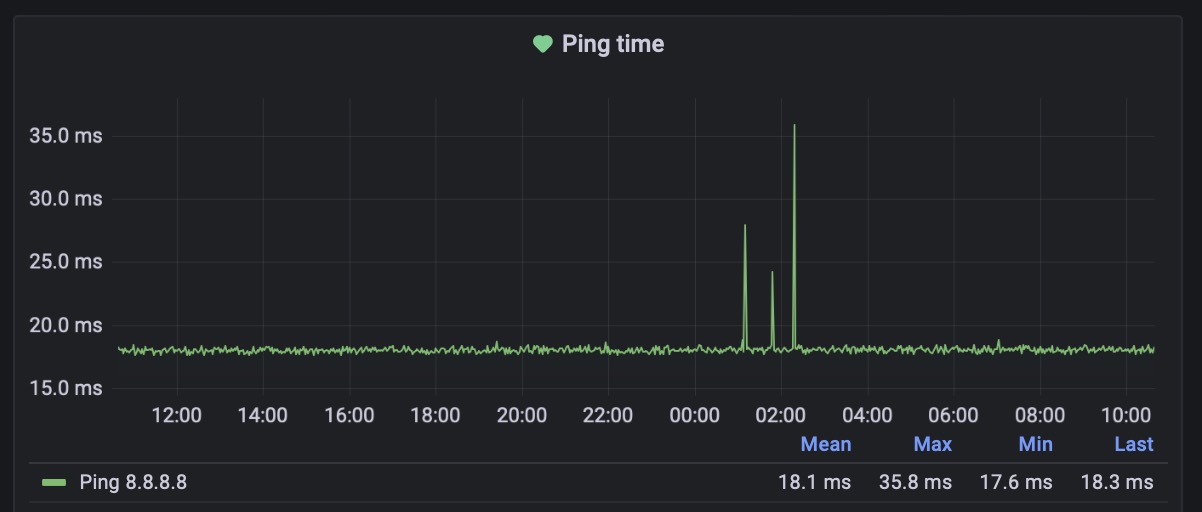
After you have to add the Dashboard ID, the Panel ID (it will add a super-cool hearth to your linked panel. Green if it’s okay, yellow in evaluation and broken if over the threshold)
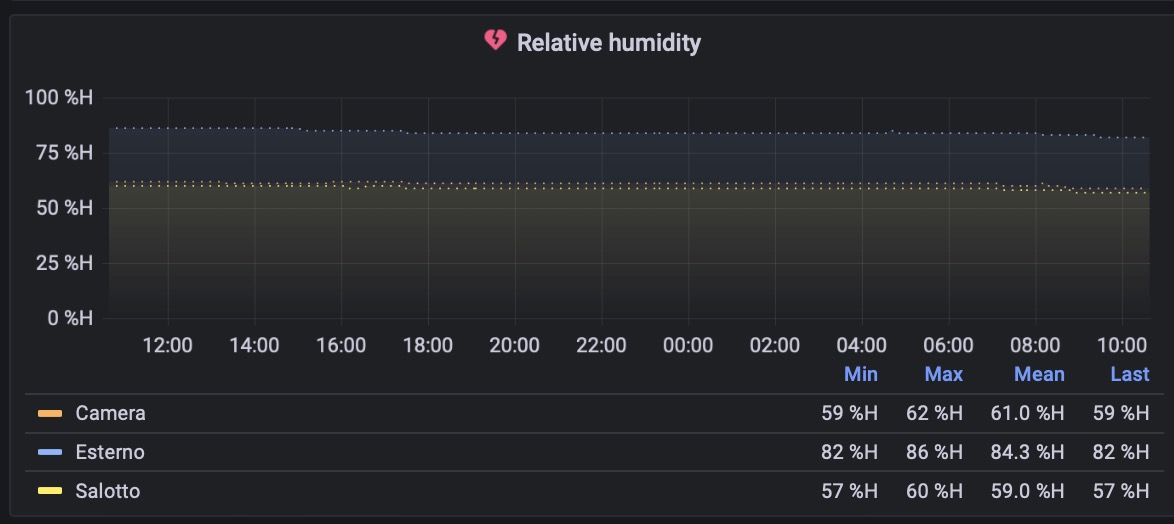
and a summary, if you want to explain your alert at a first glance.
And if you want to use a different Pushover account, with different sounds and icon, you can add a Rule, to a previously created Pushover alternative account.
Finally his will be a rule configured:
the push delivered
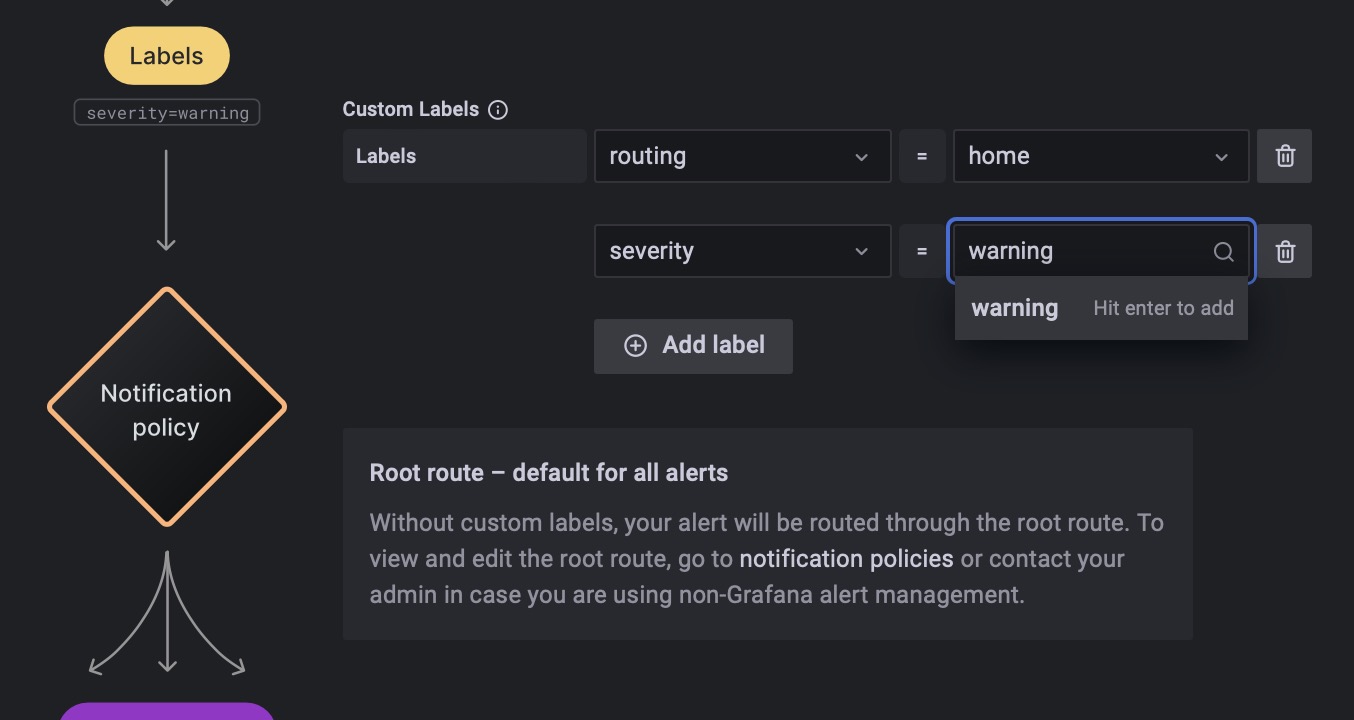
Usually these notifications are delivered quietly to my devices, just to understand that “something is going on” but if I want to receive an important alert, I just have to create a label for the priority, or change the routing of this alert, and then give to this alert a label/routing that you have created under the “Notification policies” tab:
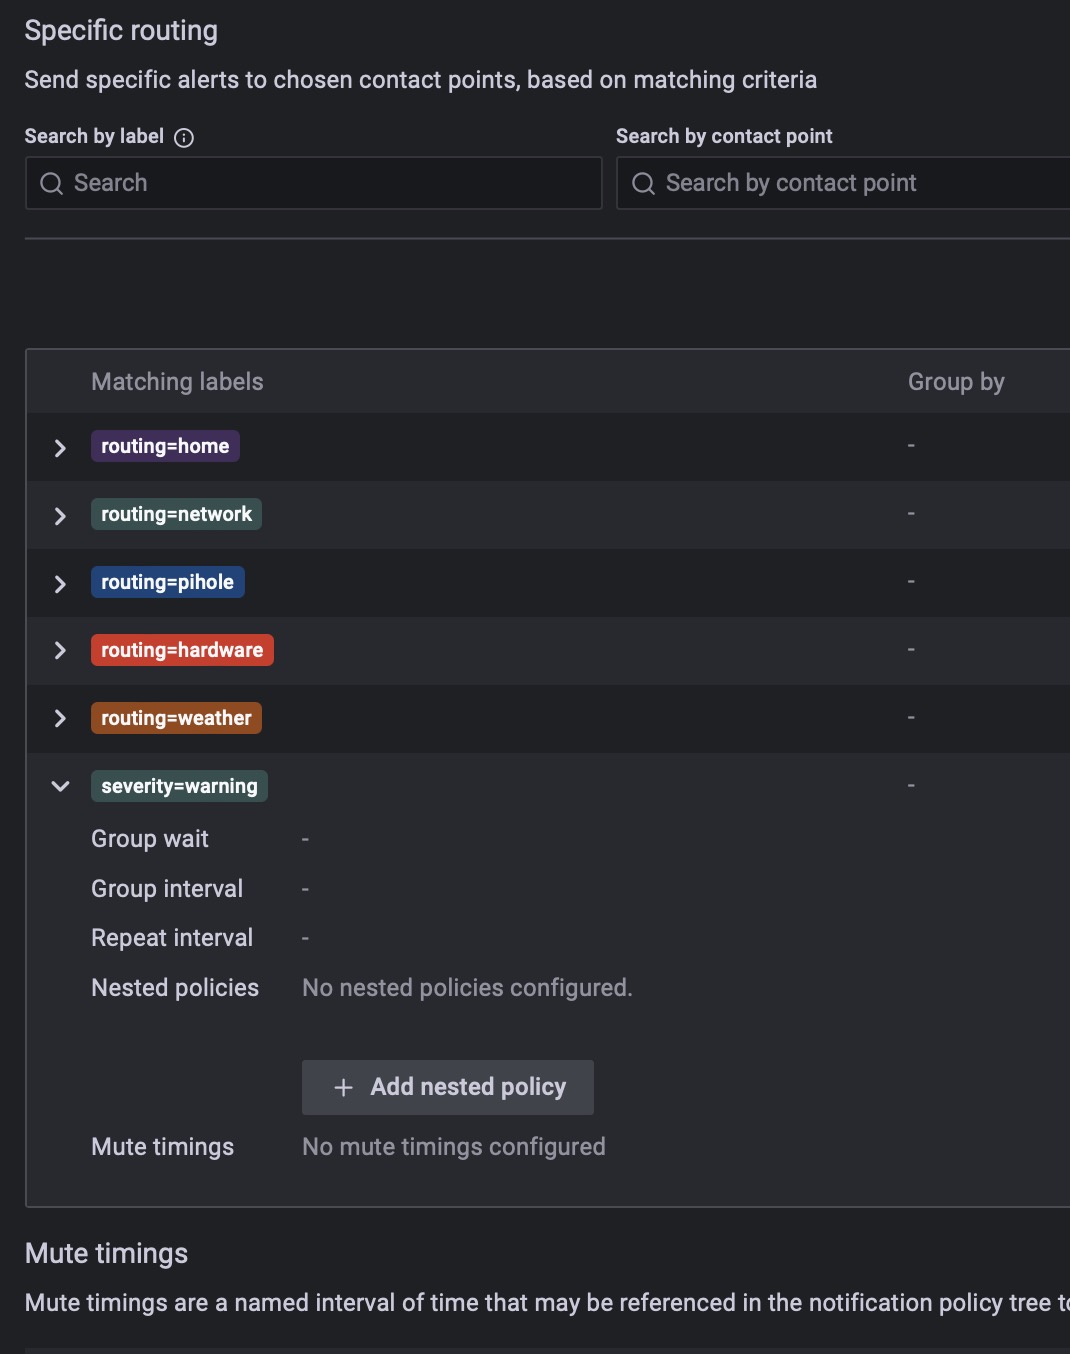
And this notification will be delivered to your devices with the alert sound (high priority or different sound) you have configured in the Contact Points (Pushover instances) tab of Grafana.
All inside this post can sound annoying at the beginning, because if you configure the alerts to be triggered very often, you will receive tons of notifications. Instead, check the usage in Grafana and then set a threshold quite high that makes sense to be triggered only if it’s really important.
Here are almost all my alerts. Consider that they’re still “under construction”, I need to better understand some things in order to tune the alerts.
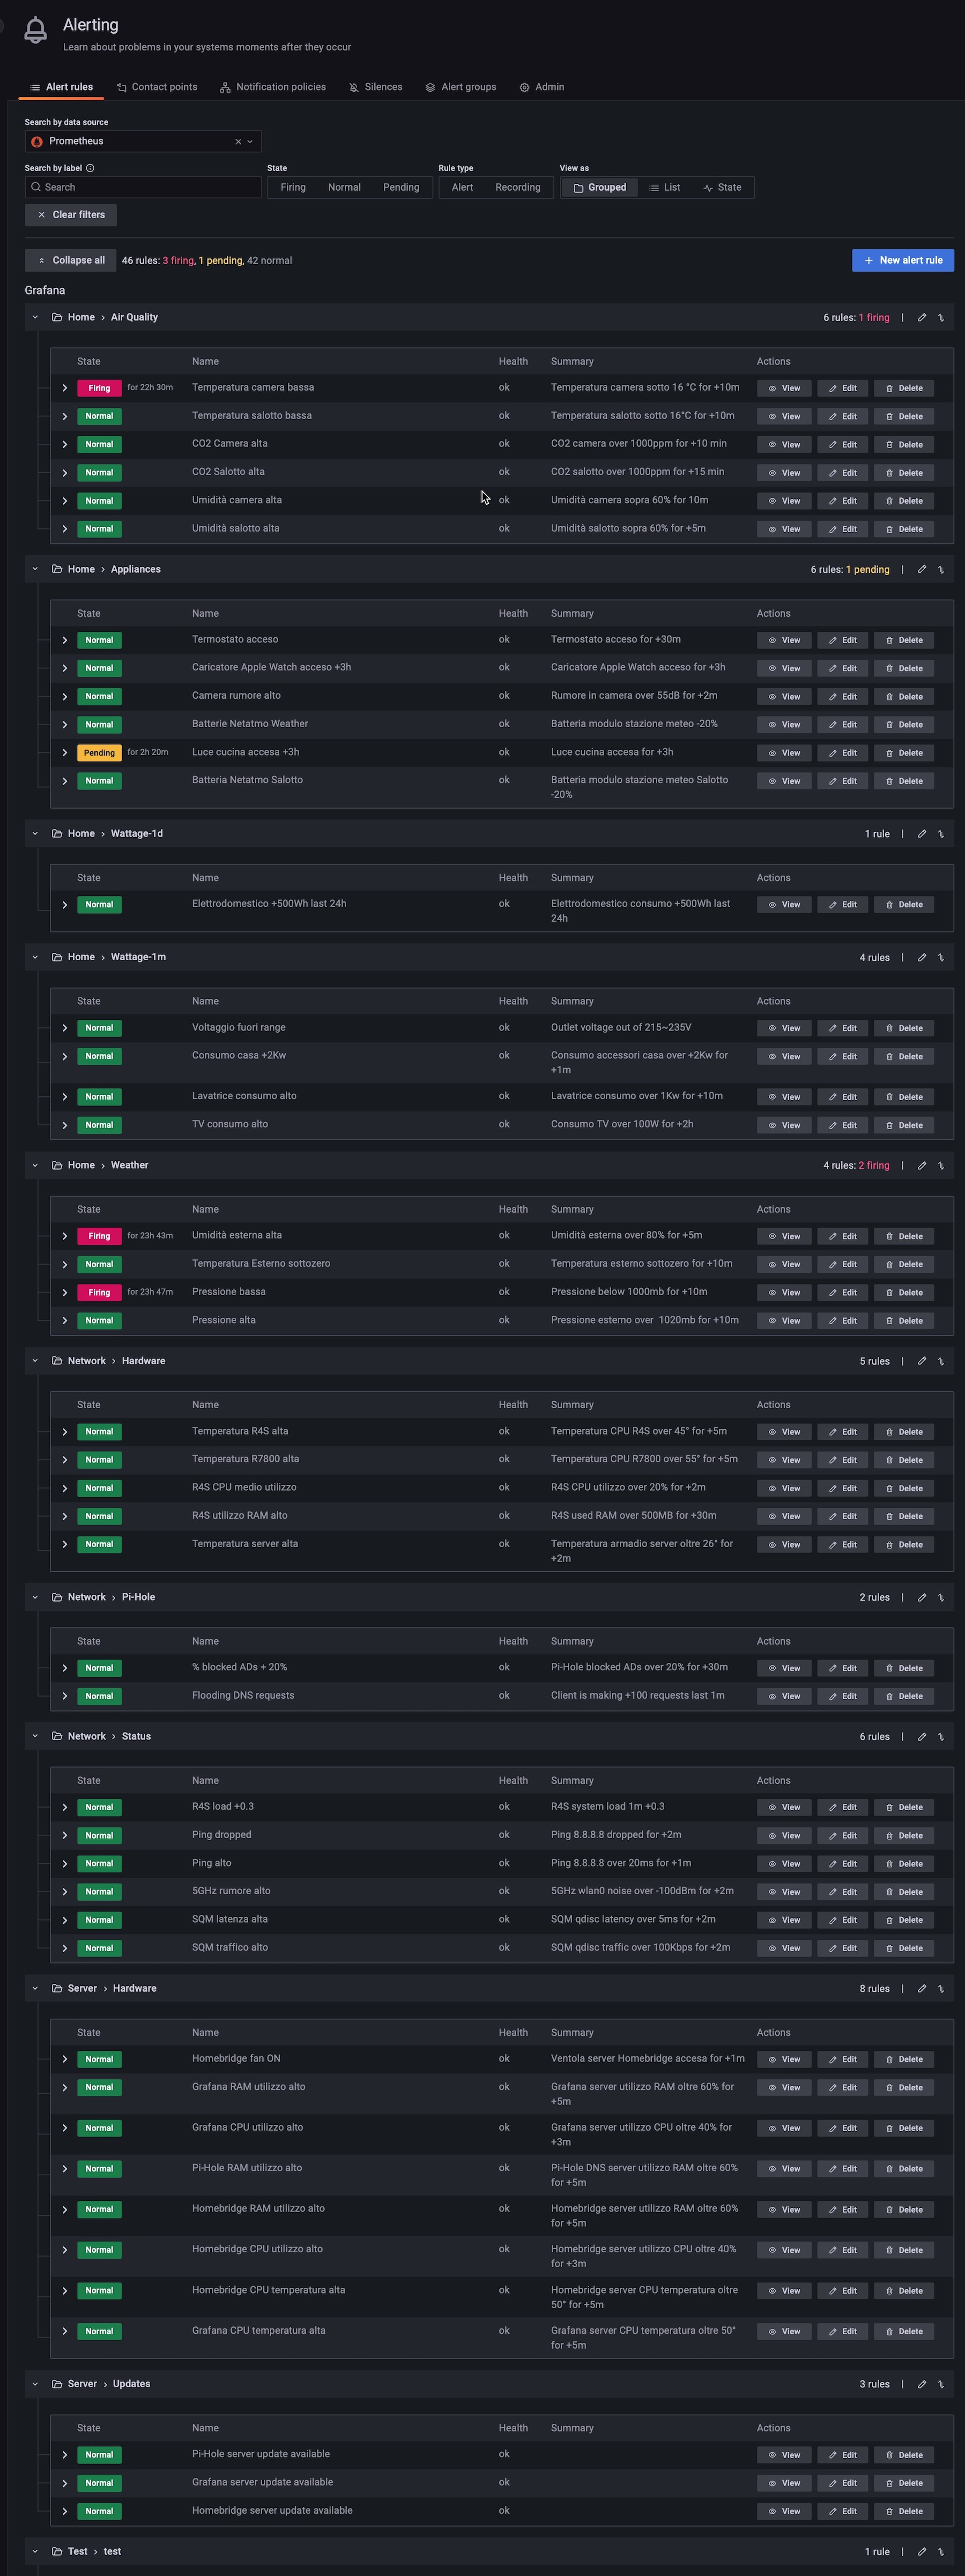
The annoying thing is that -at the moment- there isn’t a way to duplicate quickly an alert, so you have to manually duplicate the query, labels, names, etc… Many people are asking for this, I hope the Grafana devs will include this feature.
Pushover with HomeKit
I’m also using Pushover to get a push notification every time I left my home and the Home app have executed the “I’m leaving home” automation. This because I go out of home without turning off the lights and other stuff (“there’s an app for that”). And before this solution, I was always unsure that all is off.
In this way I can know that the scene “I’m leaving home” has been correctly executed and all the lights and outlets are turned off.
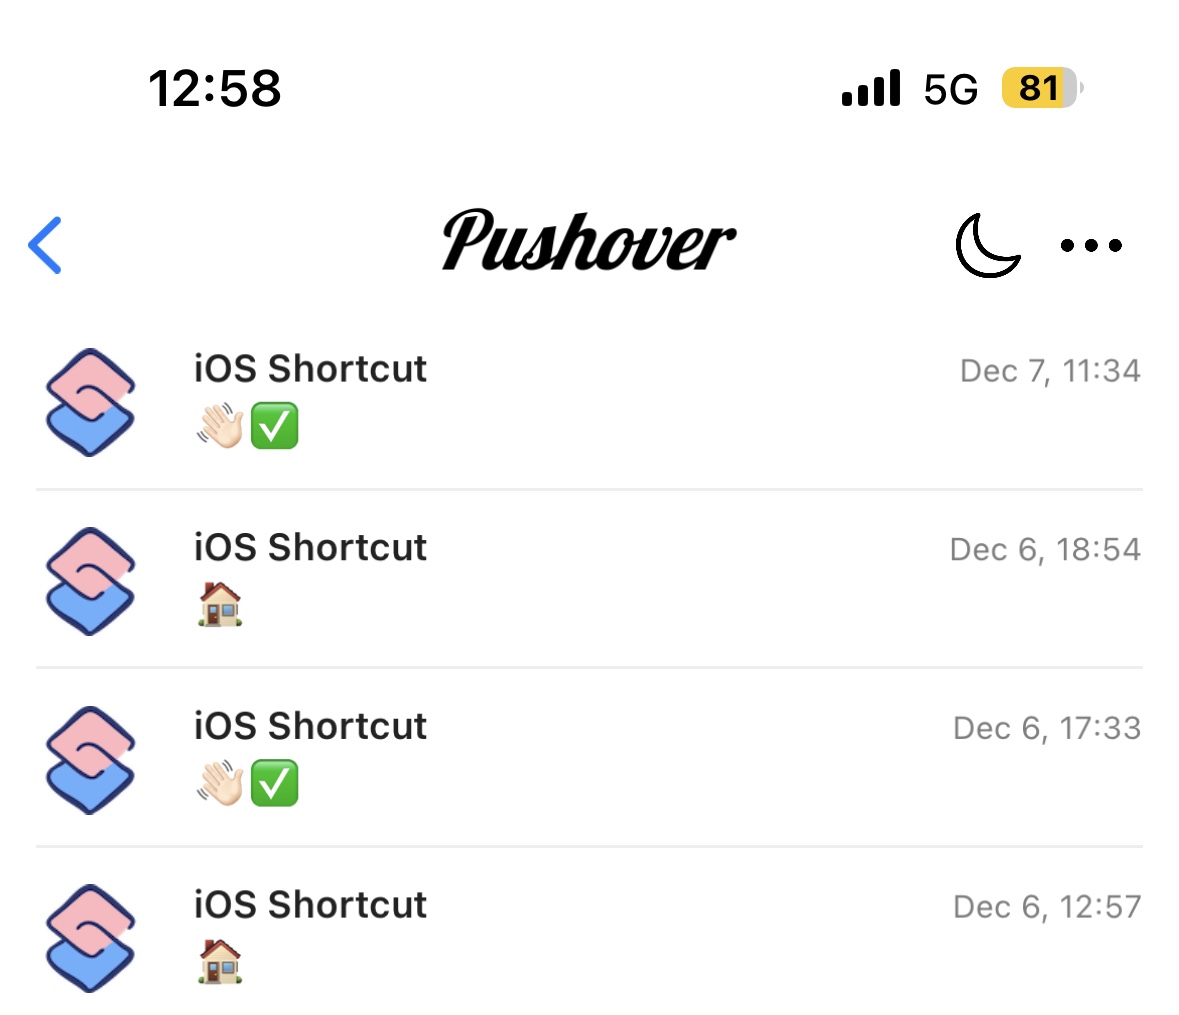
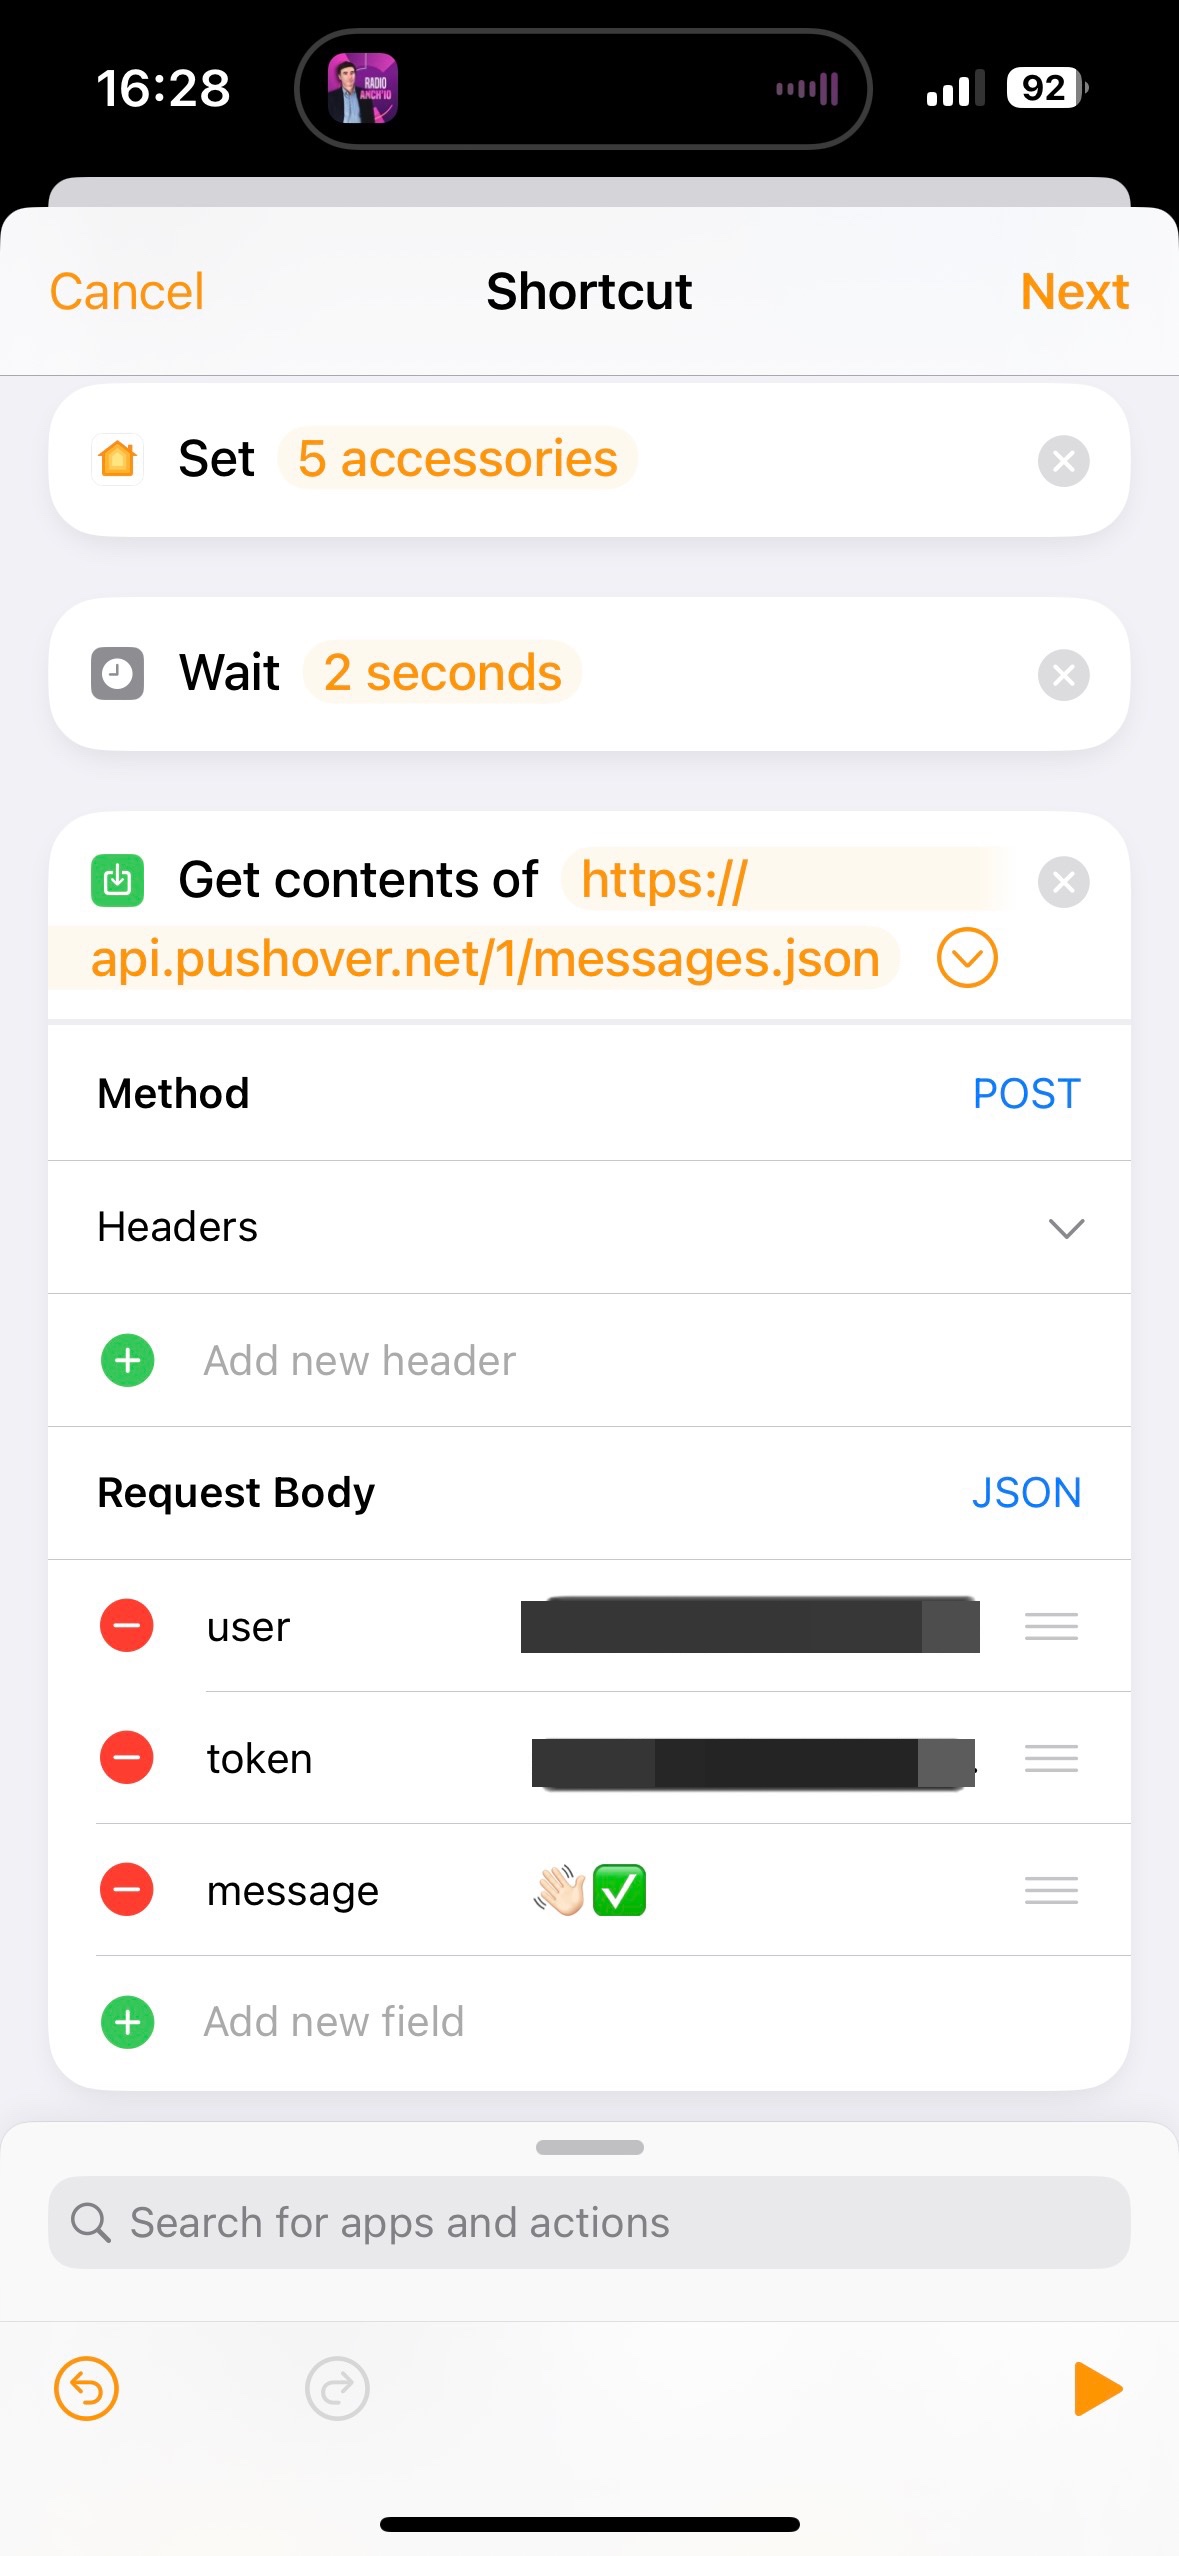
To achieve this, create another app and token in Pushover, then just convert your “I’m leaving home” scene to a shortcut and add a POST call to the Pushover API like the screenshot below:
Conclusion
Obviously this is only an example of the my integration for my environment. I shared some tips so you can take the inspiration and use Pushover to dozens of other services. Like GitHub, Zapier, IFTTT, Homebridge, HomeAssistant, NodeRed, etc… here’s the list: Pushover integrations
And I hope this helped, consider that Grafana has modified its notification system right when I was writing this post (Grafana 9.3). So I had to modify some of my alerts and write again some paragraphs of this post and this added some confusion.
As always, if something is wrong or missing, just write it in the comments. And consider to check the official Grafana documentation and Support Community for other info.
My dashboards
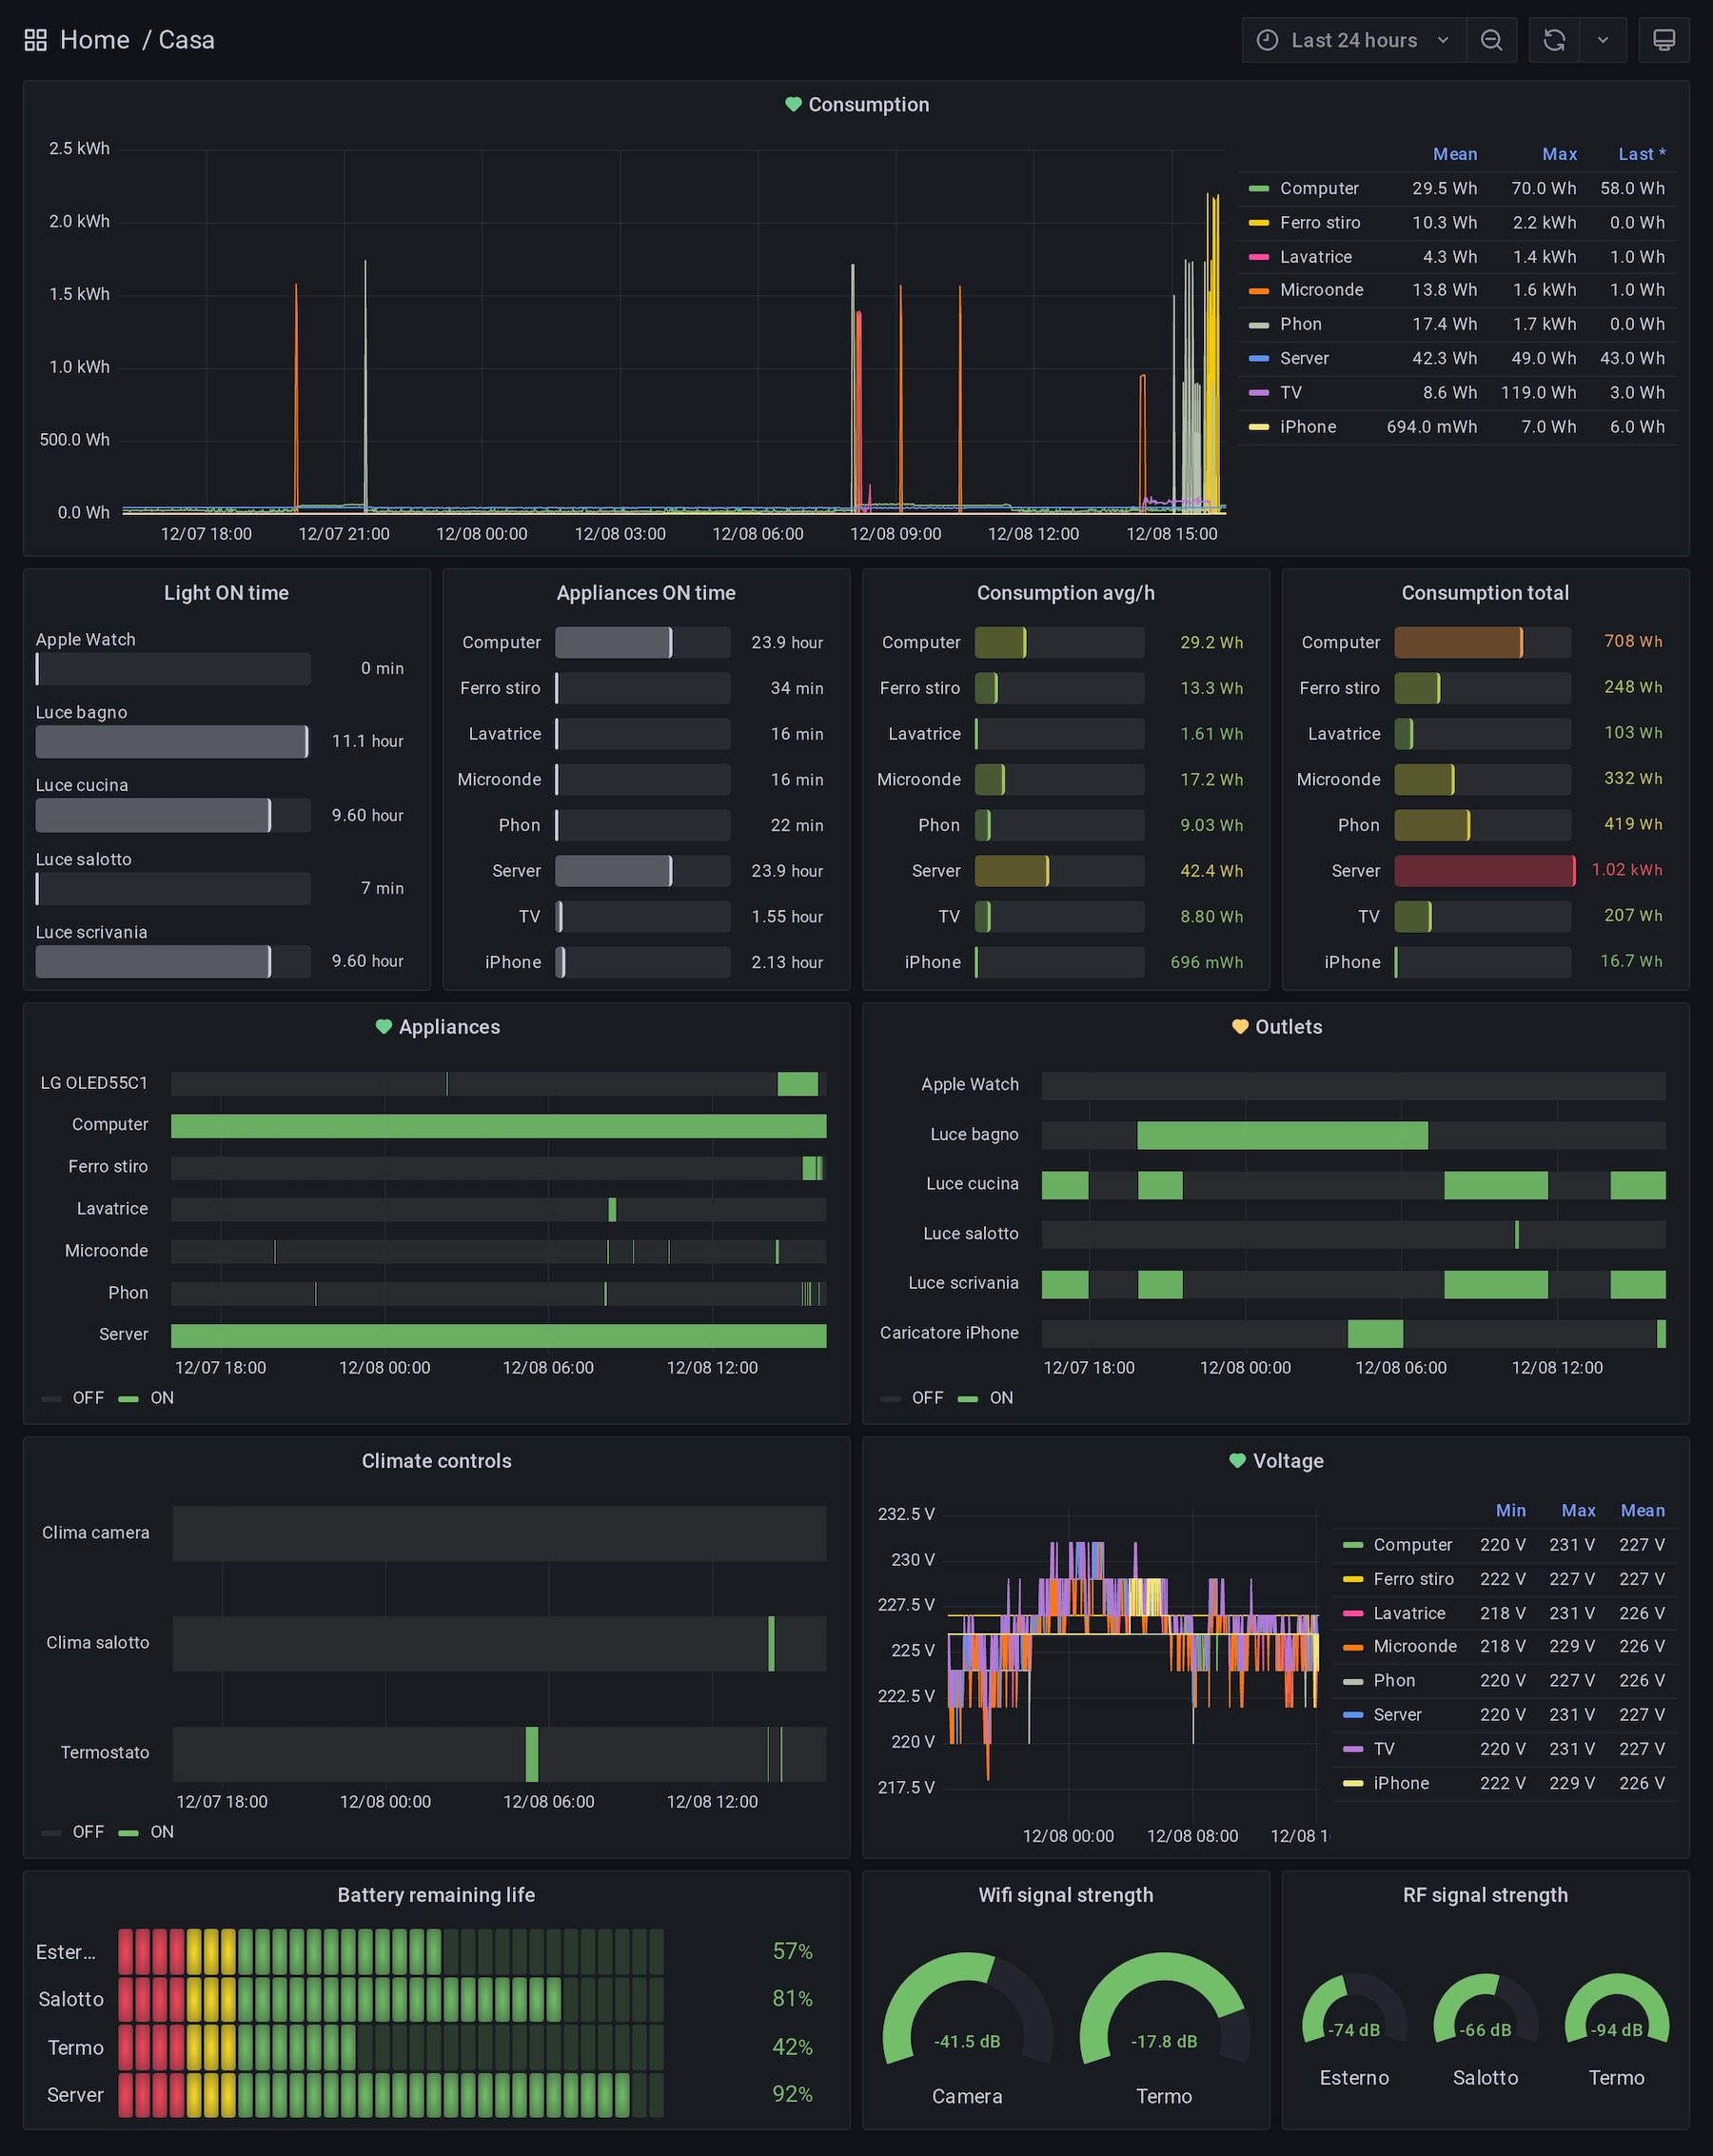
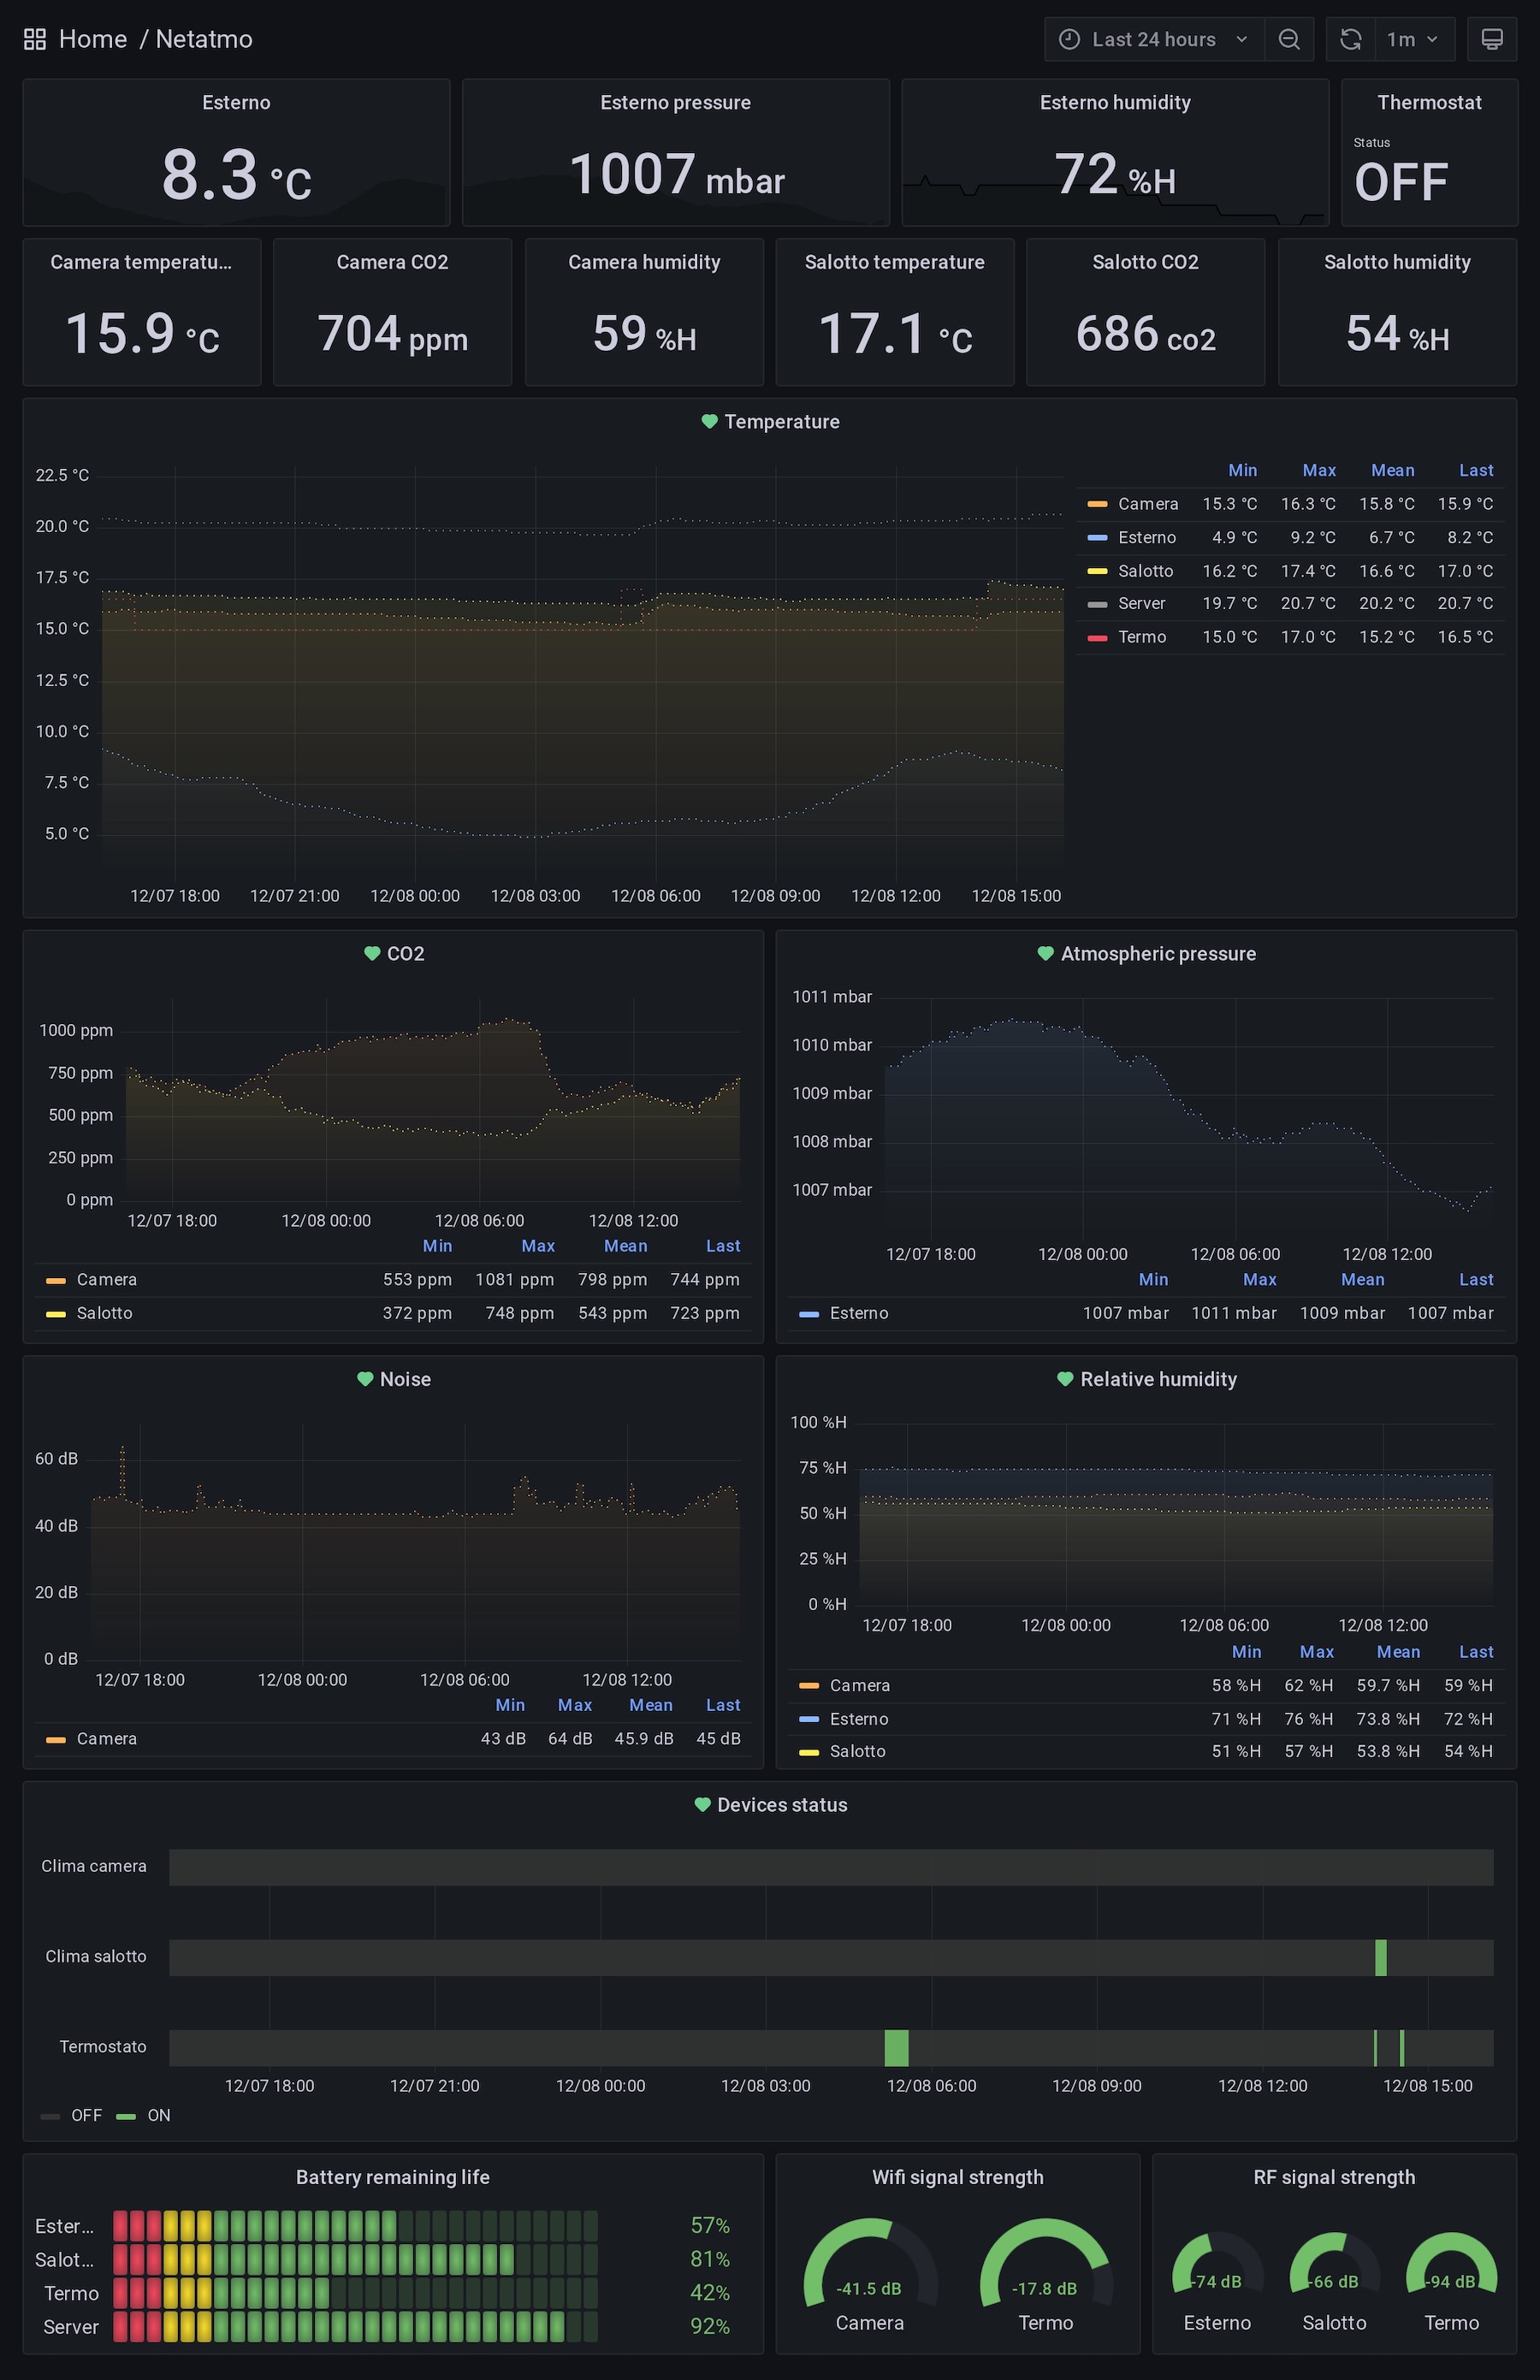
Last thing, I thought that after all these text and images you wish to understand from where I retrieve the data, what are my setup and my pages in Grafana.
Here are my dashboards:
Home:
Network:

Weather:
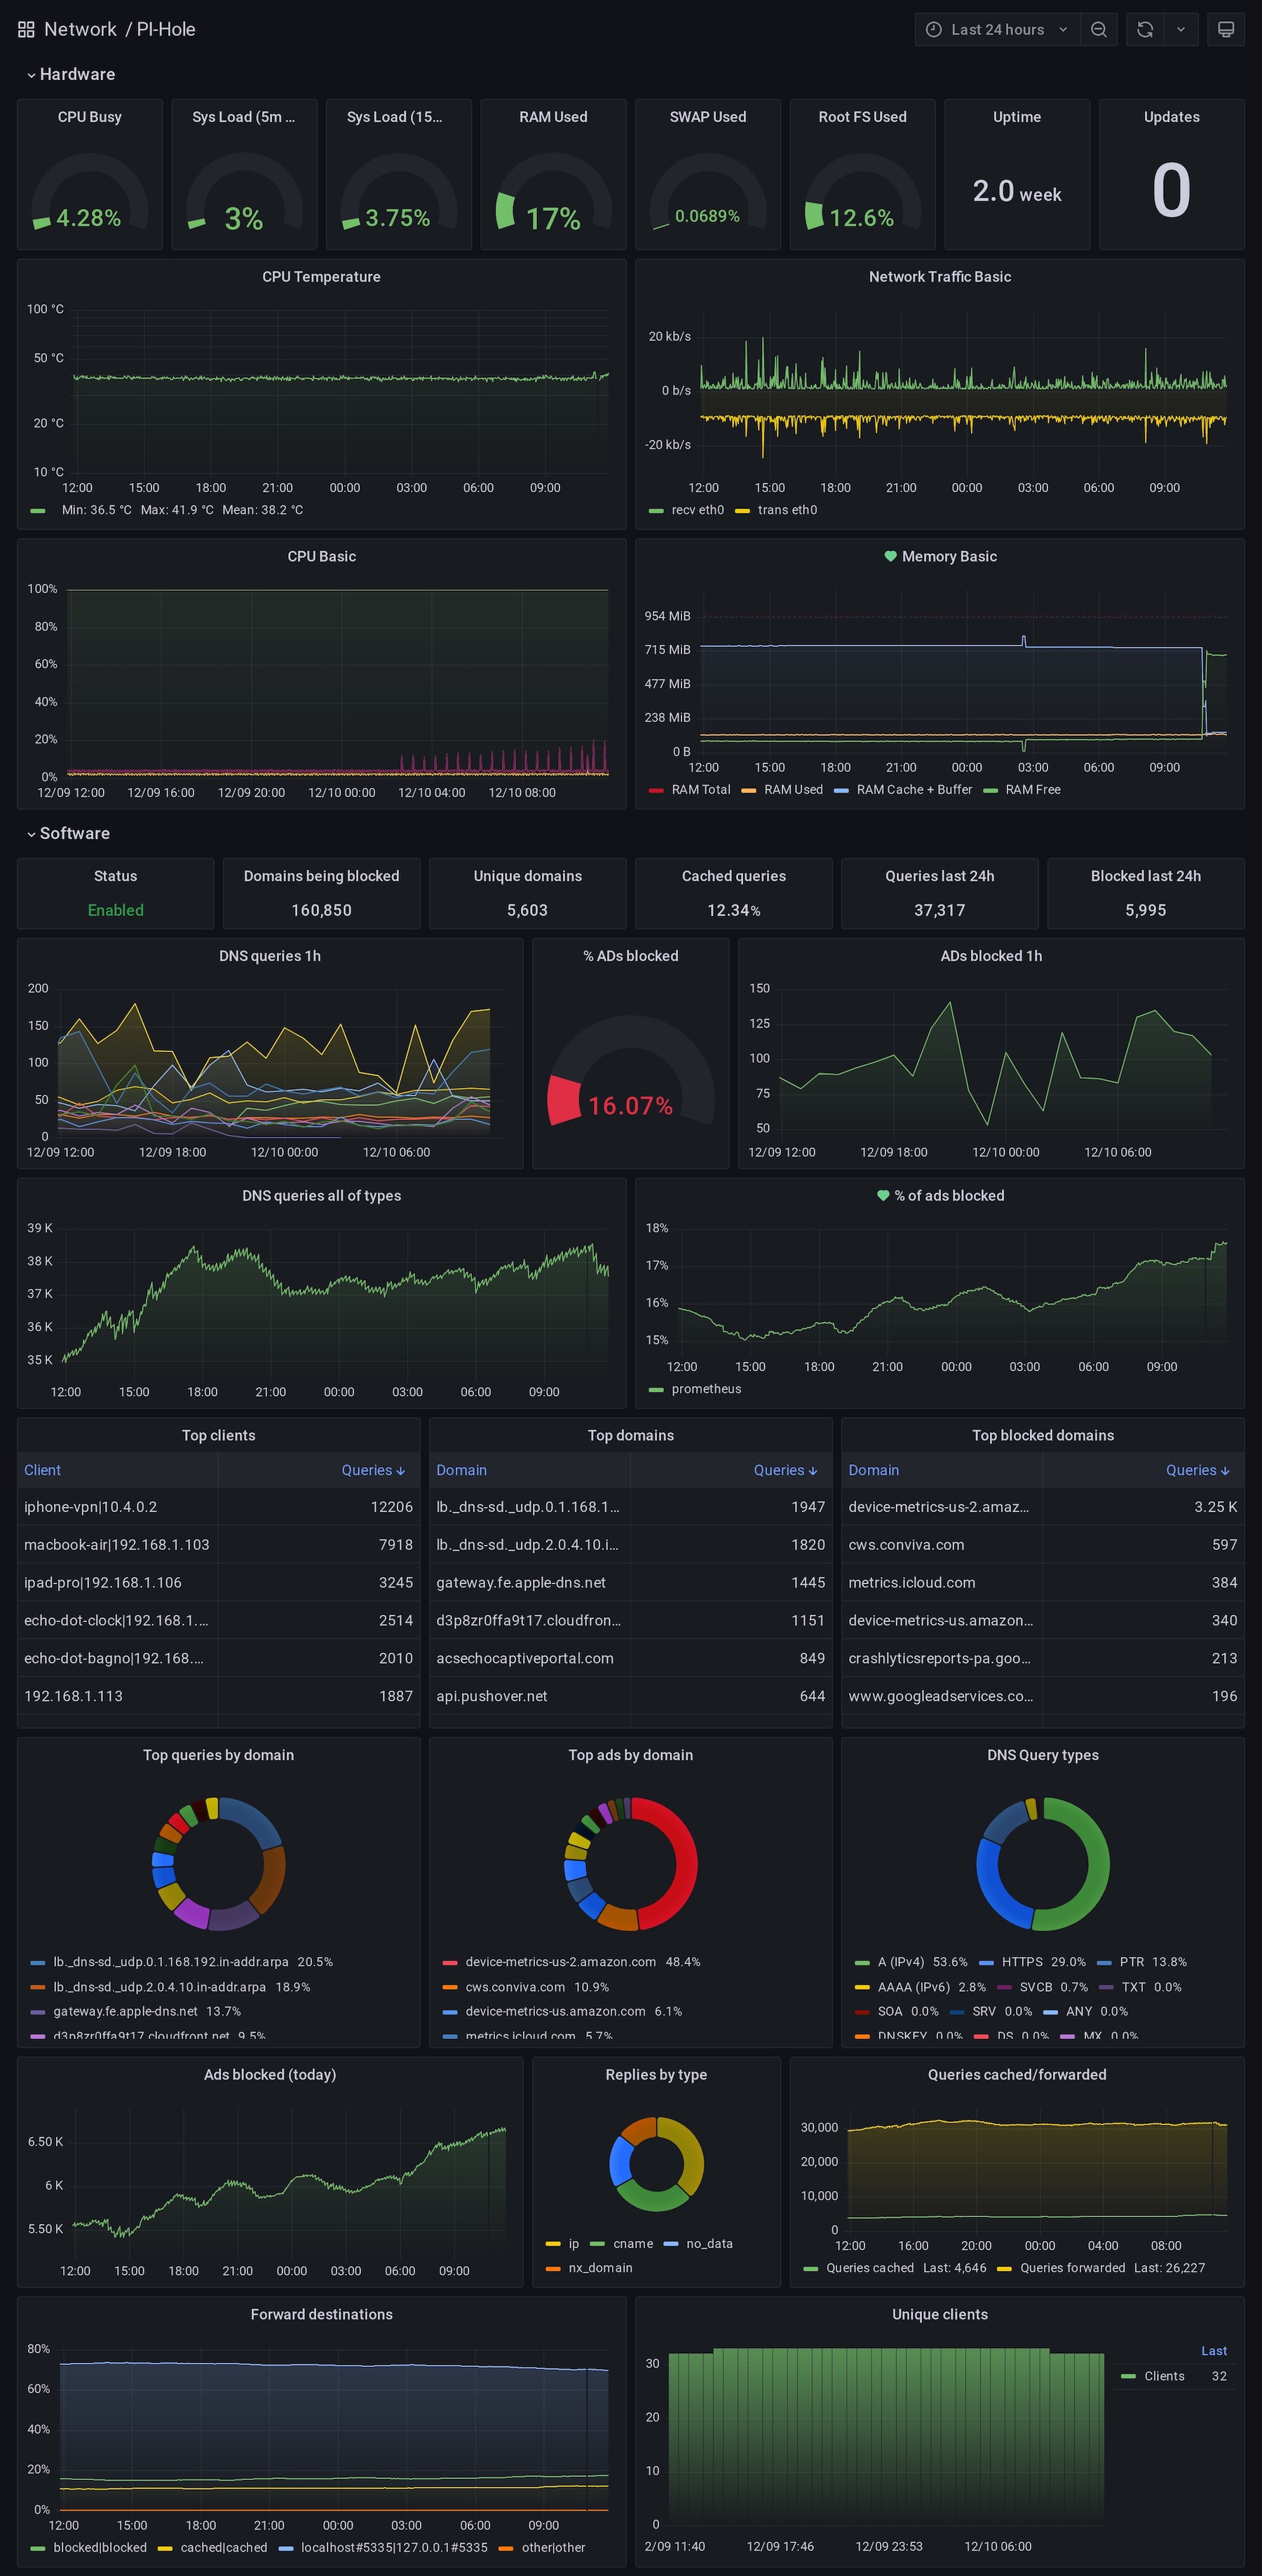
Pi-Hole (and the same for the other RaspberryPIs servers):
