Introduction
In the last days I listened an interesting podcast episode of Click Here, the episode was about the Iran protests, and one of the first phrases was
Almost everyone (in Iran) learn how to use a VPN or Proxy […] even my grandmother (78) asked how to setup VPNs on her phone and lear how to use them.
You can listen it here on Stitcher: The hijab will never be the same
In this episode, there was an Iran guy who was saying that the first thing the government is doing when there are protests is blocking the internet. But not blocking the access or take down the connectivity, instead the government allows the people to use internet, but the Iranian ISPs give access only to some websites and services that the government “likes”. You can read a very interesting report of the GFI - Great Firewall of Iran, here: The Iran Firewall - A preliminary report. In some cases, like in the perimeter of the hospitals where are recovered the injured protesters, he was saying also that the government is completely blocking the connectivity using some devices like Jammers or StingRays. In order to avoid that the people can send outside the hospitals the photos and info. Also when the regime wants, can also cut off the internet access by simply turning it off, in this case there’s no proxy or VPN that can help. The only way to connect to internet would be use the Starlink connectivity (with, I don’t known how, delivered antennas inside the country).
So when they’re able to use internet, they have to use a VPN or Tor. Also if they want to organize a protest with the friends, they have to route all the traffic through a VPN or proxy (when this is possible) because the SMS service is monitored.
As you may know, I also had some bad experiences traveling to Iraq/Turkey during the war, for example when I was going outside the Iraq in 2017, the Turkish police took my iPhone, told me that if I want to go home I have to sign a paper (written in Turkish) that I was allowing the police to scan/check my iPhone. I had to do this, then they unlocked my phone and took it for 5/10 minutes. Obviously they haven’t found anything compromising, so they went to scan my Facebook profile. Also here there was nothing, they only found a photo (in black and white) of two children that were playing in Diyarbakir. And they created many problems for this photo because Diyarbakir is the “capital” of Kurdish region and turkey was/is fighting the Kurdish. They asked me lots of questions, and they didn’t allow me to go outside Iraq. After lots of discussions they allowed me because I said “Ehy there’re only children, I was there to take my flight to home, nothing else..”. But I felt like I was “violated my privacy”, I felt bad, so bad that I have never called anyone, and I turned on the VPN, until I came back to Europe.
…this story just to tell that if I felt so bad only for this, you can understand what the Iranian people are suffering.
And for that I decided to give a little help to Iranian people and every people who are suffering the same repression under authoritarian regimes.
My little help is to run a Tor Snowflake proxy on a VPS that is up 24/7, and I use only to see the statistics of this blog, in a privacy and GDPR friendly way, using umami. Here you can read the post about it: post umami DigitalOcean.
The VPS is a basic “droplet” of DigitalOcean, only with the RAM upgraded to 1Gb (because I’m using Docker and it is very RAM intensive) for 6$ month.
Run Snowflake
Once you have bought and configured the VPS, there’re two ways to run Snowflake on it, one is from the source and the other is from a Docker container. I used both, and both are very easy to run, but in the end I chose the Docker way, and now I’ll explain why.
Since I hate Docker because it is very resource intensive, I started with the source, it was working fine but then I realized that the snowflake executable was leaving no logs. So I wasn’t able to understand how many people and how much traffic it was generating. It was working because I saw the general traffic and CPU usage but not the details. So I switched to the Docker version that has some nice logs.
from source
If you want to run it from the source code just follow the official Snowflake wiki (I added just one step to auto-launch it at every boot).
Make sure you have Go installed or apt install golang
Enter inside the directory where you want to store it
Grab the source from GitLab:
git clone https://git.torproject.org/pluggable-transports/snowflake.git
Enter inside the directory and compile it
cd snowflake/proxy
go build
Then you can run it using ./proxy. But since if you close the session, also the Snowflake daemon will stop, use nohup ./proxy & but since if you reboot your machine, it doesn’t start automatically, you can add it to cron and run at every boot
sudo crontab -e
Then add
@reboot cd /yourpath/snowflake/proxy/ && nohup ./proxy &
(Another cleaner way is to add it to systemd).
But using this way I there’s no data or stats to view how many traffic and users it’s generating. Yes, there’re some third party solutions, but I don’t want to use other scripts/tools on this VPS.
using Docker
Because I also realized that the Docker version of Snowflake has some nice stats, so I switched to use it. It’s also very simple to install and run, you can follow the wiki as above: Snowflake wiki
If you have already Docker installed, just add this to docker-compose.yml:
services:
    snowflake-proxy:
        network_mode: host
        image: thetorproject/snowflake-proxy:latest
        container_name: snowflake-proxy
        restart: unless-stopped
then run it:
docker-compose up -d snowflake-proxy
After, if you want to know if it’s running you can add the output log to 1 minute (instead of the default 1 hour), editing again the docker-compose.yml and add this at the end (after the restart):
services:
    snowflake-proxy:
        network_mode: host
        image: thetorproject/snowflake-proxy:latest
        container_name: snowflake-proxy
        restart: unless-stopped
        command: ["-verbose","'-unsafe-Logging", "-summary-interval", "1m"]
Then run the image again:
docker-compose up -d snowflake-proxy
Wait a bit (minutes) and try to see what is going on with;
docker logs -f snowflake-proxy
it should output something like this
2022/10/27 08:27:38 In the last 1ms, there were 1 connections. Traffic Relayed + 19 MB, 1 1 MB.
2022/10/27 08:27:40 sdp offer successfully received.
2022/10/27 08:27:40 Generating answer. 2022/10/27 08:28:00 Timed out waiting for client to open data channel.
2022/10/27 08:28:21 sdp offer successfully received.
2022/10/27 08:28:21 Generating answer.
2022/10/27 08:28:32 copy loop ended
2022/10/27 08:28:32 OnClose channel
2022/10/27 08:28:32 Traffic throughput (up| down): 66 KB|13 KB -- (92 OnMessages, 332 Sends, over 1271 seconds)
2022/10/27 08:28:32 datachannelHandler ends
And now you know that is running and how many traffic is generating every minute.
But you don’t want to write all the log entries every minute, is pointless, so once you know that all is working, edit again the docker-compose.yml and delete the last line command: ["-verbose","'-unsafe-Logging", "-summary-interval", "1m"]
And run again the container ( docker-compose up -d snowflake-proxy )
Don’t worry you will still be able to see the log, but every hour, as it should be without spamming the log file. Just wait 1 hour or more and use the same command to see the log, now there isn’t the verbose output to the log file, so you will have a more human readable and satisfying log:
# docker logs -f snowflake-proxy
2022/10/27 14:23:04 In the last 1h0m0s, there were 12 connections. Traffic Relayed ↑ 60 MB, ↓ 3 MB.
2022/10/27 15:23:04 In the last 1h0m0s, there were 15 connections. Traffic Relayed ↑ 23 MB, ↓ 3 MB.
2022/10/27 16:23:04 In the last 1h0m0s, there were 15 connections. Traffic Relayed ↑ 52 MB, ↓ 3 MB.
2022/10/27 17:23:04 In the last 1h0m0s, there were 14 connections. Traffic Relayed ↑ 34 MB, ↓ 14 MB.
2022/10/27 18:23:04 In the last 1h0m0s, there were 12 connections. Traffic Relayed ↑ 45 MB, ↓ 4 MB.
2022/10/27 19:23:04 In the last 1h0m0s, there were 13 connections. Traffic Relayed ↑ 20 MB, ↓ 1 MB.
2022/10/27 20:23:04 In the last 1h0m0s, there were 14 connections. Traffic Relayed ↑ 18 MB, ↓ 6 MB.
2022/10/27 21:23:04 In the last 1h0m0s, there were 16 connections. Traffic Relayed ↑ 37 MB, ↓ 2 MB.
And that is all. You are helping someone somewhere to use the Tor browser and avoid the censure (or buy some drugs or rifles…who know, enjoy the freedom!)
Get daily summaries
Now if you want to know how much you helped you have to ssh into you VPS and ask to docker’s log
docker logs -f snowflake-proxy
A bit boring. Why not get a daily automated report via email? Absolutely, it’s very rewarding also, your dopamine level will thank you :)
In order to do this you have to install “something” that send mails and add a cron job.
I used mailutils and ssmtp,
apt install mailutils
and the important one:
apt-get install ssmtp
Once you have installed both you need to configure ssmtp with your mail account/password. I used my “trash account” from Gmail.
So edit /etc/ssmtp/ssmtp.conf with your editor (nano or vi) and at the end of the file add:
FromLineOverride=YES
AuthUser=your-email@gmail.com
AuthPass=*
mailhub=smtp.gmail.com:587
UseSTARTTLS=YES
But if you have the 2FA enable -as you should- you first need to generate an app specific password. You have to simply go to your Google profile and you will find the “Signing in to Google” section, generate a new password (screenshot) and copy-paste it in the AuthPass field.
And now test it with:
echo "It works" | mail -s "Just a test" your-email@gmail.com
You should receive the email to confirm that is working. Now you have to add a cron job to send the daily stats of Snowflake, so open sudo crontab -e and add
MAILTO="your-email@gmail.com"
0 20 * * * docker logs --since 24h  snowflake-proxy
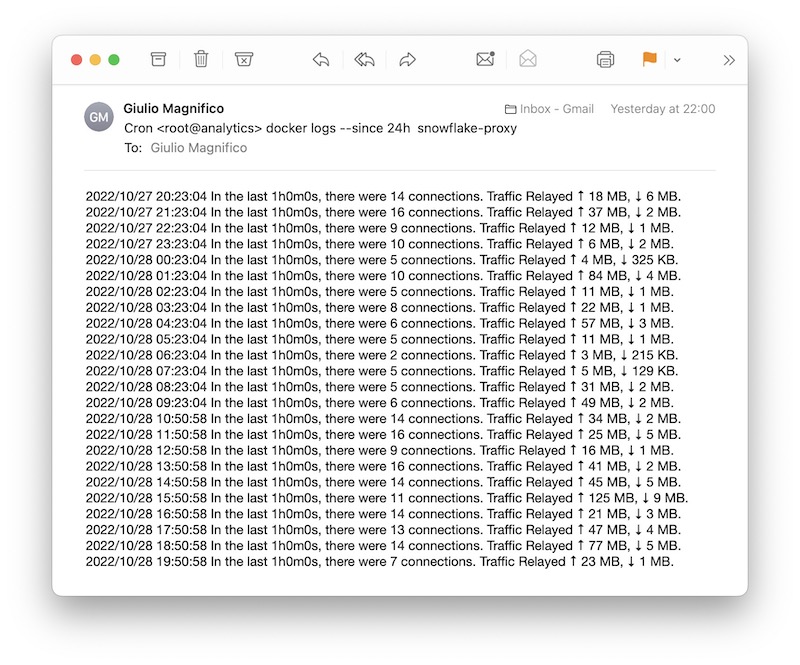
This will send every day a daily report (at 20.00, but consider the UTC time and your region) with the last 24h of data:

Pretty satisfying.
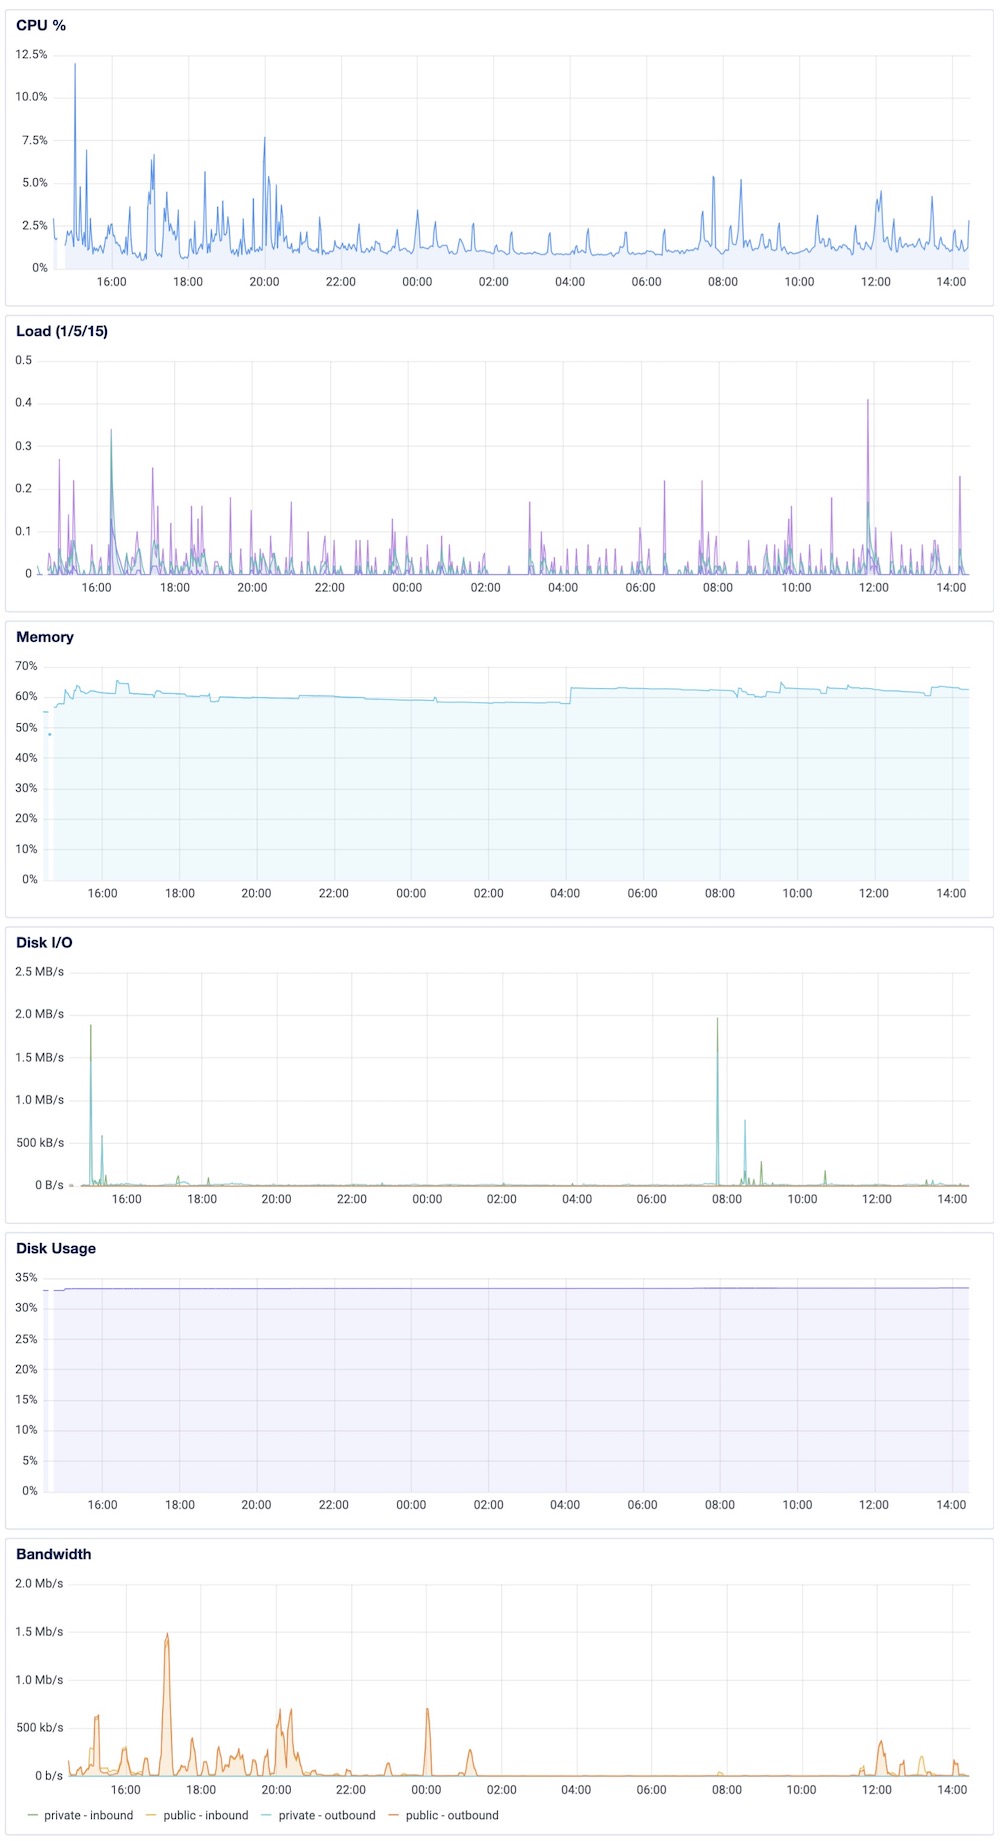
If you want you can also limit the bandwith of the Snowflake container using something like Docker Traffic Control, but for me it’s using a normal/low amount of traffic and resources and I don’t need it:

If you want you can also use the command docker stats or a tool like iptraf-ng to analyze the traffic and resources that Snowflake is using.