I spent my last two months to build/optimize my home network from scratch and I want to share my setup, info and troubles that I discovered during this work, so you can take some inspirations or ideas here and there.
This post will be quite long, so I start with an overall description of the hardware/software/setup and then I’ll go into the details.
The hardware and software
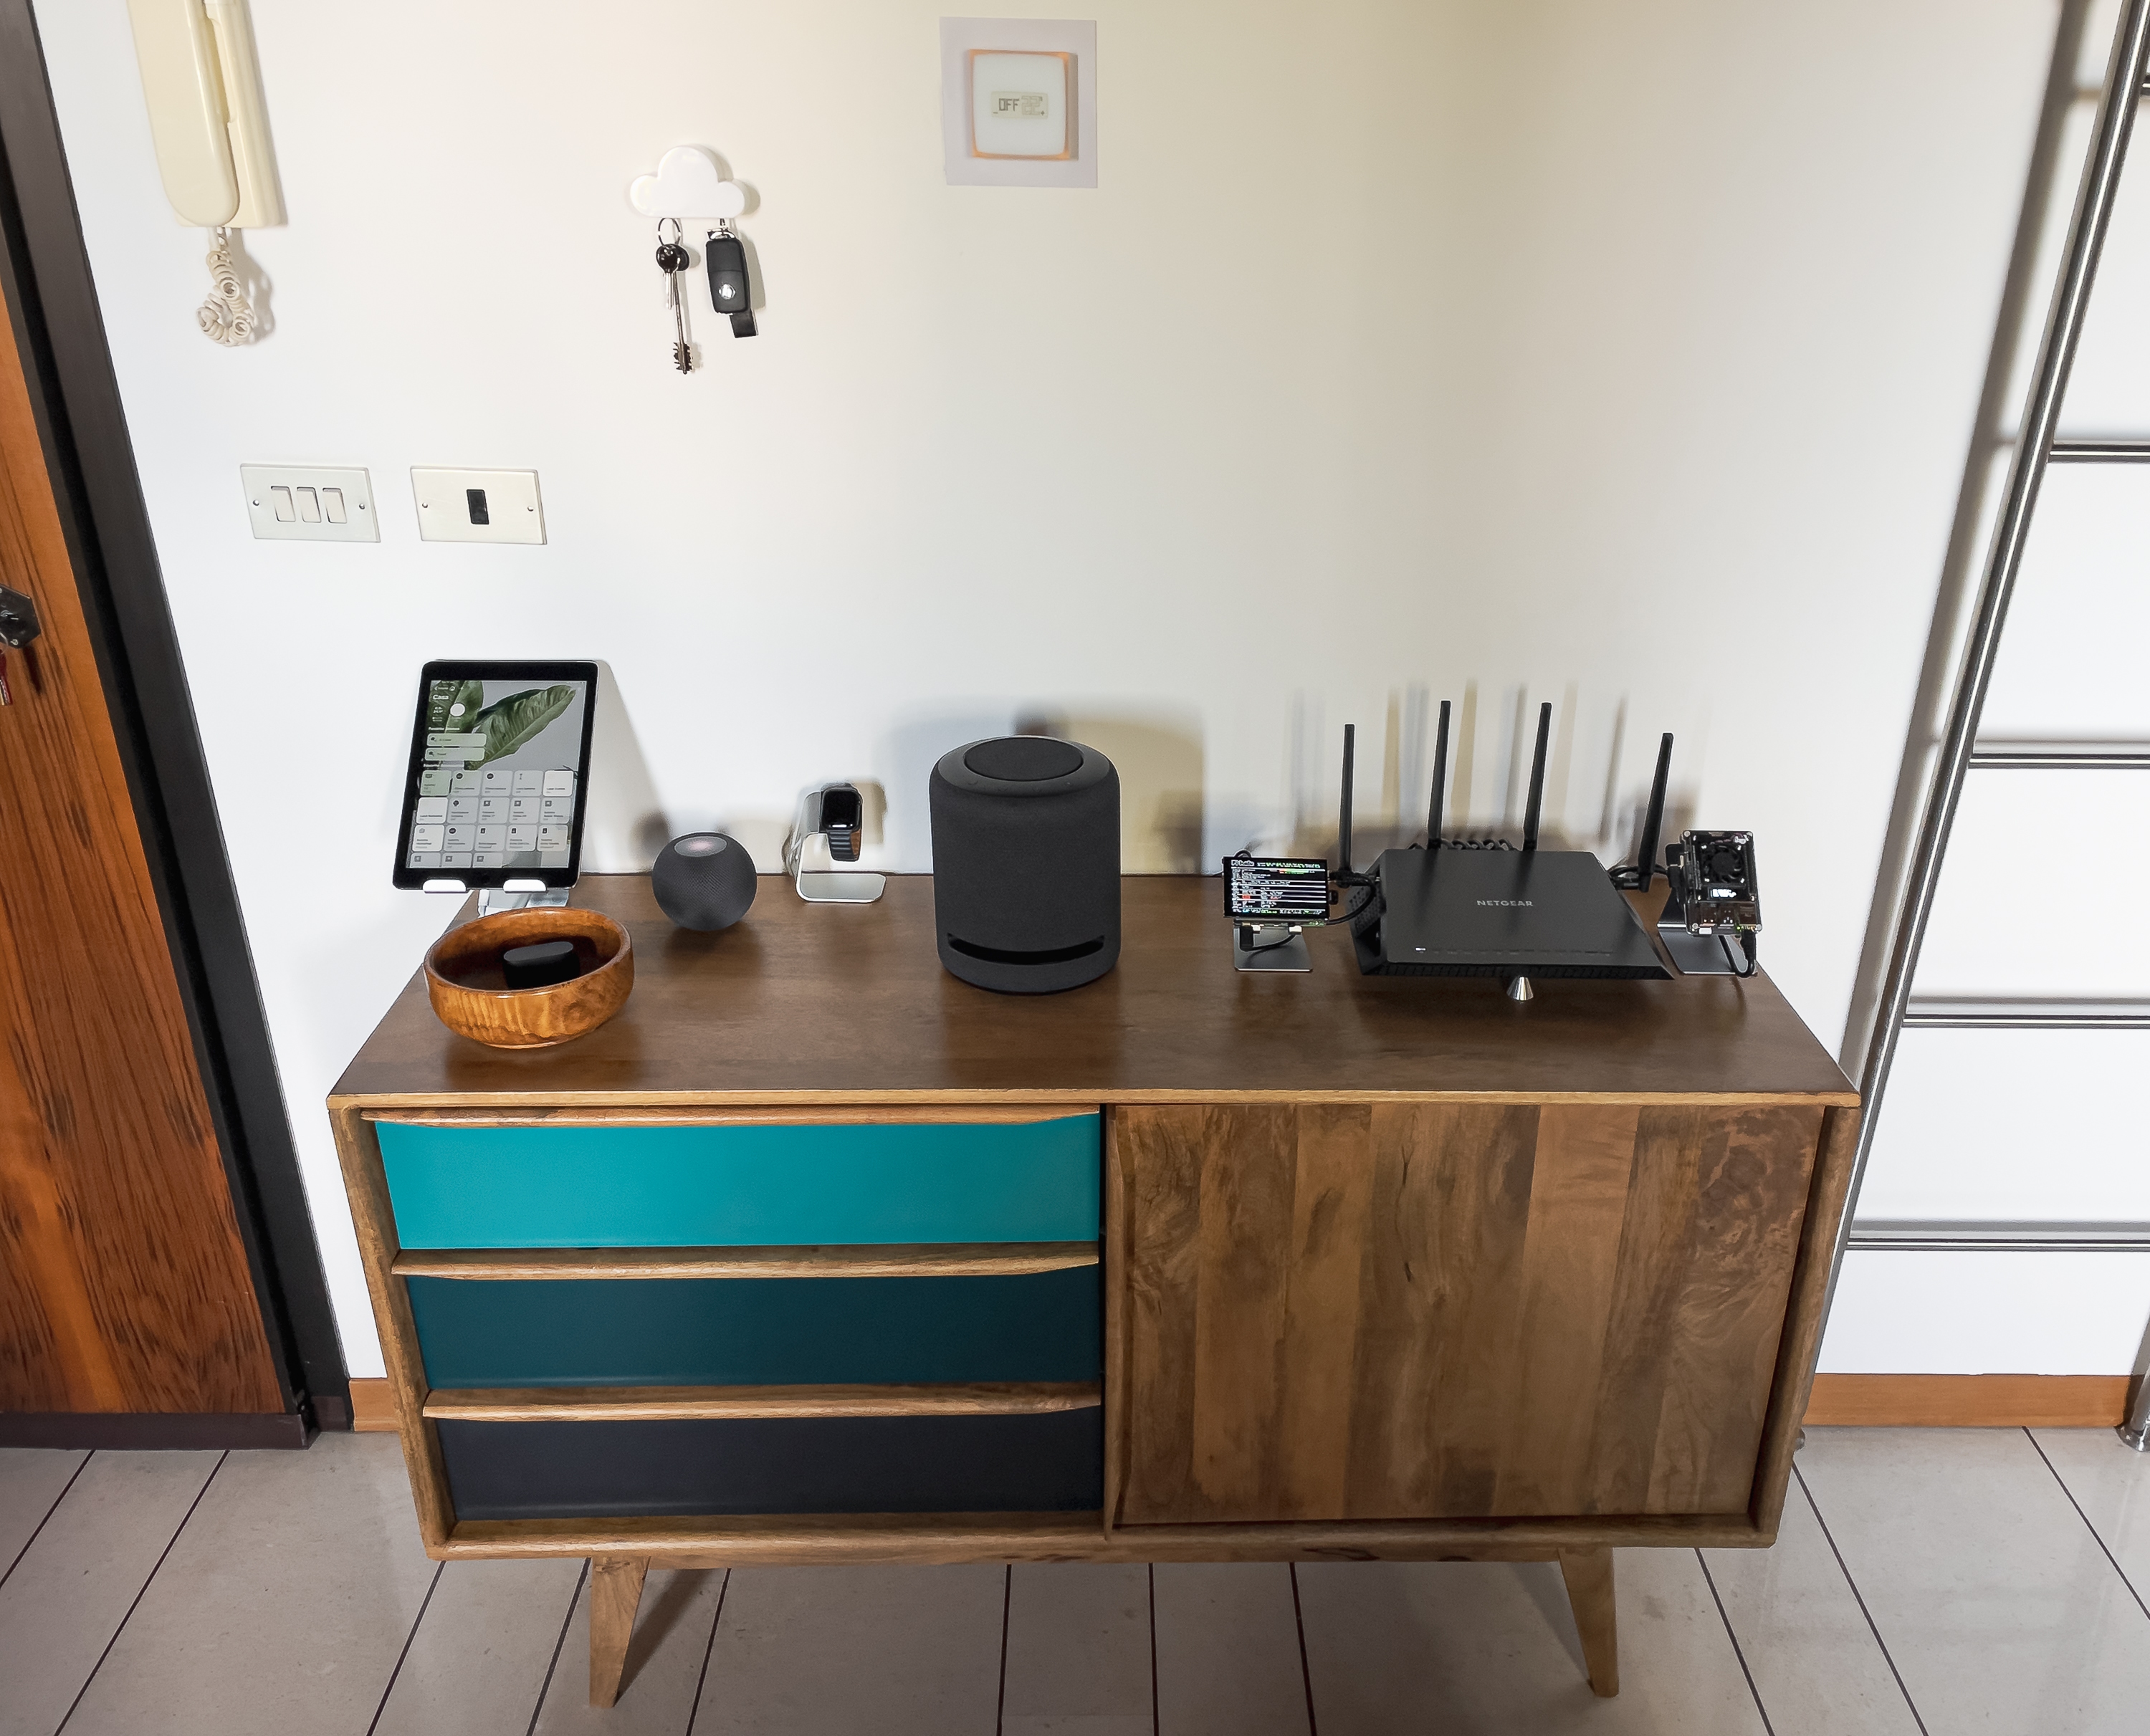
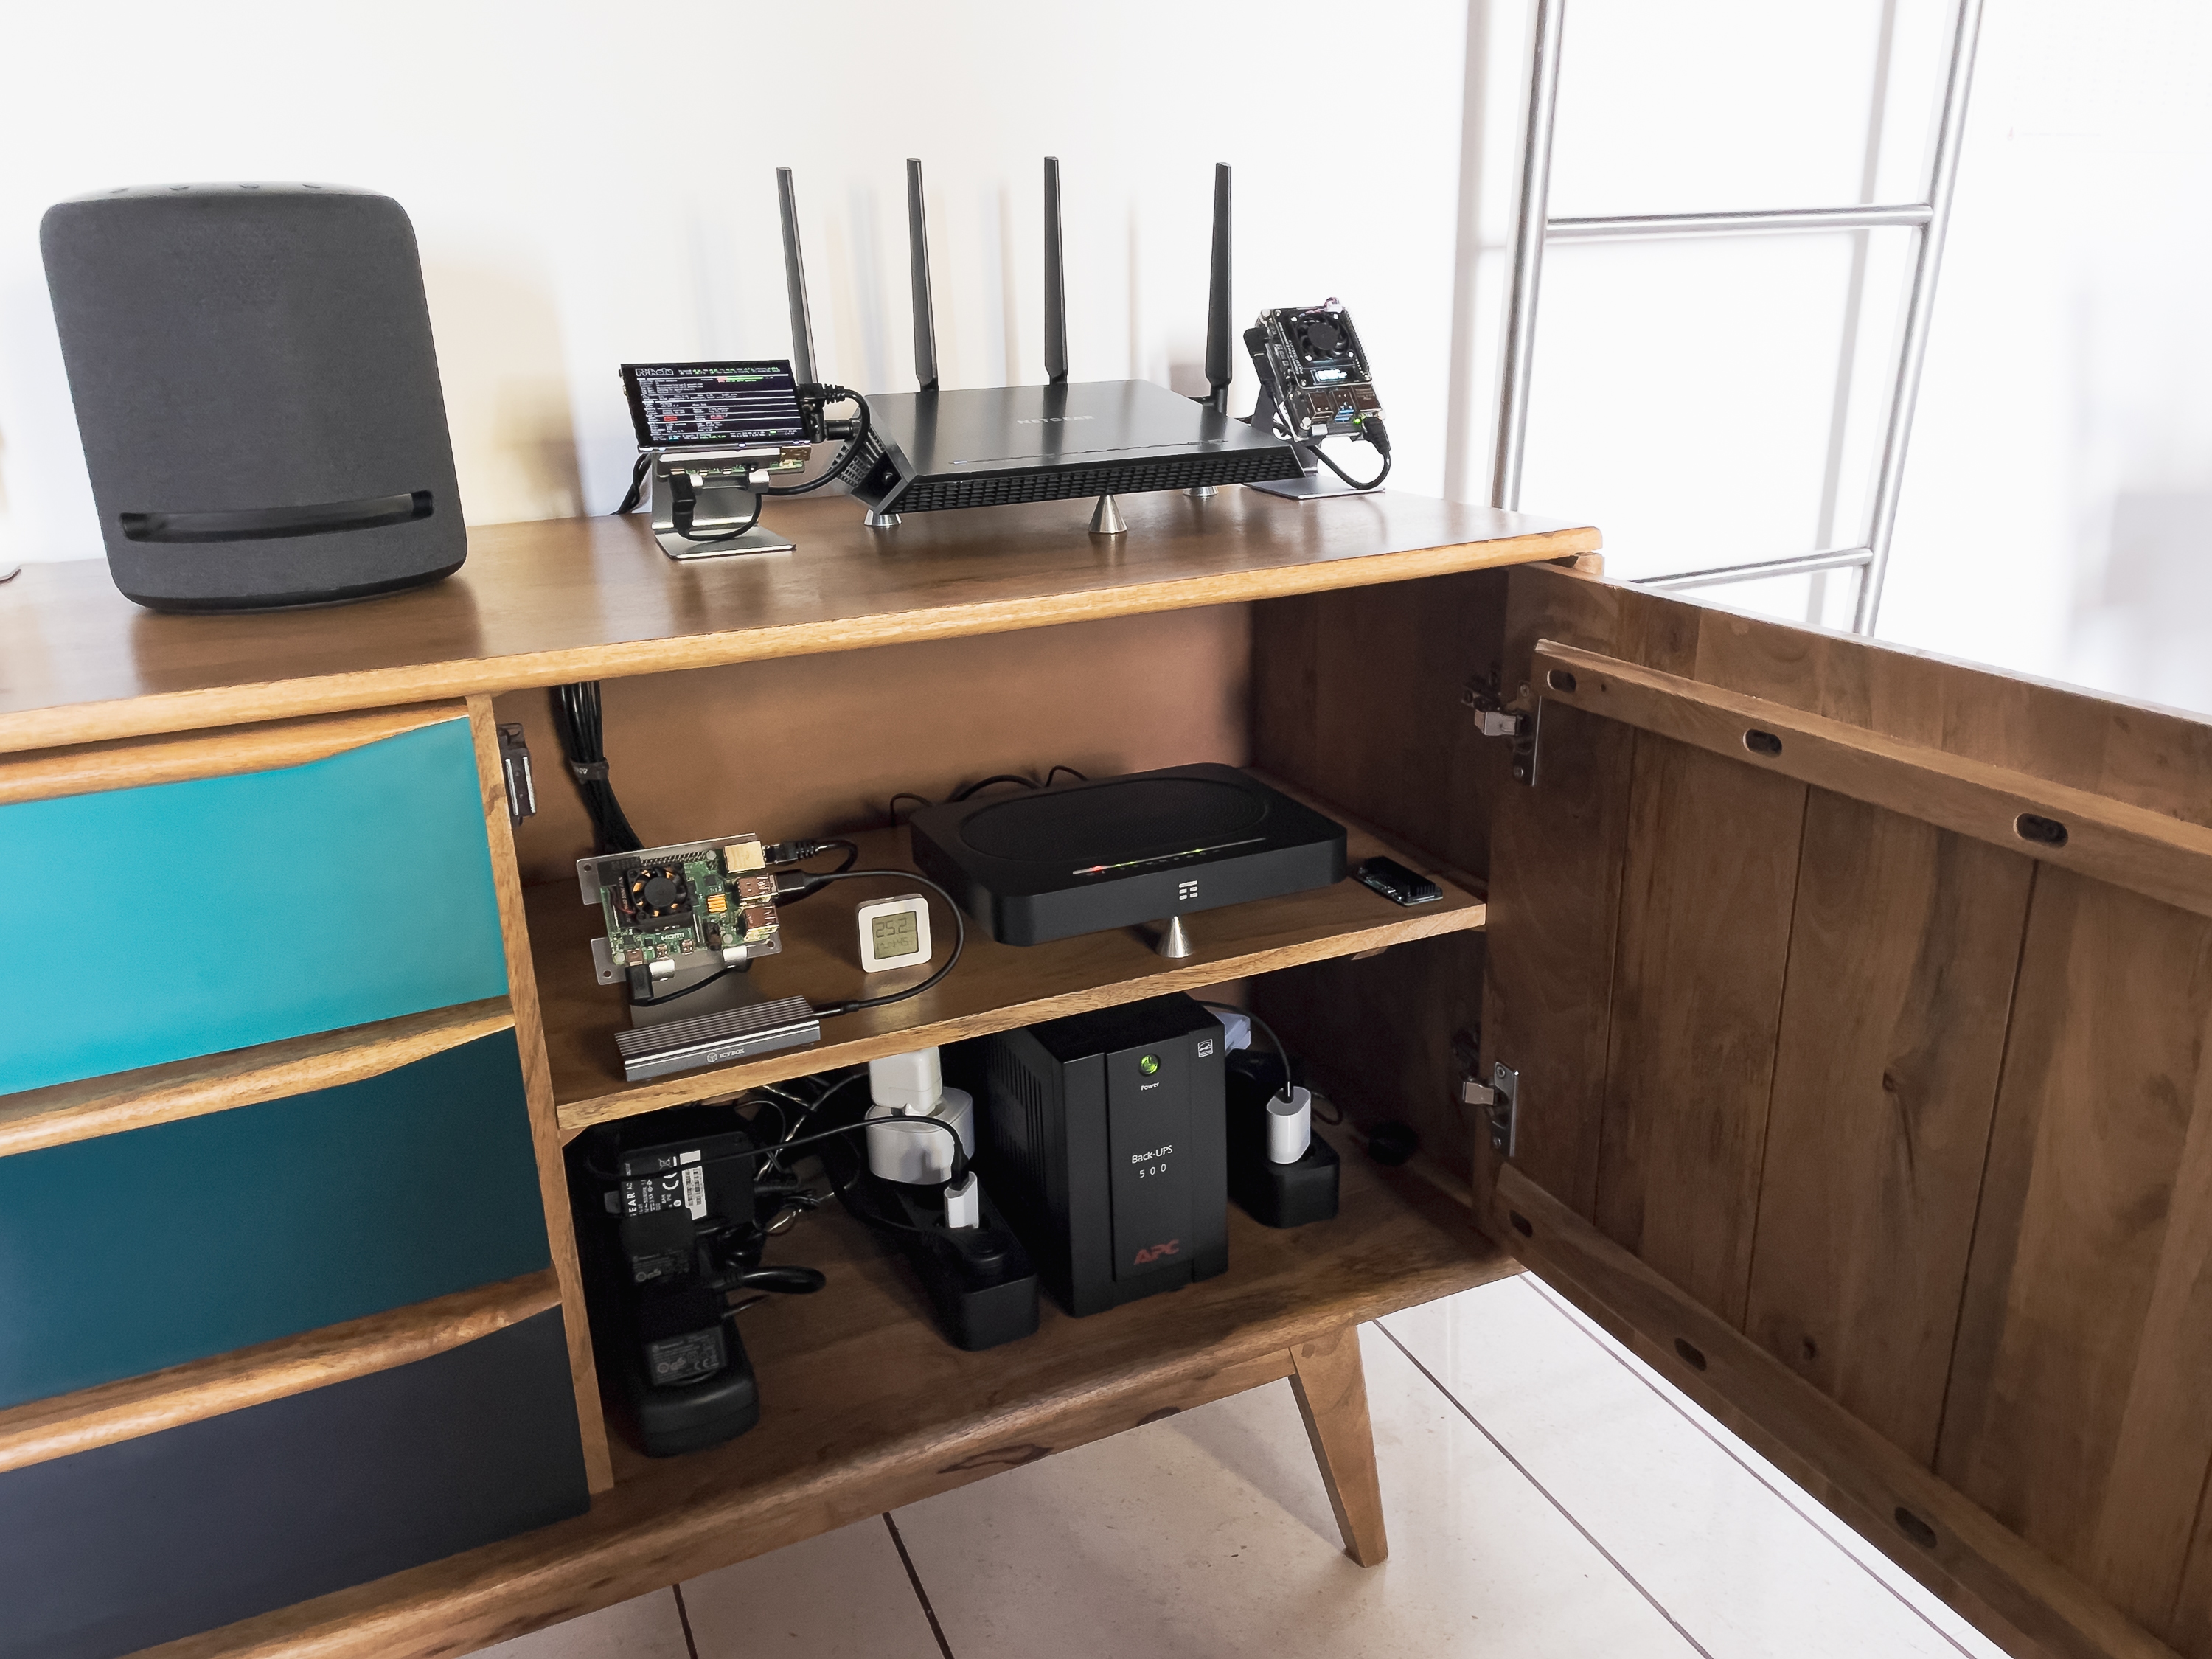
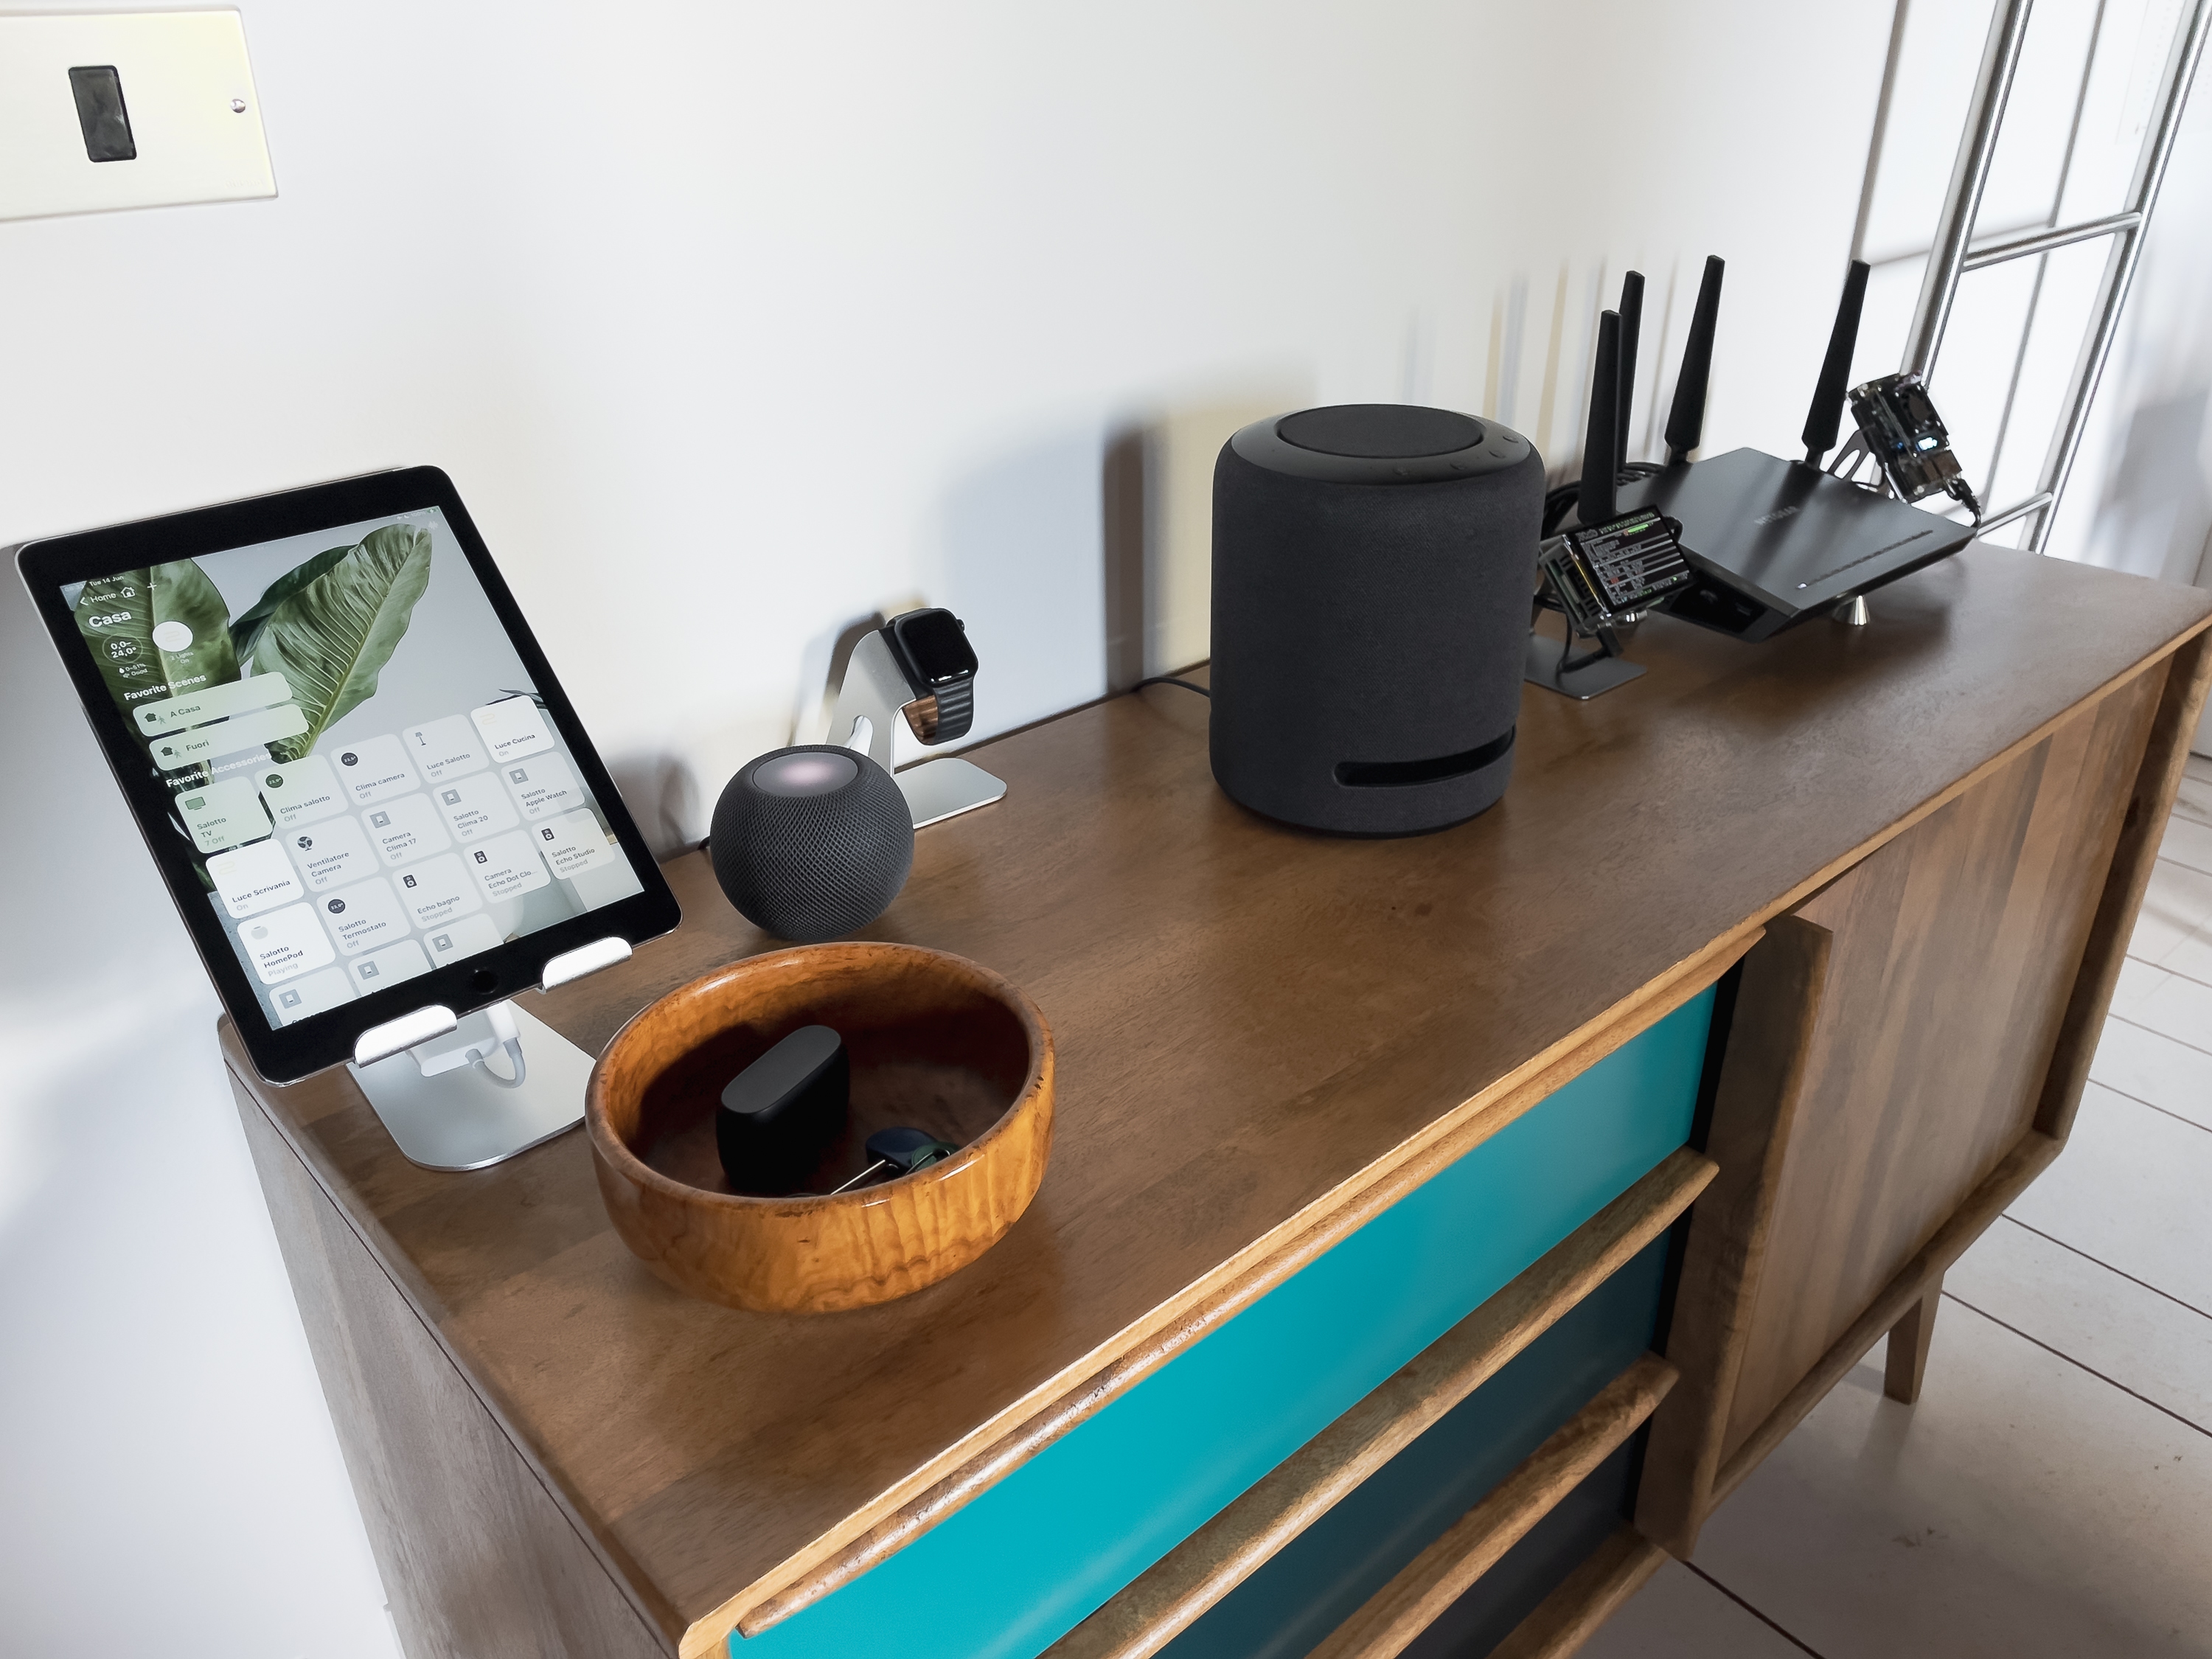
- Netgear R7800 with OpenWRT as main router
- The ISP default modem because works the best for my FTTC connection (still waiting for the 1000/200mbps FTTH upgrade)
- One Raspberry PI 4B 1GB RAM as Pi-Hole server
- One Raspberry PI 4B 2GB RAM as Homebridge server
- One Raspberry PI 4B 4GB RAM as Prometheus server and drawing Grafana stats
- UPS APC BX500CI to be always online
- Xiaomi Mi Thermostat LYWSD03MMC to monitor the server cabinet temperatures
Other Smart Home things:
- One HomePod Mini as HomeKit hub
- One Echo Studio as main Alexa device
- One Echo as bathroom streaming
- One Echo Dot Clock as nightstand clock
- 10x Meross Wi-Fi Smart plug
- Netatmo Wheater Station
- Netatmo Thermostat
- Two RM4 Mini to control TV, fans and air conditioners
Other hardware:
- MacBook Air with Studio Display
- iPad Pro
- iPhone Pro
- LG OLED55C14LB television
R7800 router + OpenWRT + tasty stats
The Netgear R7800 is still a good router if you don’t need gigabit NAT/SQM/PPPoE, and it’s one of the best to use with OpenWRT, because it has a full support and it has lots of users/custom builds/info. I’ve bought it 5/6 years ago and it’s still rocks. If you want to improve the airflow and give it few degrees less, raise it few centimeters by inserting something under it. Im using three audiophile spikes but also three/four bottle caps are fine.
I’m using a custom OpenWRT Snapshot build with ad-hoc selection of OPKG packages and I build it with the great OpenWRT online image builder), so I don’t need a Linux (VM) machine or set up macOS to build it (OpenWRT requests lots of stuff and a custom case sensitive partition). About the configuration, I’m using the 2.4GHz wlan for the IoT devices, and the 5GHz for all my personal devices (it can cover all the home), this because at the beginning the 2.4GHz was running in “isolated mode”, one connected device wasn’t able to view and communicate with other devices inside the LAN. This is great for the privacy but I discovered that Apple HomeKit works very slow with this setup (because it needs to route all the connections from internet, instead of trigger them via LAN. Weird behavior because -instead- Amazon Alexa works fast also if the devices can’t see each other).
Other configuration is an isolated 5GHz “Guest Wi-Fi” for the friends, a WireGuard tunnel for all my devices when I’m out of home, SQM QoS, Dynamic DNS (for WireGuard), Netlink Bandwidth Monitor, static DHCP lease, and other personal configurations less important.
But what I love about it, is the stats that OpenWRT can generate using Collectd: the system statistics collection daemon that is writing, using RRDTool, the data to a 16GB external USB3 drive. This is important because the default location is inside /tmp and for that the data are deleted at every reboot and draw long time stats it’s impossible obviously.
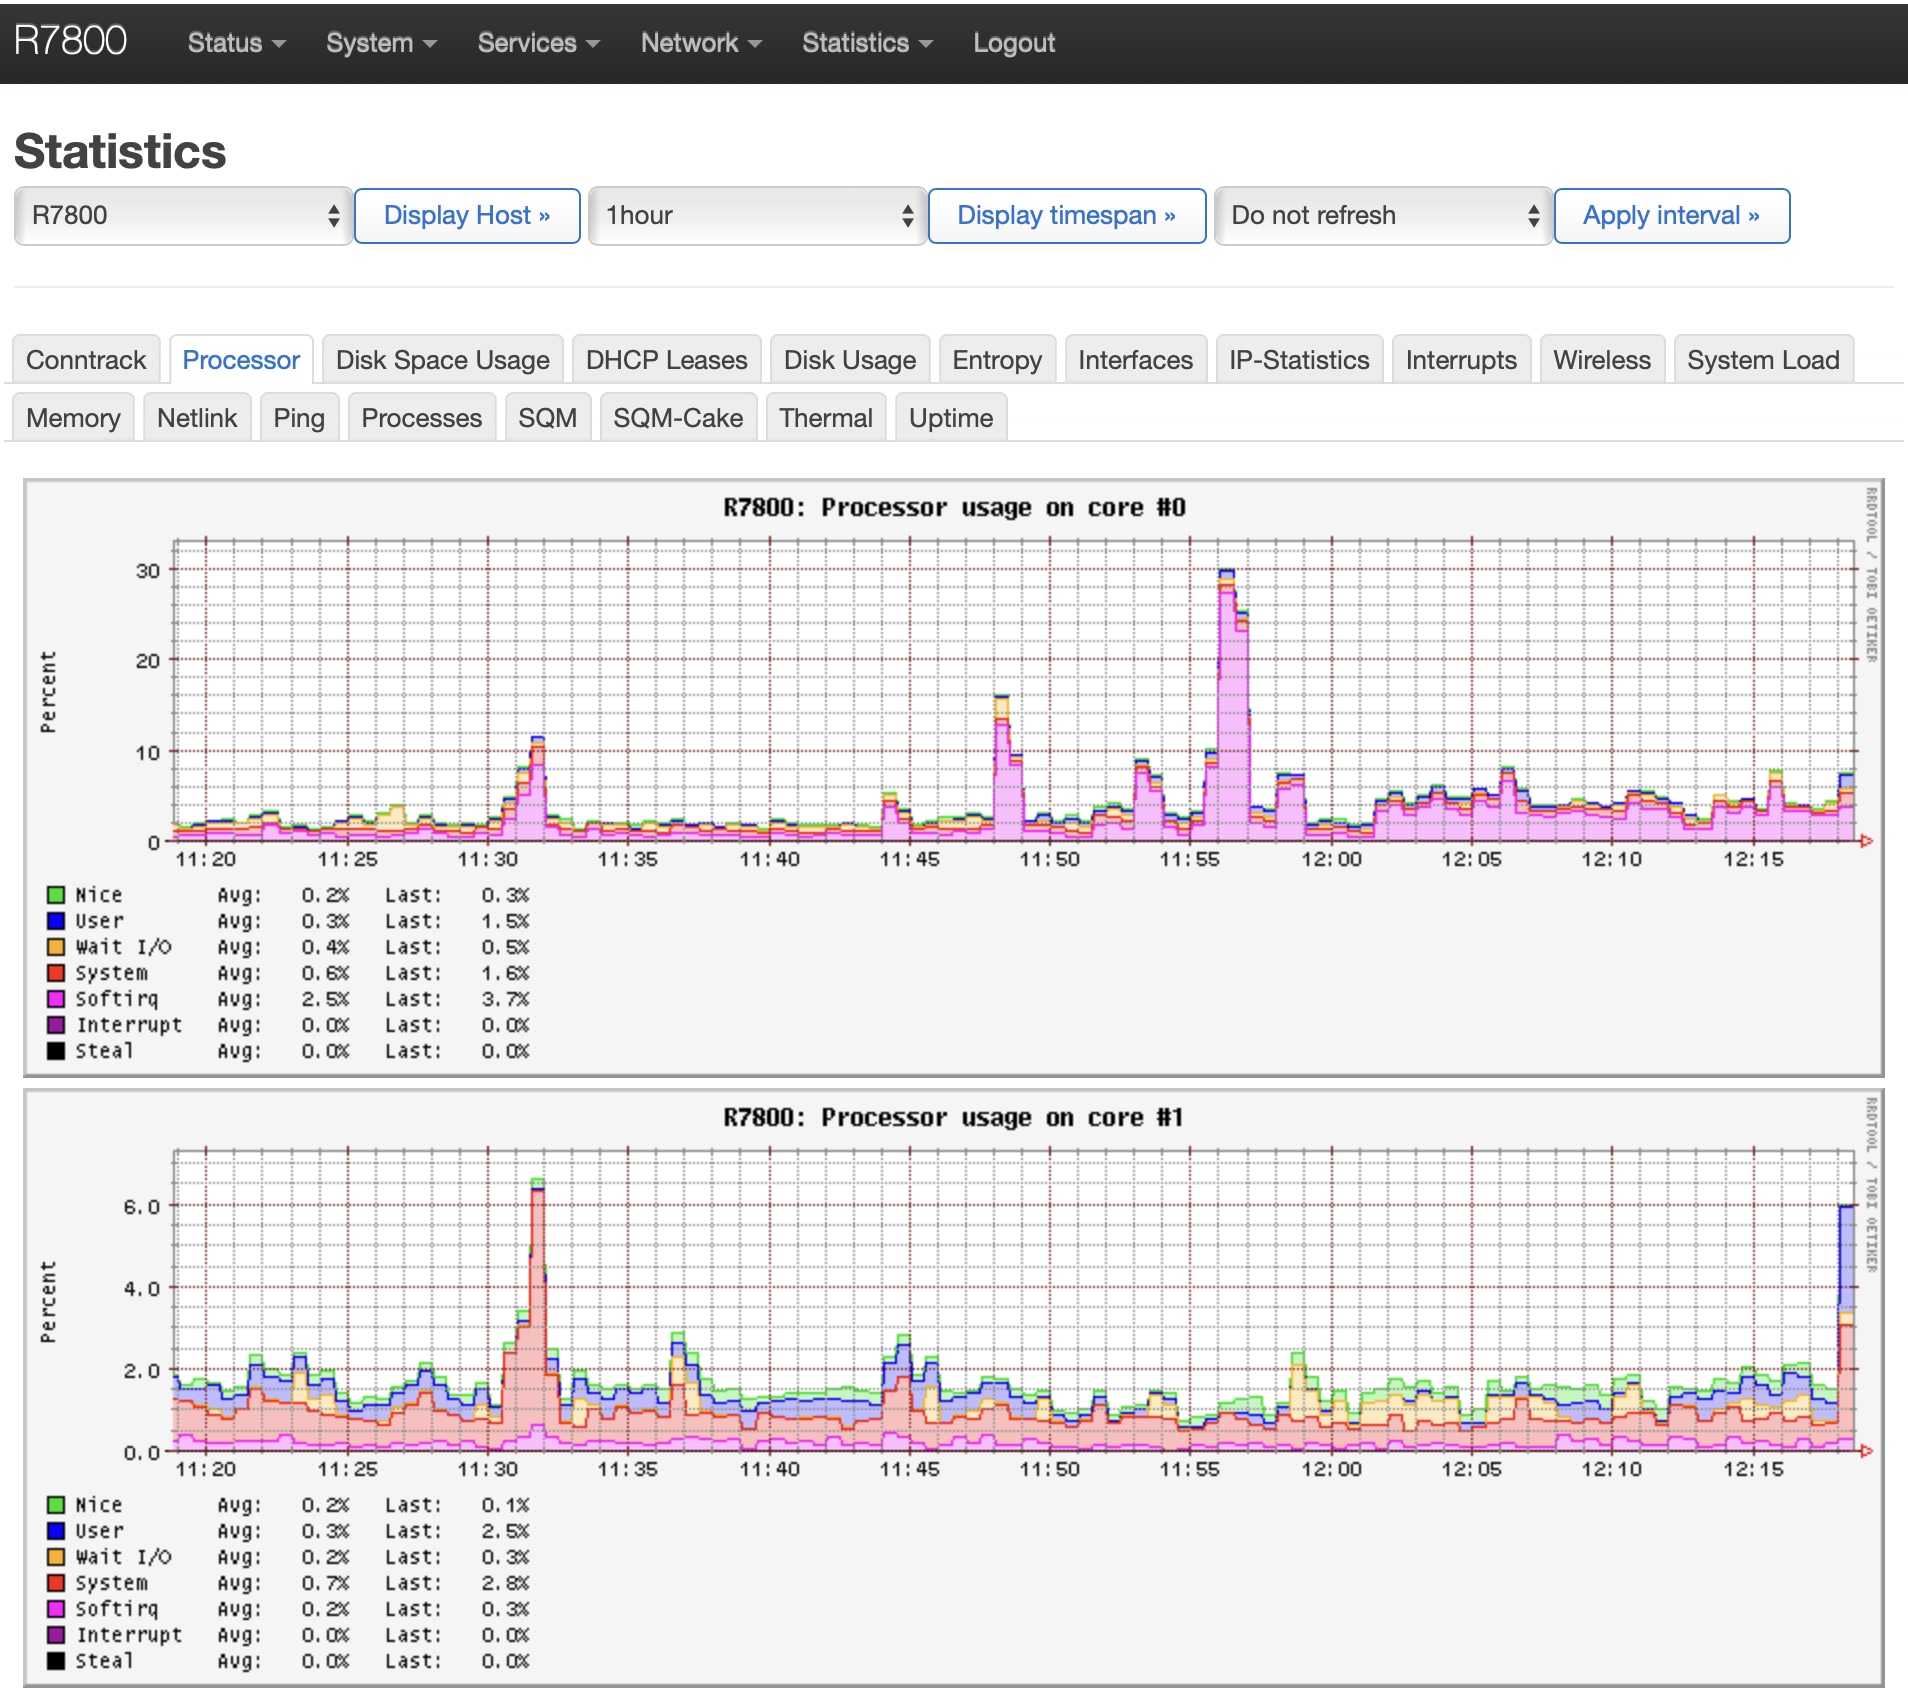
But these graphs are not so nice, they look like are coming out from the ‘80/‘90 =] so I decided to use InfluxDB and Prometheus to export the queries to an external database and draw these beautiful graphs with Grafana:
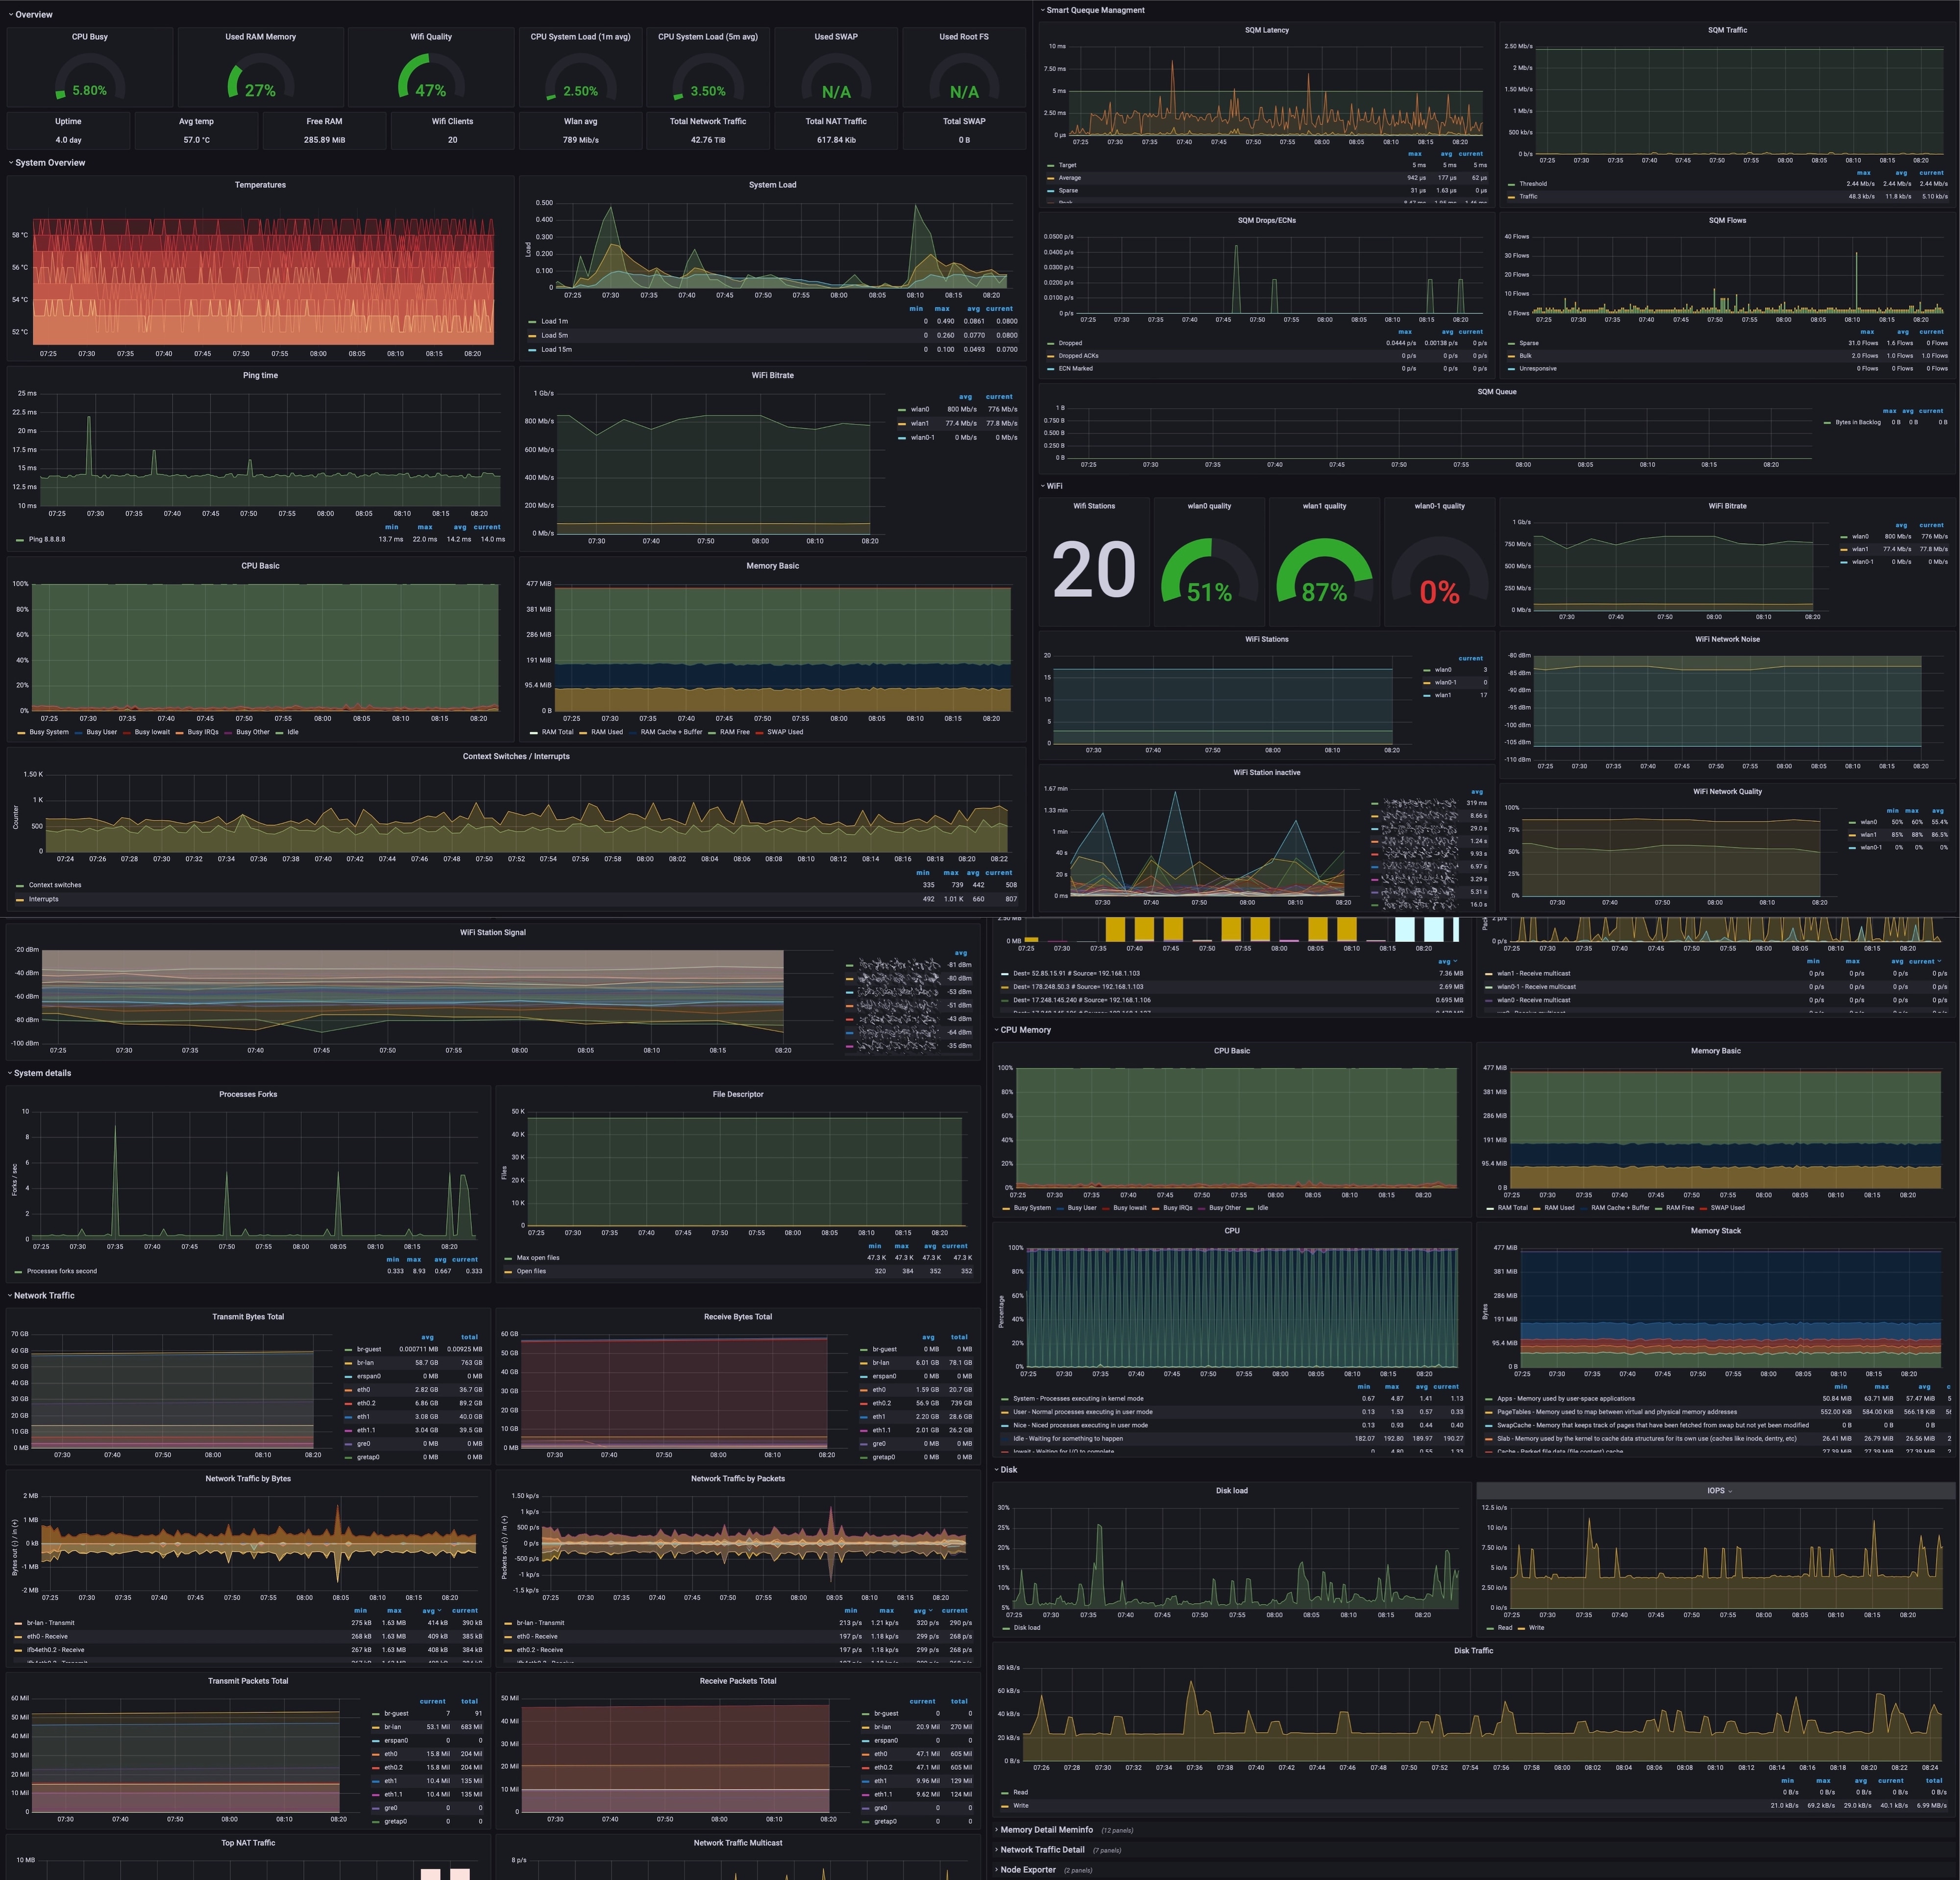
(here’s a -very long- full screenshot)
At the beginning I was using both InfluxDB and Prometheus as databases, then I discovered the collectd_exporter to Prometheus plugin that works great, and now I’m able to export, and draw the graphs, also of:
- Ping time
- Temperatures
- SQM
- Disk IO
- Irqbalance
that aren’t supported by the prometheus-node-exporters included in opkg.
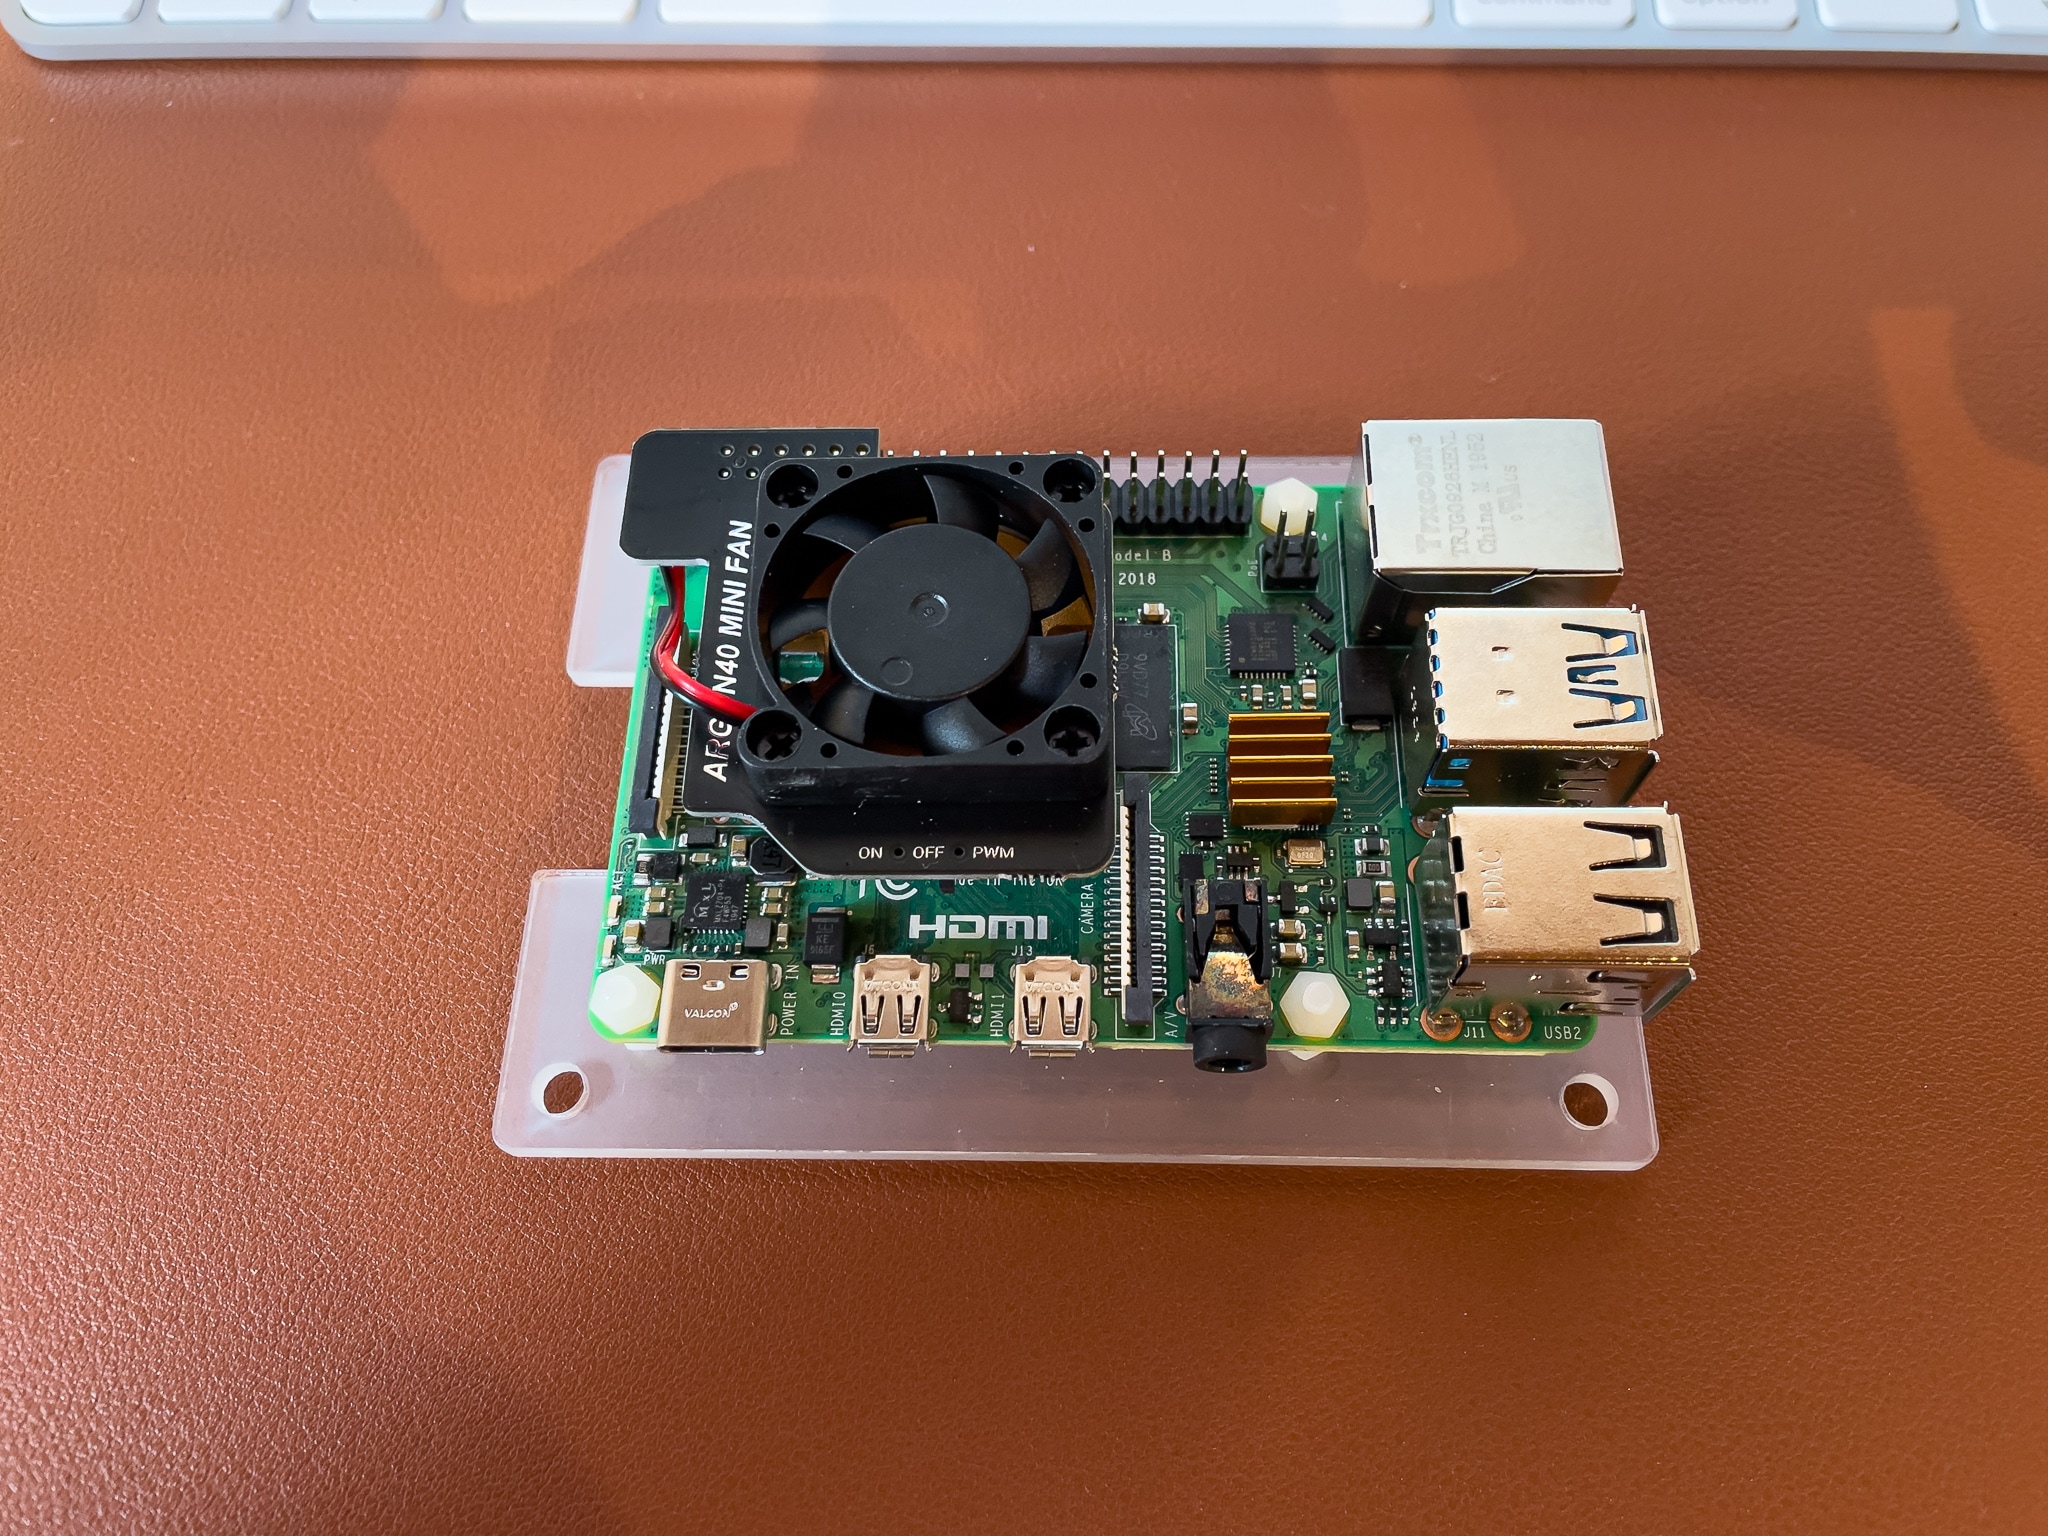
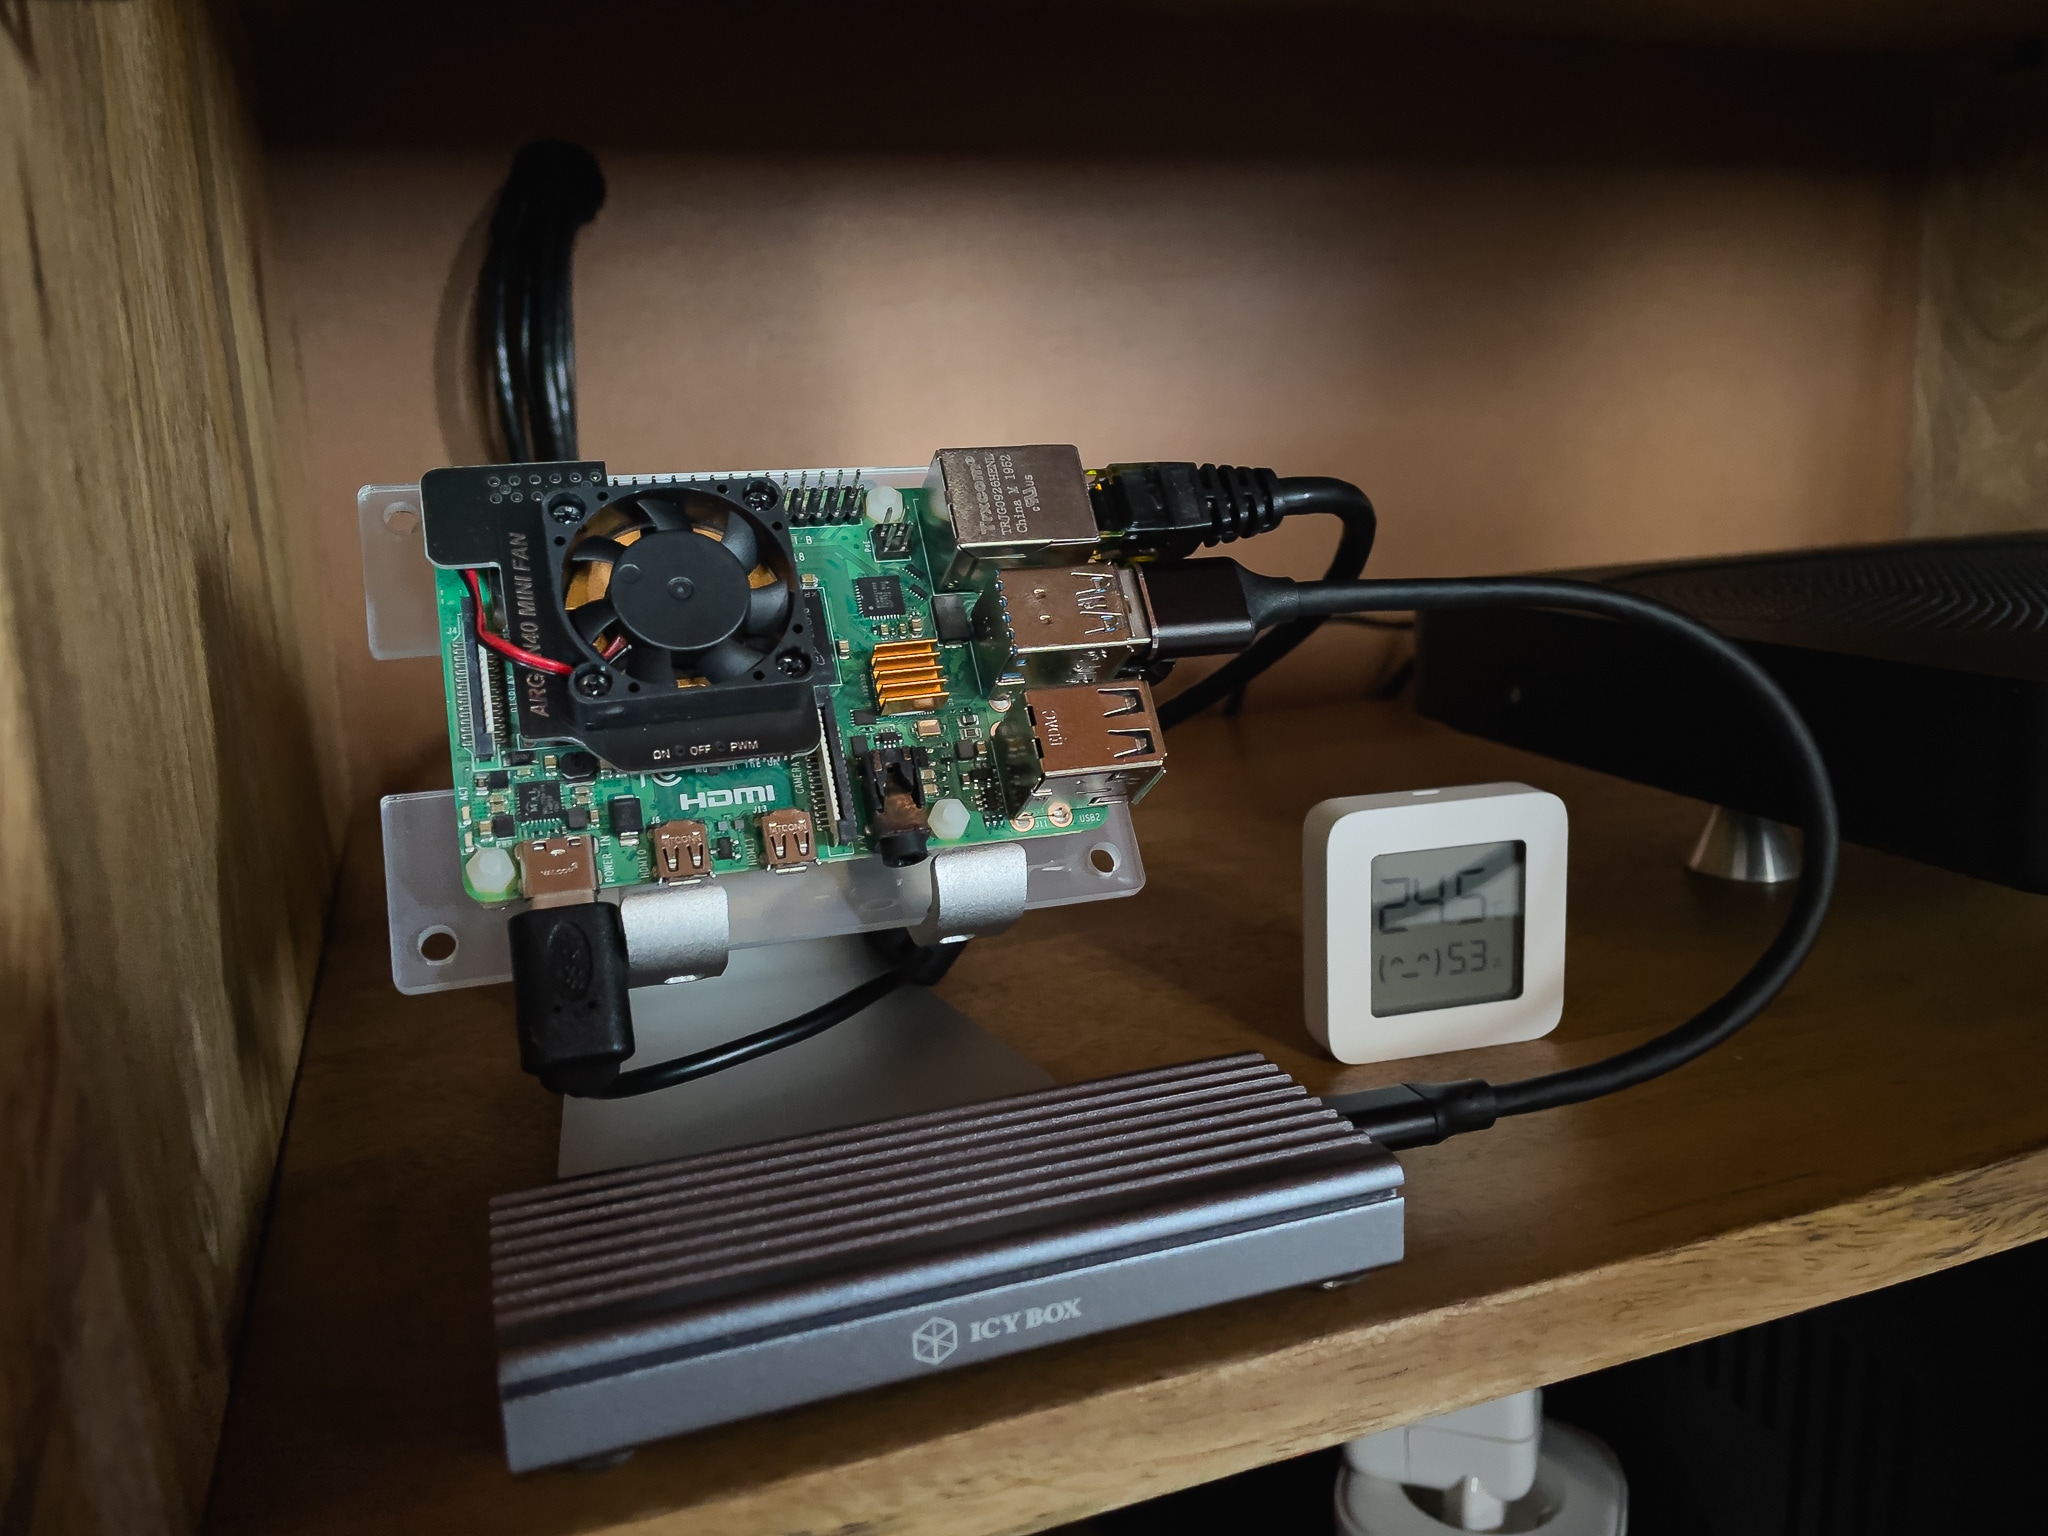
All of these stats are generated by Grafana that’s running, along the Prometheus DB, on the same Raspberry PI 4B - 4GB RAM with DietPI OS booted from a 256GB SSD. And it is hidden inside the cabinet and cooled by a PWM fan with an integrated heat sink: Argon mini fan HAT. I used also this nice GeekPI acrylic enclosure without the top cover and fan (because it isn’t PWM and I want a fan that turn on at 50° and not that’s always on).
Grafana + Prometheus could be a very useful setup, I’ve also added a remote_write to Prometheus configuration, so the database is also sending my data to my (free) Grafana cloud account. This is quite important because if all my stats are online, I don’t need to be connected via VPN to see the stats or expose my LAN devices to the internet and I can give the ability to view the stats also from other people/friends. In order to do it quickly, I have simply copied my local Grafana .json to the remote one so the graphs are the same but they are available via an online URL. Remember that when you copy the .json from local to cloud, in order to save it without errors you need to change all the database source/id with the id of your cloud database of course. And also replace the dashboard id + uid:
"id": local21id, to "id": previous-cloud -id,
"uid": "local-xyz" to "uid": "your-grafanacloud-db"
and uid + version at the end of the json to match the current cloud .json:
  "timezone": "browser",
  "title": "R7800 OpenWRT cloud",
  "uid": "0CCohKrafr",
  "version": 33,
  "weekStart": ""
Screenshot of the (same) online stats:
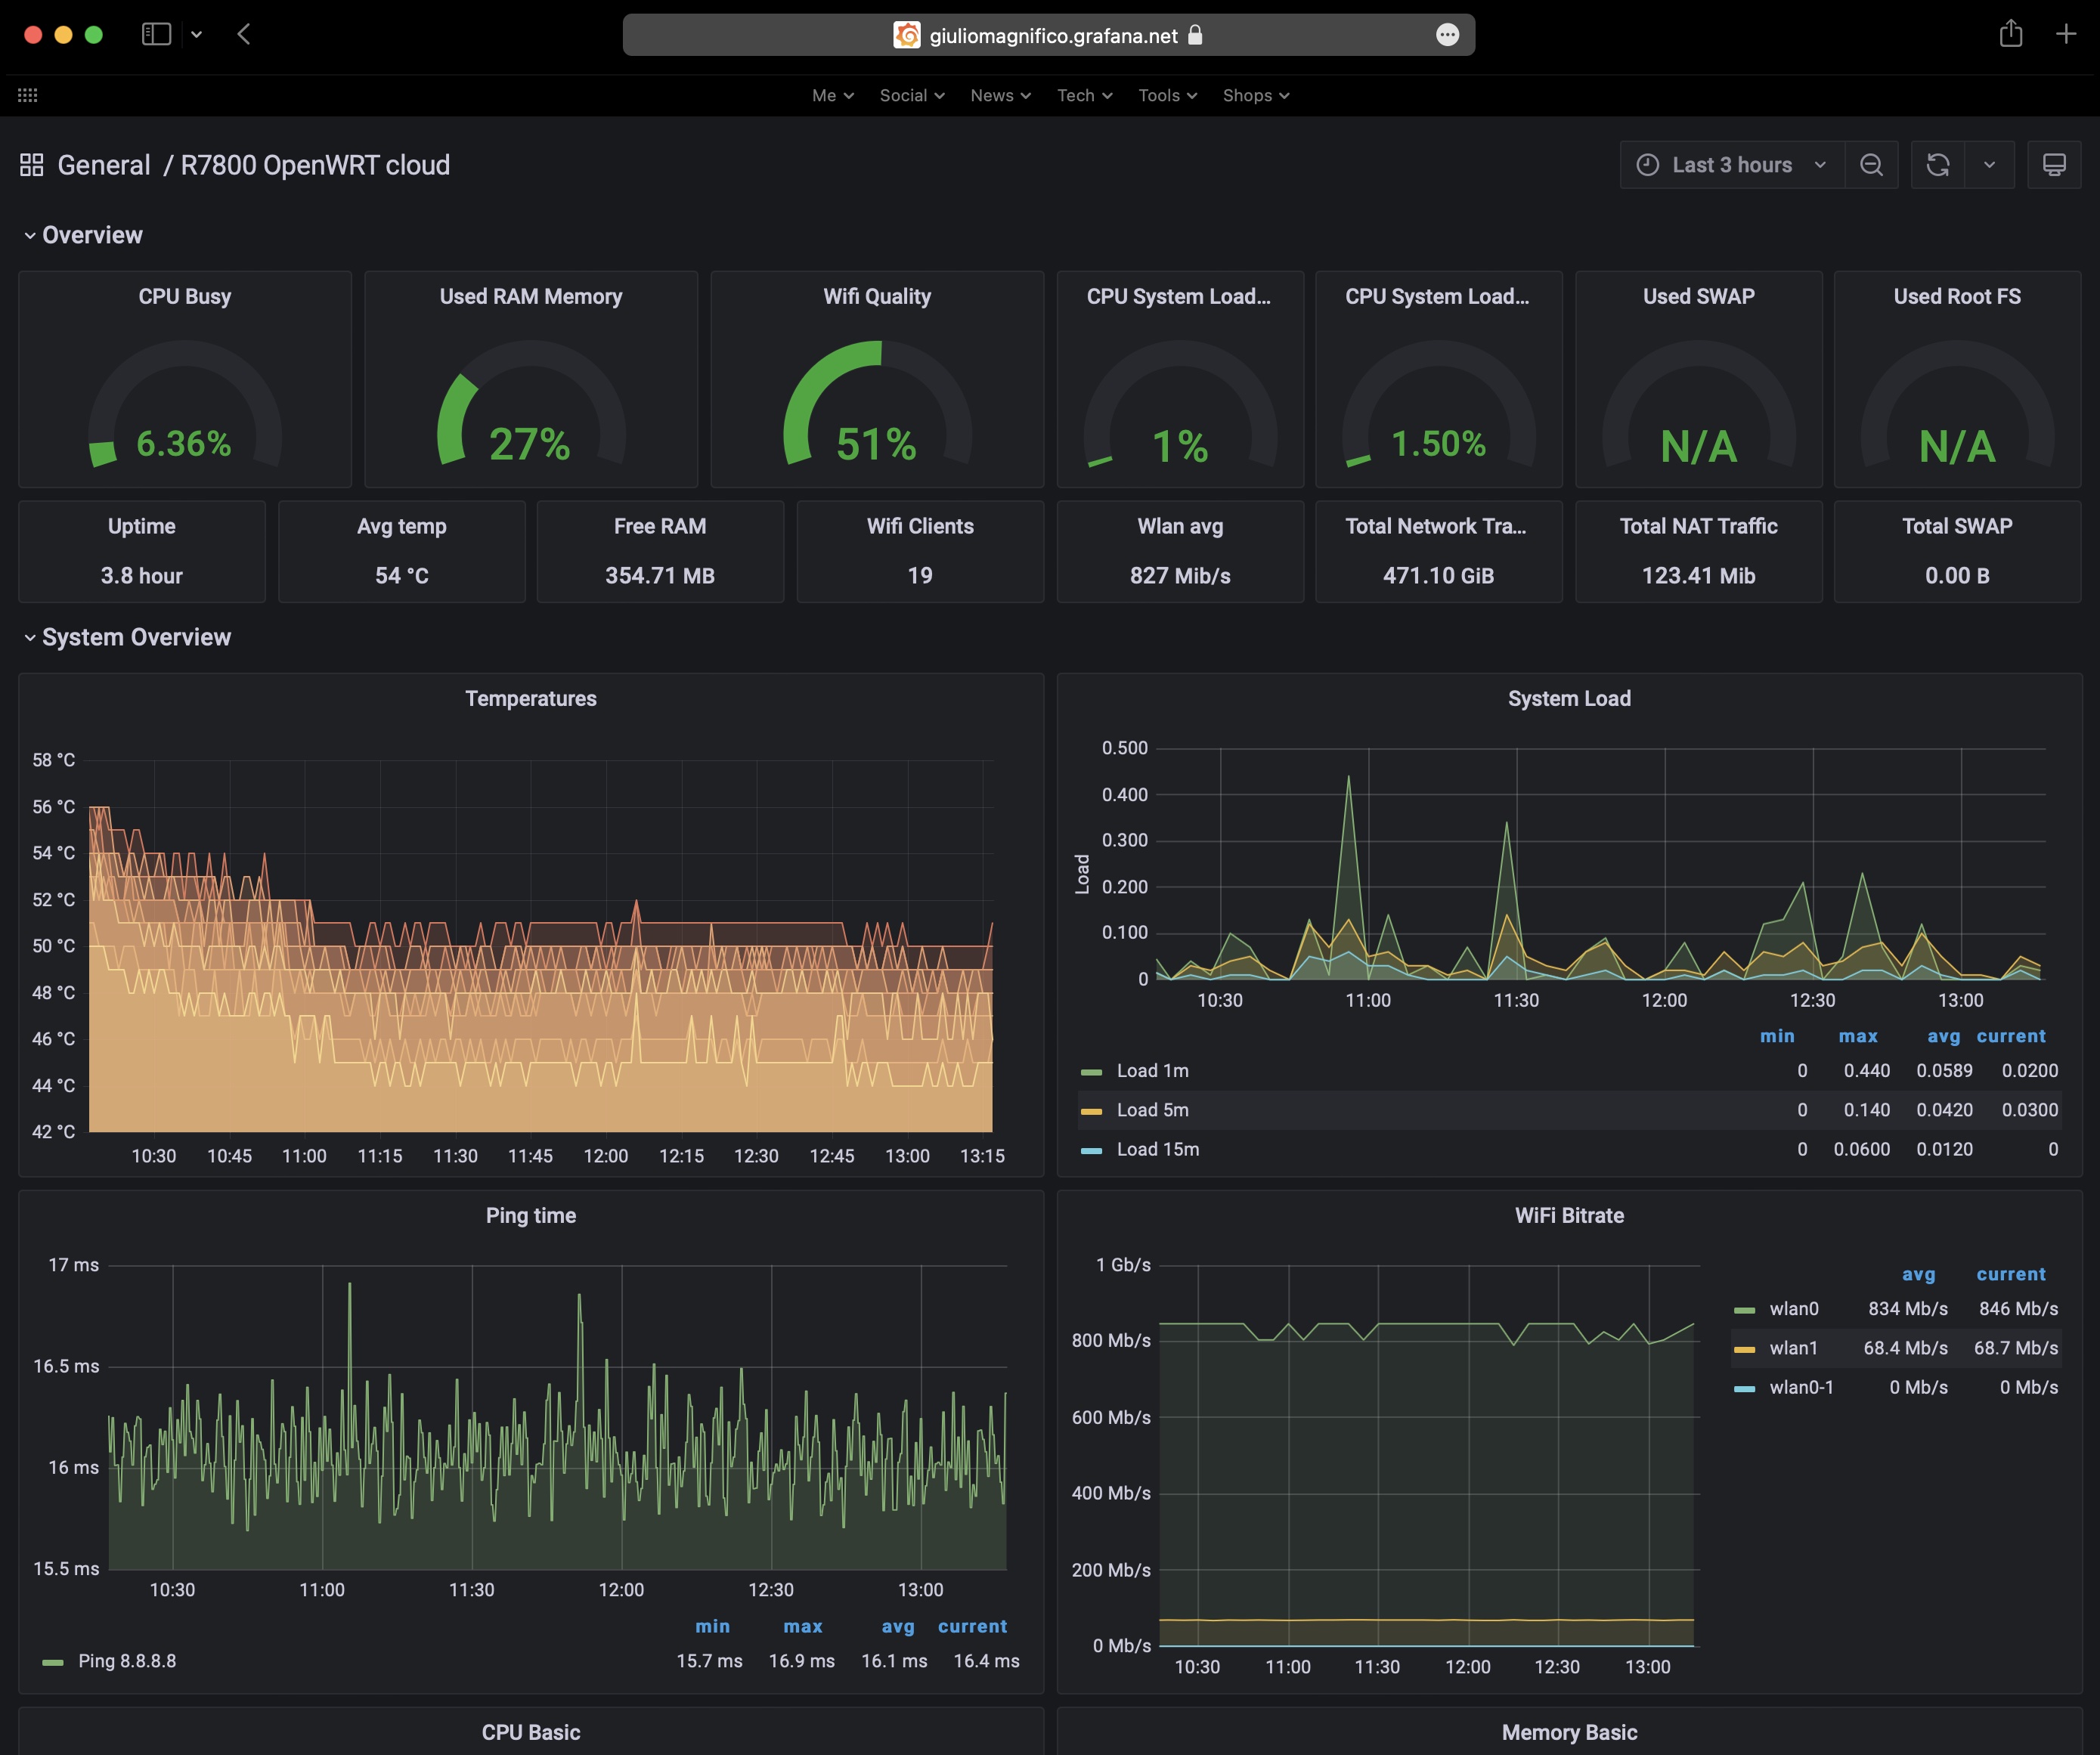
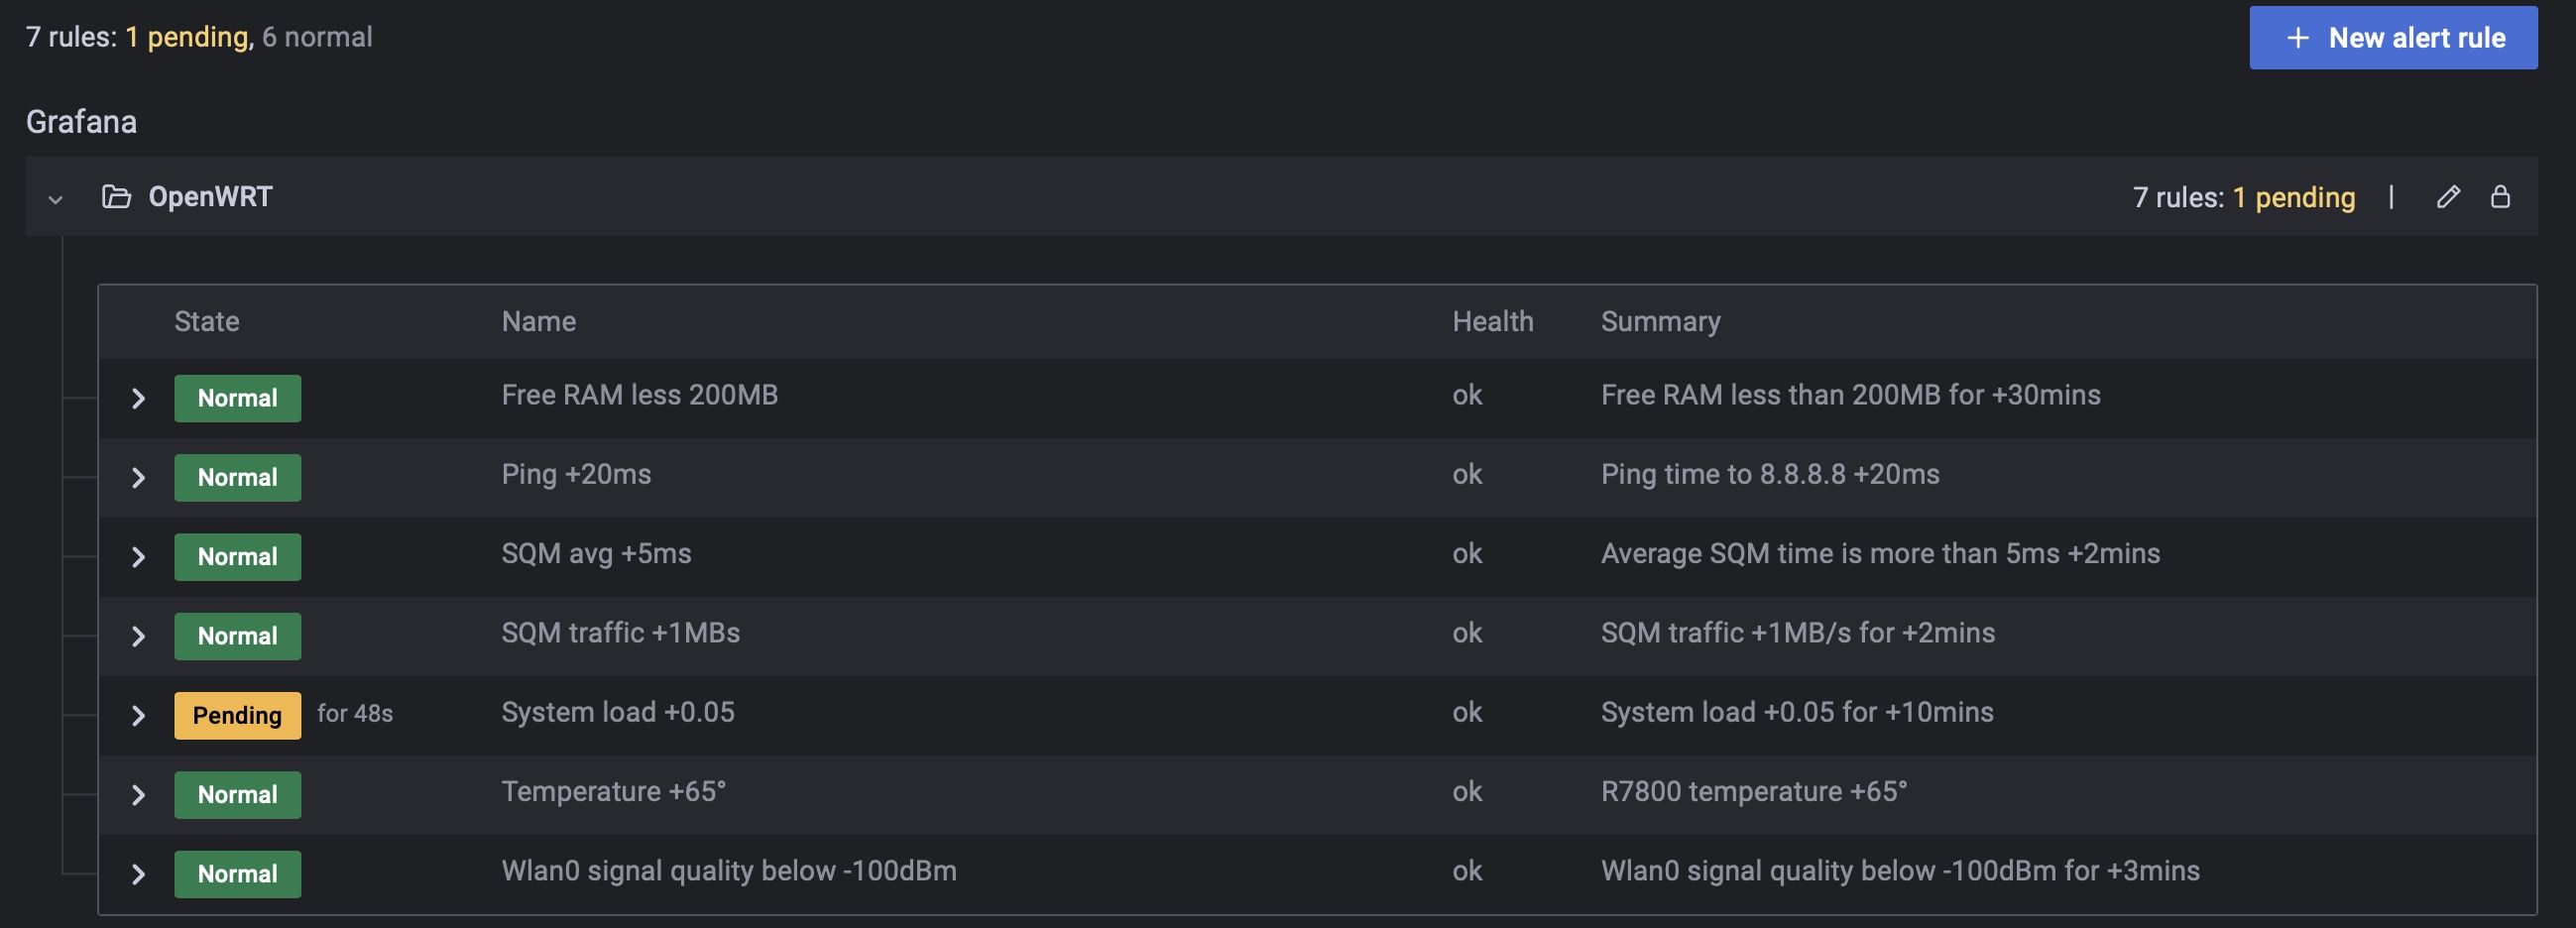
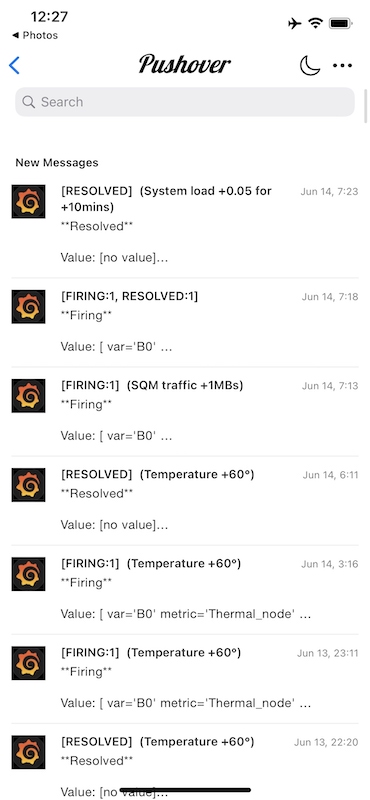
This also allow me to use the Grafana alert (I’m using Pushover to get the push notifications on my devices) and have some useful alerts, for example, when the router temps are over 60° for + 5 minutes, or the SQM average latency is more than 4ms for + 3 minutes, when a MAC address is offline, when the S/N ratio of the main wlan is below db, and so on…
P.S. why not use only cloud Grafana? Well because I’m on the free plan and in order to keep your data for more than xGB or yTime, you have to pay. And I don’t want to pay for it, also because the local Grafana pages are faster to load and I prefer to use (and backup) my local SSD to store long term data.
Pi-Hole with HyperPixel and custom PADD
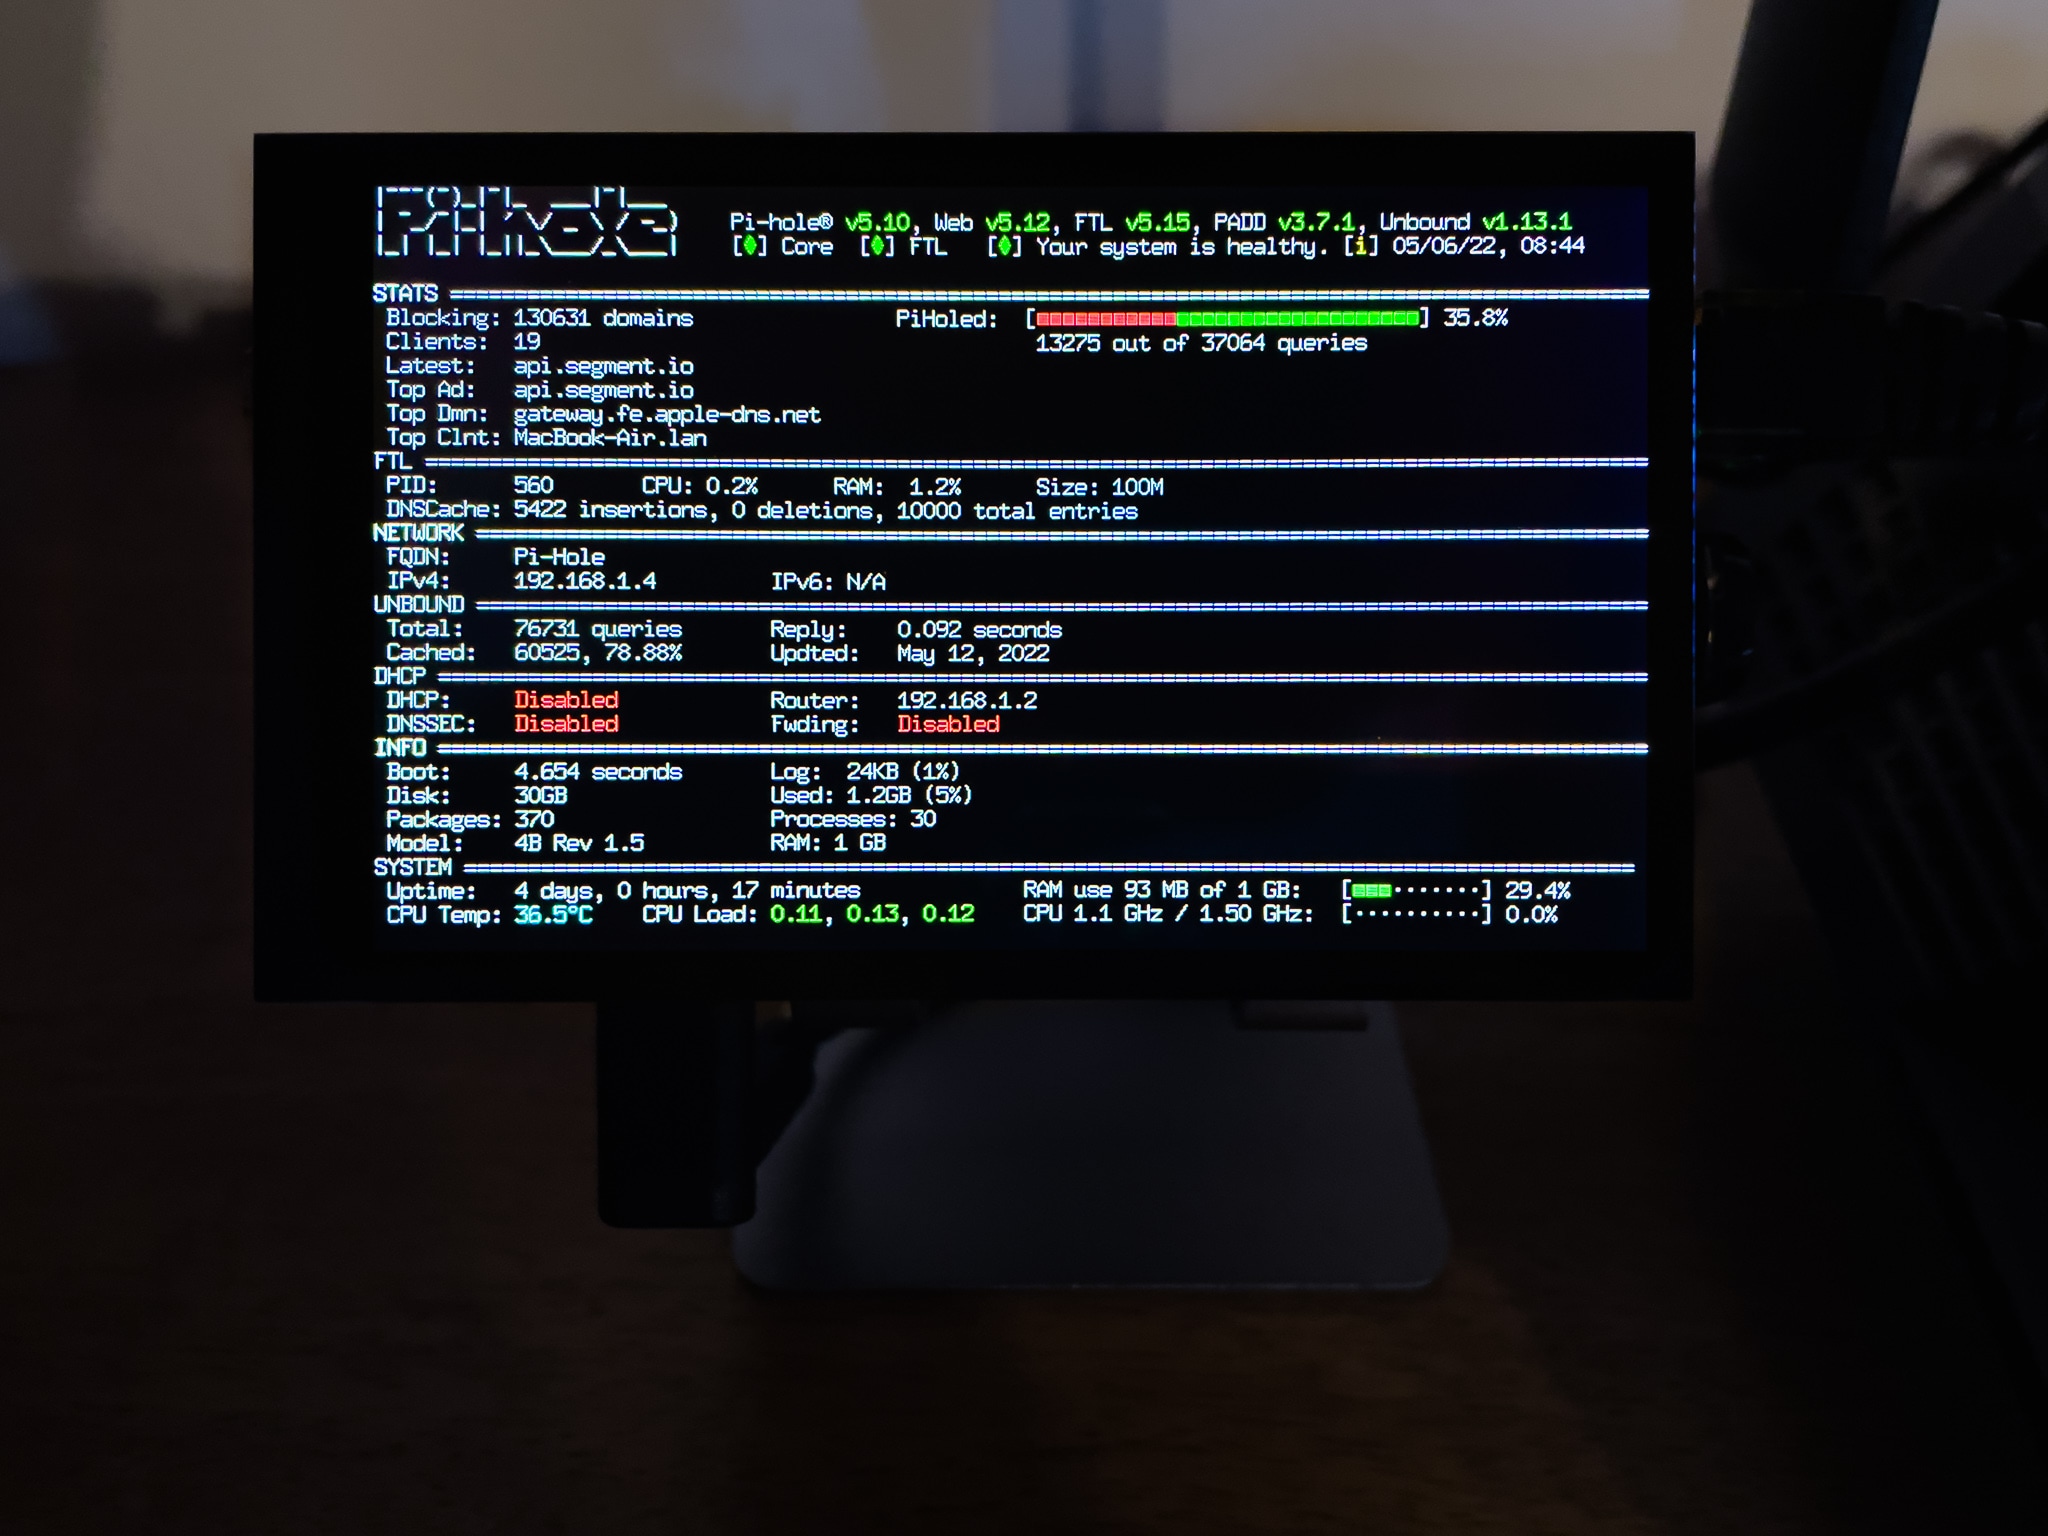
Going forward, another Raspberry PI 4B (but this has 1GB RAM) running also on DietPI, is acting as Pi-Hole and Unbound recursive DNS server, that is blocking all the ads and requests (“calling home”) by the IoT devices (Amazon, Apple and Google get the top spots)
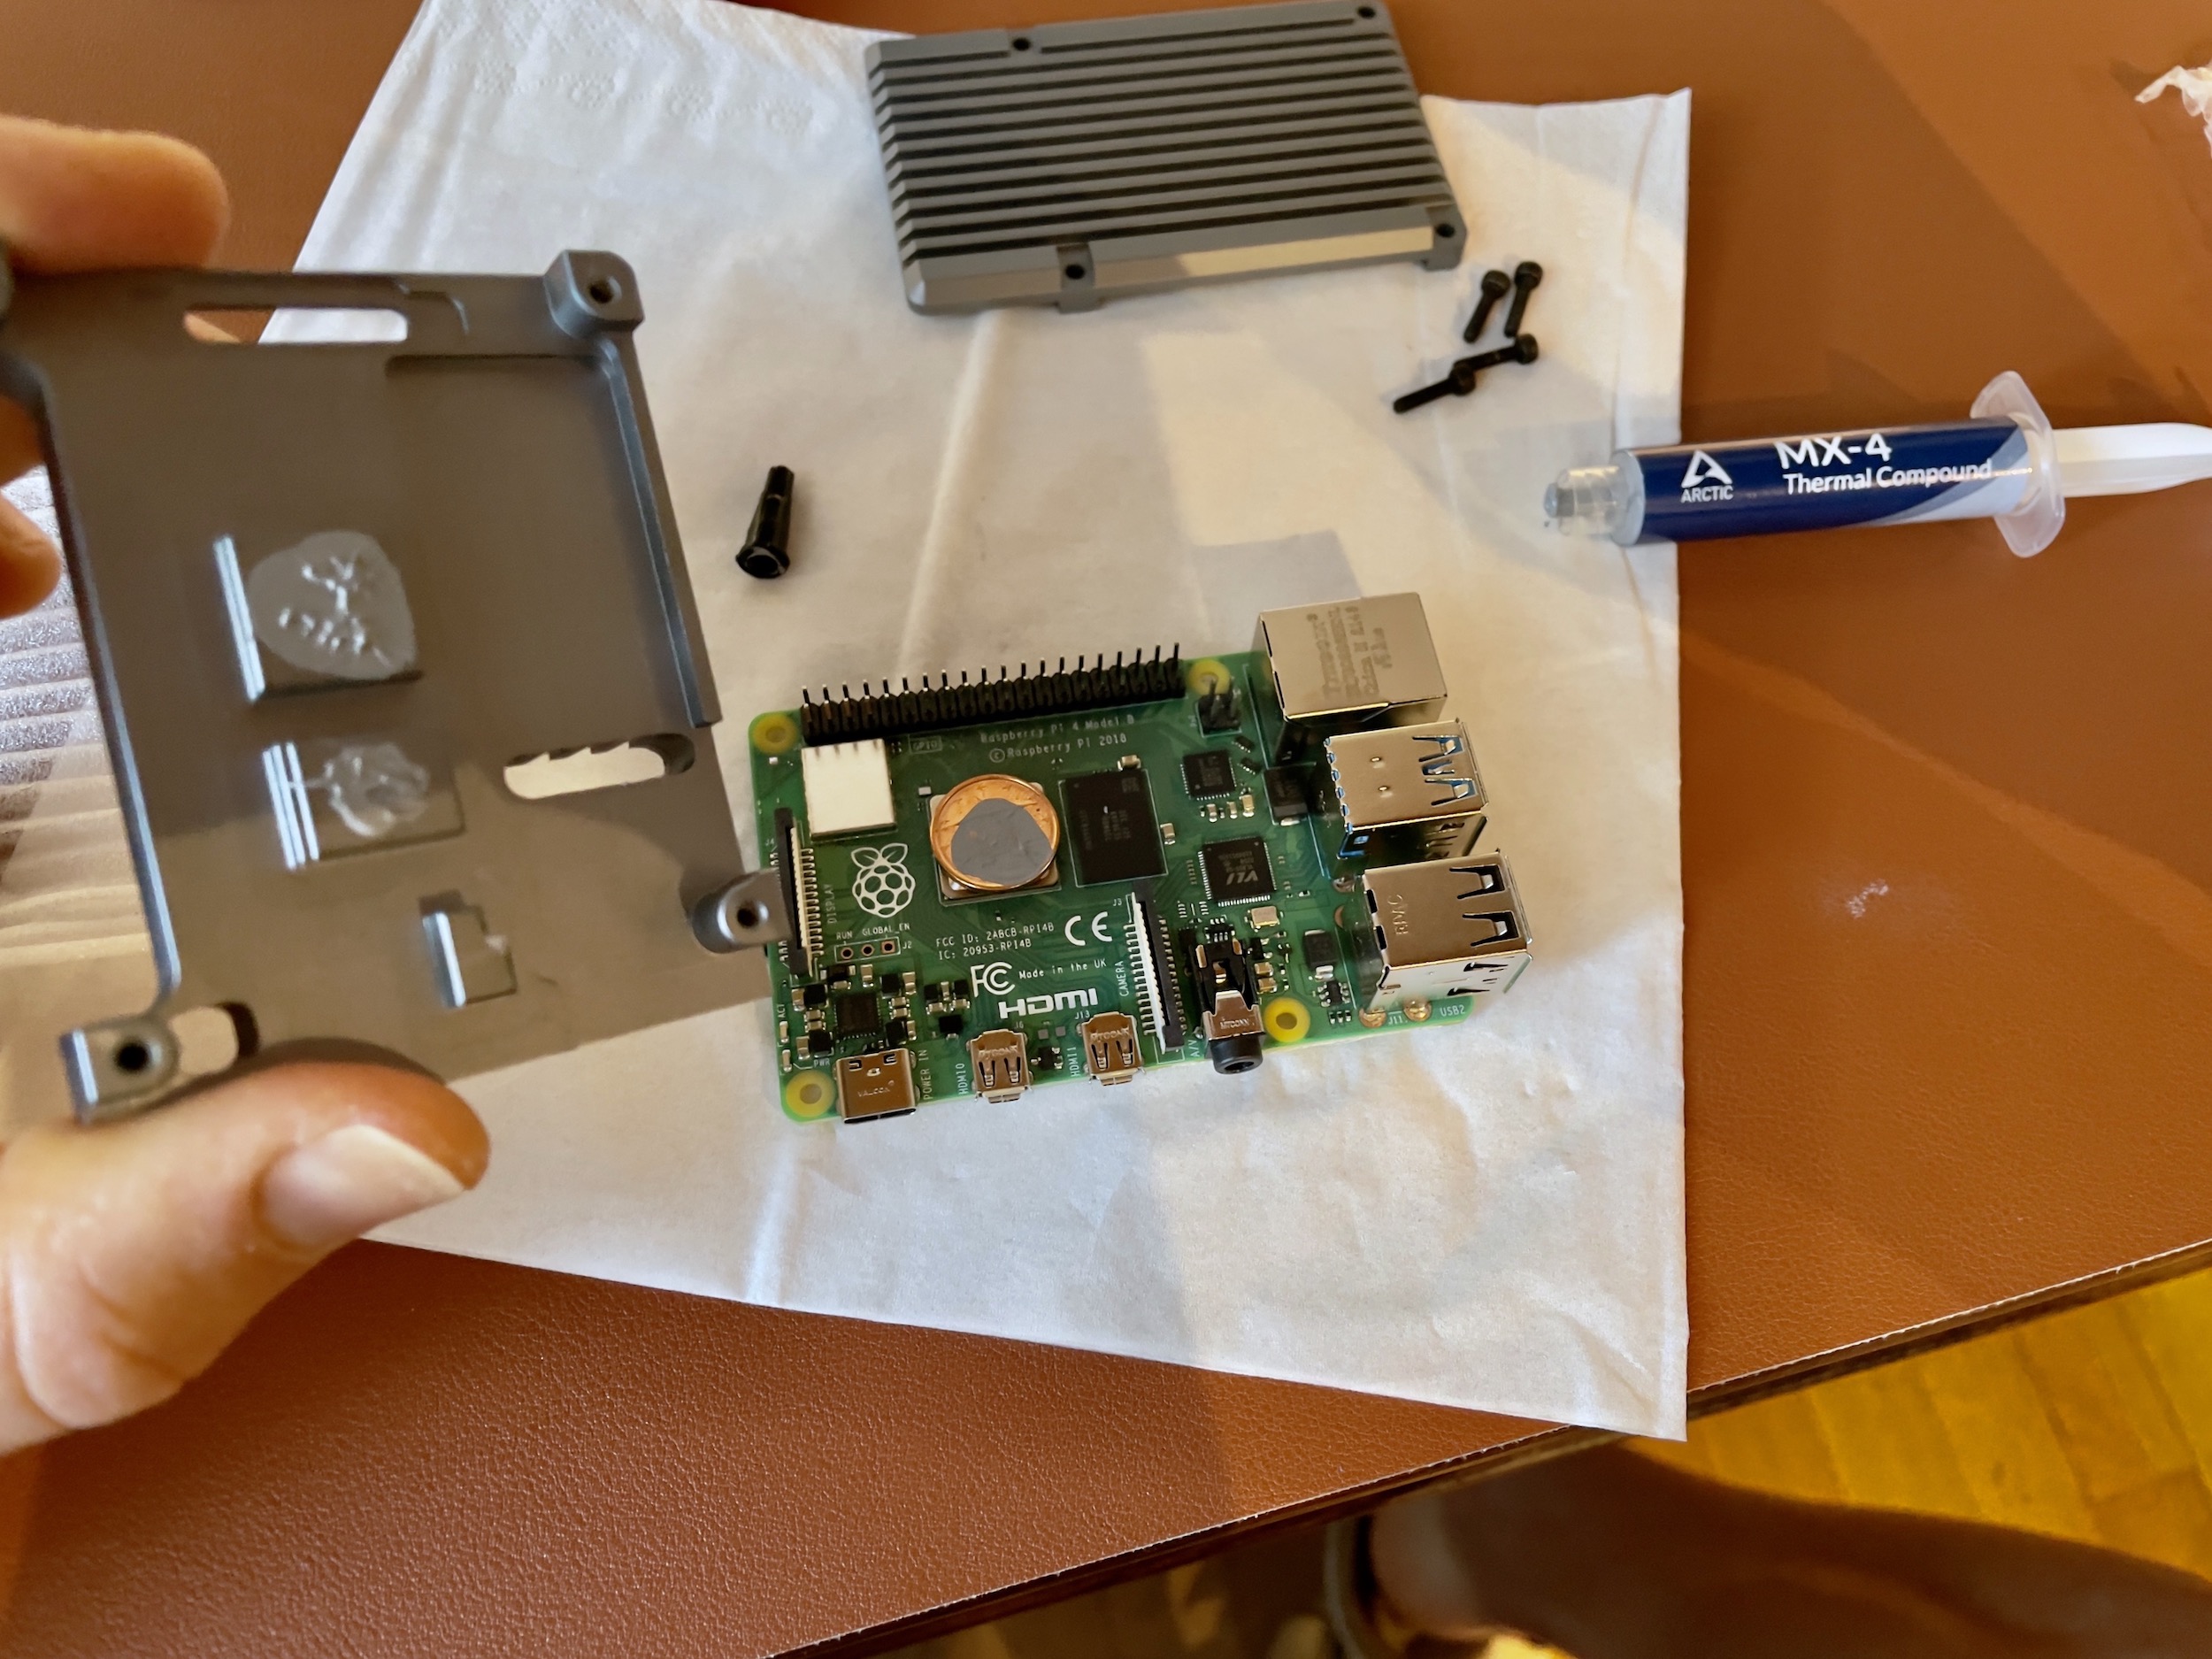
This Raspberry PI is cooled by the Pimoroni Aluminium Heatsink Case and I suggest you to use a (very expensive /s) 0,1€/0,2€ coin as heat conductor with a good thermal paste, instead of the default terrible heat pad (but fix it well by moving slowly the coin). It works better and the temps are lower.
Attached to it there’s a Pimoroni HyperPixel 4” display with my custom PADD script to fill the entire display and have some extra useful info, but readthis arricle I wrote to find the script and details.
Remember the trick of the toothpick to keep it in the right angle, avoid to bend the GPIO pins and give it few centimeters for the heat dissipation.

Homebridge server for HomeKit
Last there’s the other RPi 4B (2GB RAM) that’s actually a Homebridge server to use all my connected devices as HomeKit native devices. It simulates an Apple HomeKit server but it’s not “somewhere” inside the Apple data centers, but it’s here at my home.
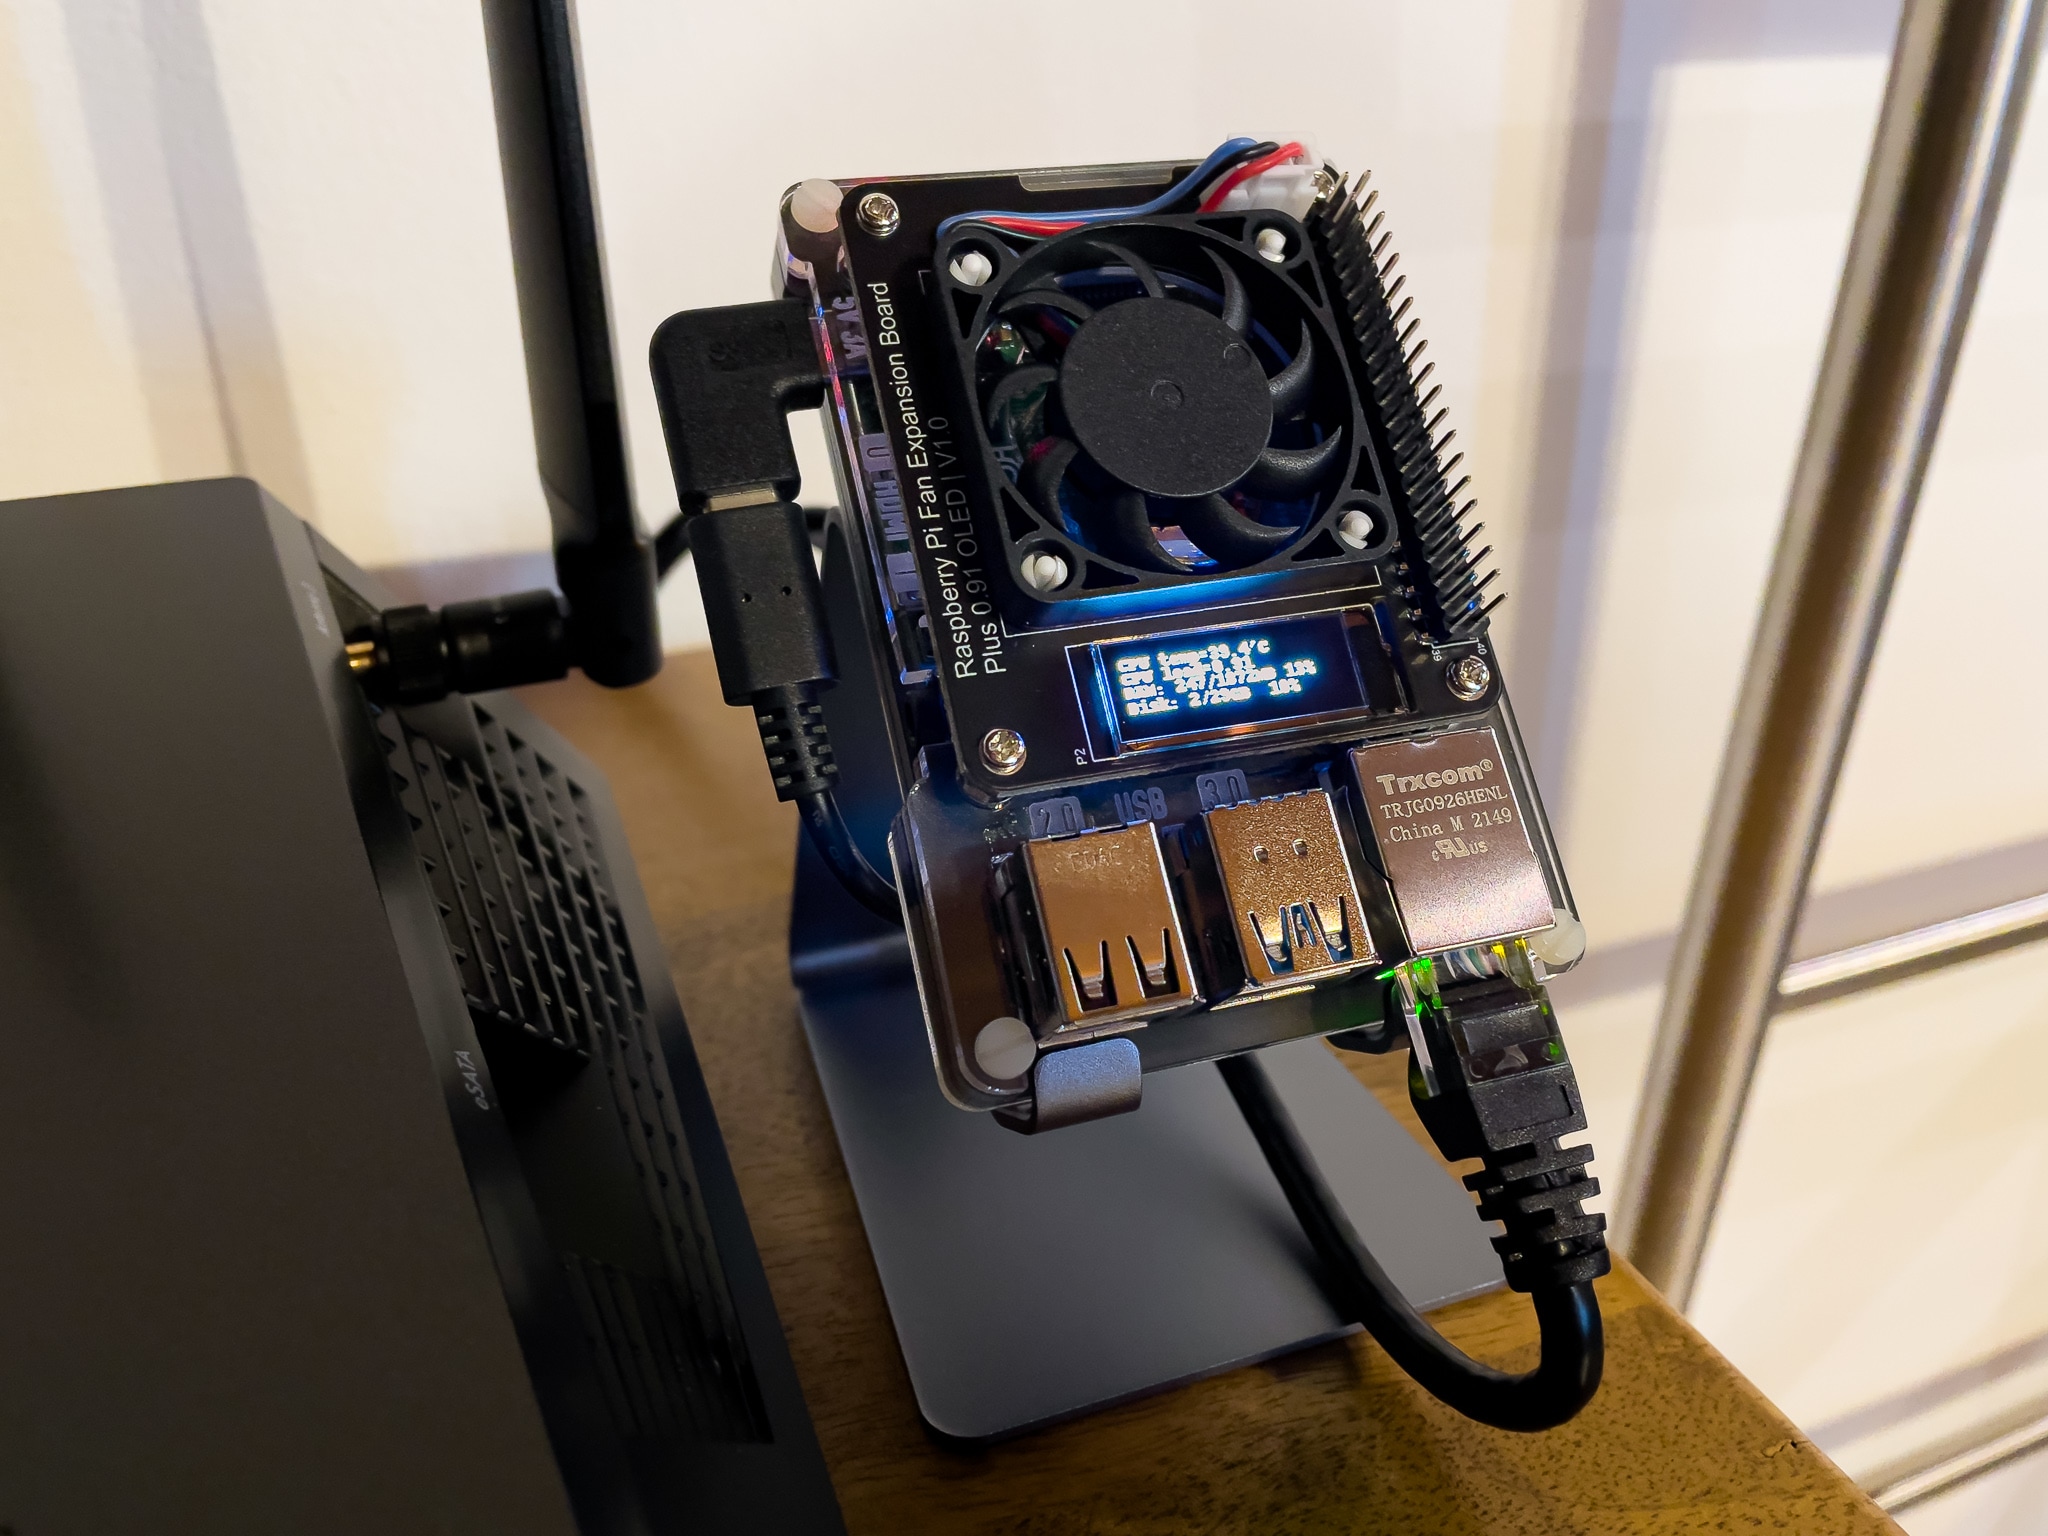
If you need more info on the fan HAT and the custom code I’m using to display the stats, I wrote another article here: GeekPI Raspberry PI fan hat with OLED Adafruit display fix and mod
And I think it’s the only way to use HomeKit/Home app (at least now/in 2022) because without Homebridge, Home app flexibility is terrible and the Apple HomeKit integration is awful.

Here are my plugins:
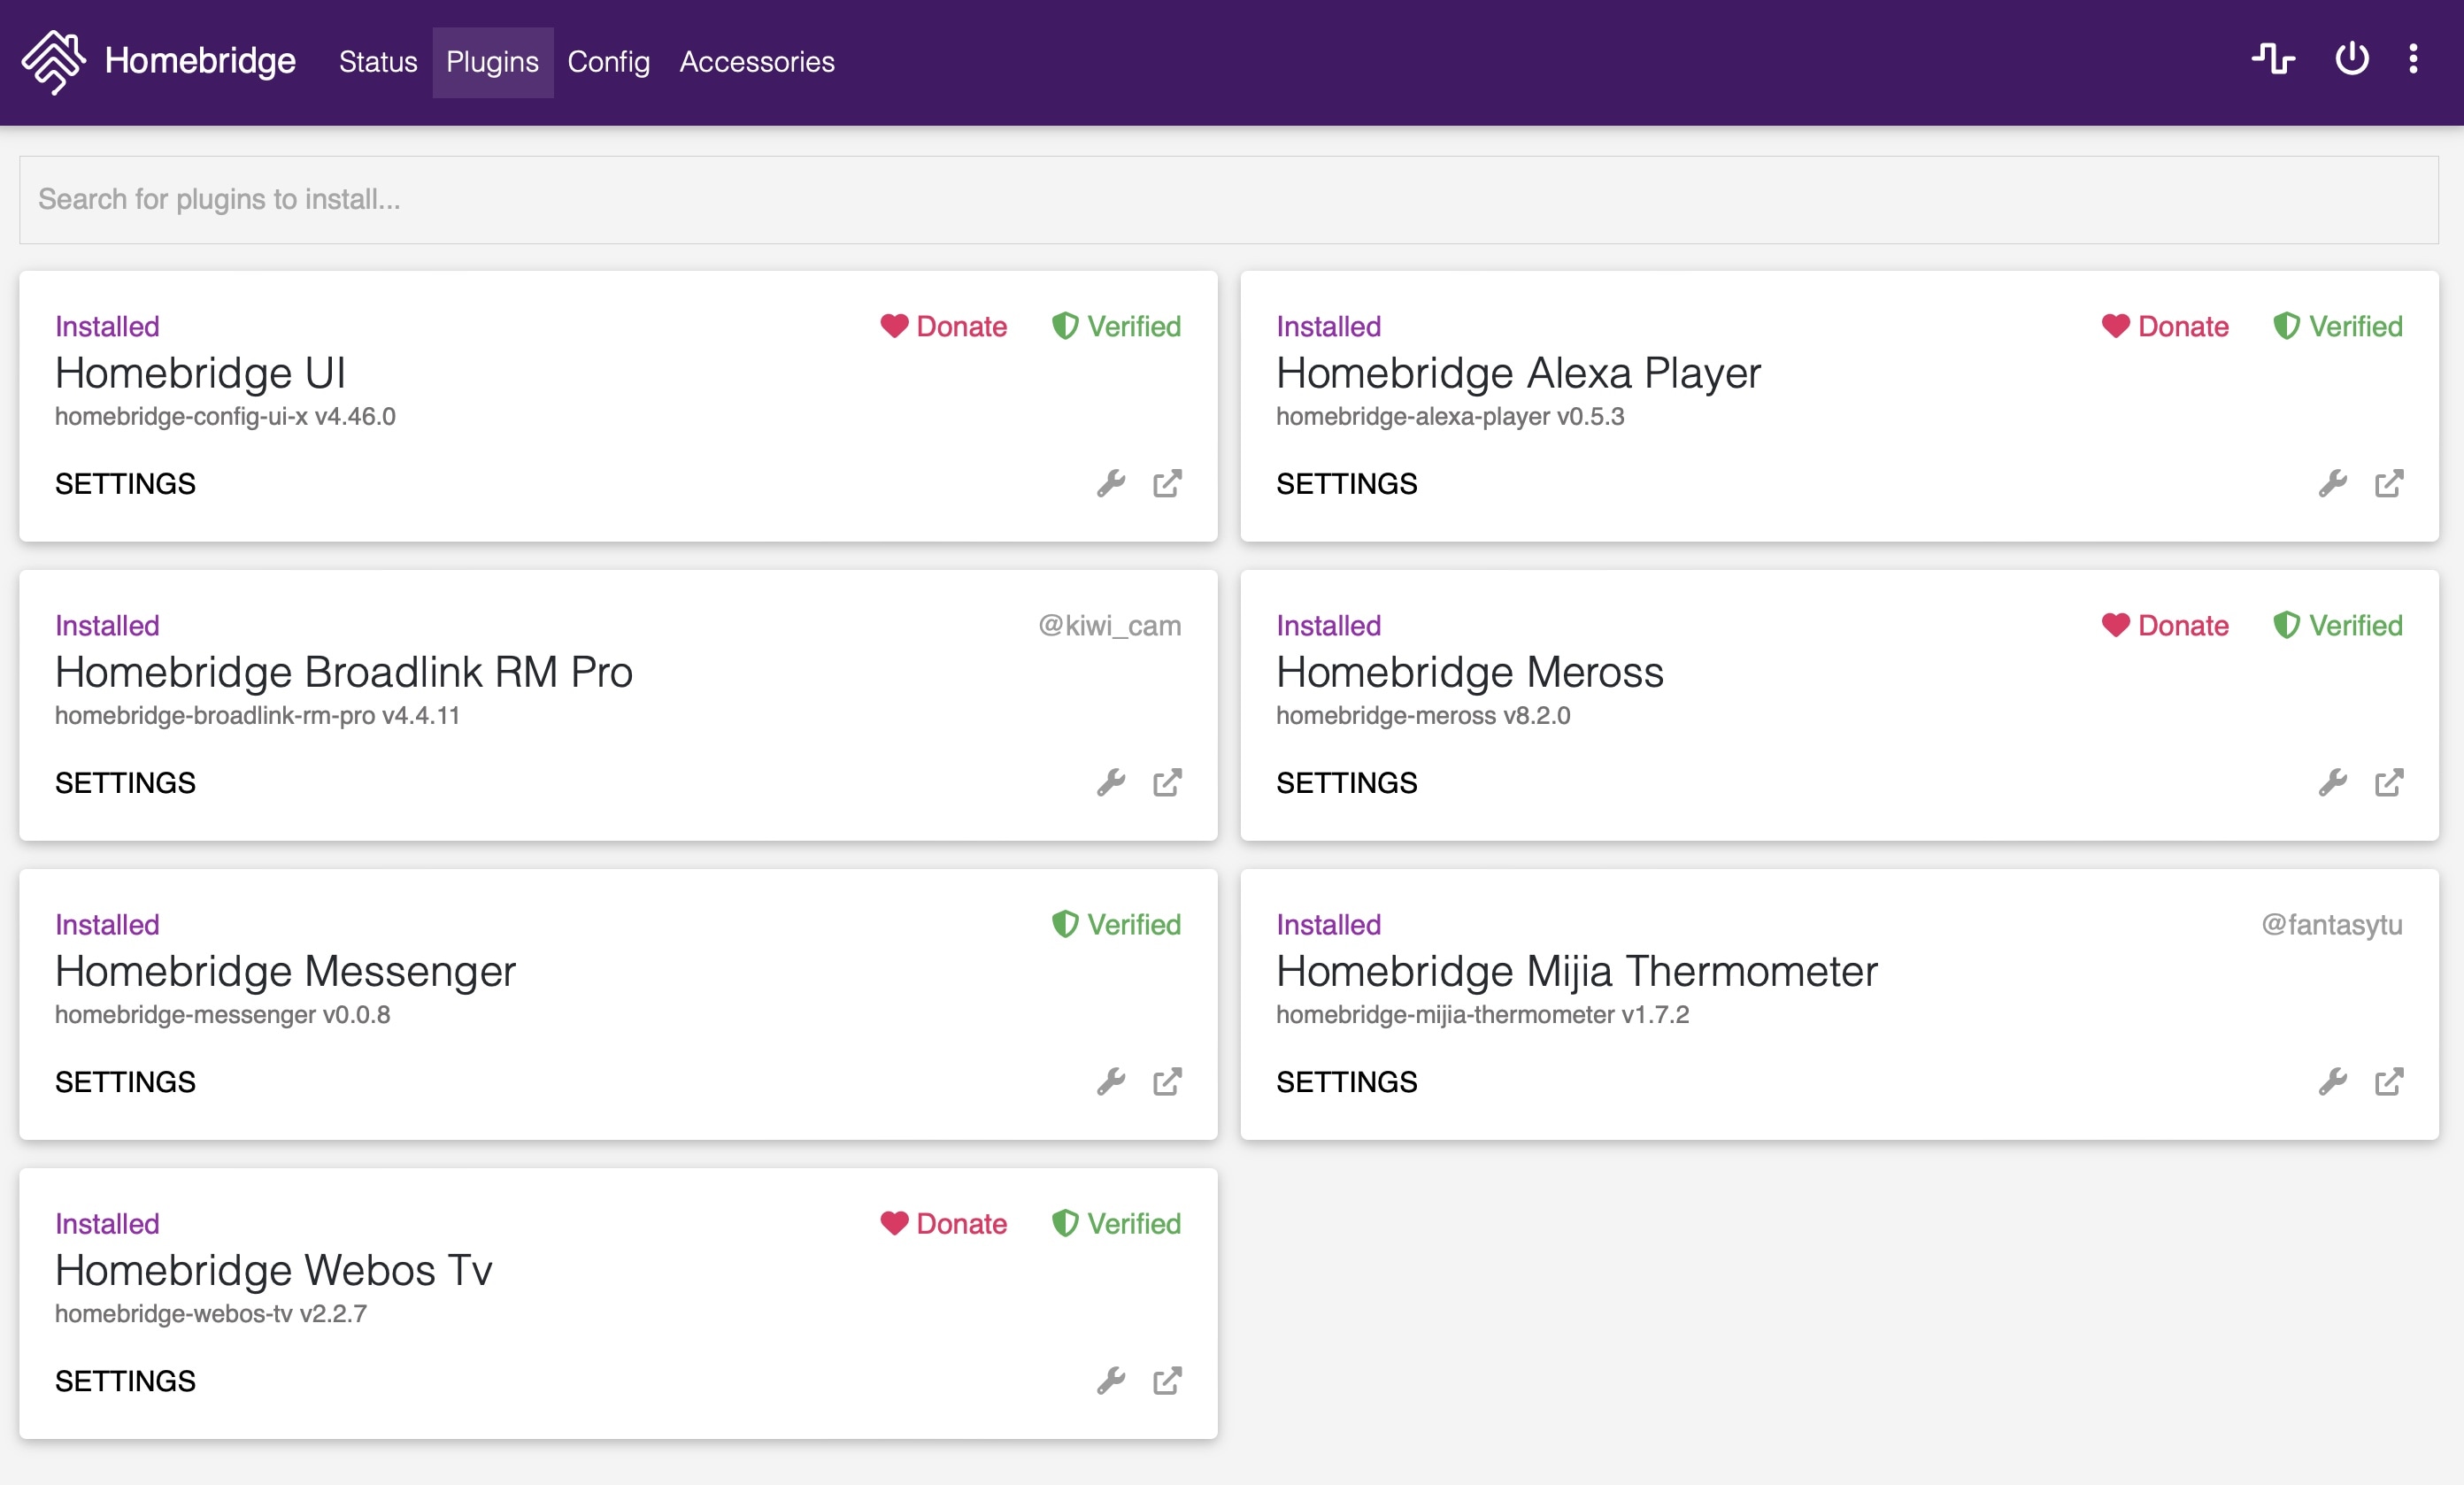
I’m using the Homebridge Meross plug-in to control all the switches, so I can turn on/off the lights.
The Homebridge Broadlink RM Pro plug-in is the most useful for me because with it I can control both the 2 air conditioners and a fan. Unfortunately the setup is a bit long, because you have insert every single temperature HEX code (I mean 20-21-22-23…etc…) to Homebridge configuration. Explained (ELI5), you have to press every single button/temperature of the fan or A/C, go back to the Homebridge log, copy the HEX code and from the logs and insert it into the .json configuration. The result is fantastic because you have a very nice interface with all the buttons that are working and personalized. For example I can tell to HomeKit that the “oscillate” button of my fan, instead of oscillate, turn off the display to don’t have it on during the night. Or you can write the default turn on temperature for the A/C (and not the last used like the remote pointer). Another useful tip that I set is to send two code as default on HEX code for the fan, one HEX turns it on, and the second one turns on the oscillation. So it always turn on and oscillates by default (see example code below)
                    "host": "192.168.1.170",
                    "name": "Ventilatore camera",
                    "type": "fan",
                    "allowResend": true,
                    "data": {
                        "on": [
                            {
                                "data": "blablablahexcode1234",
                                "pause": 0.5
                            },
                            {
                                "data": "blablablahexcode12345",
                                "pause": 0.5
                            }
                        ],
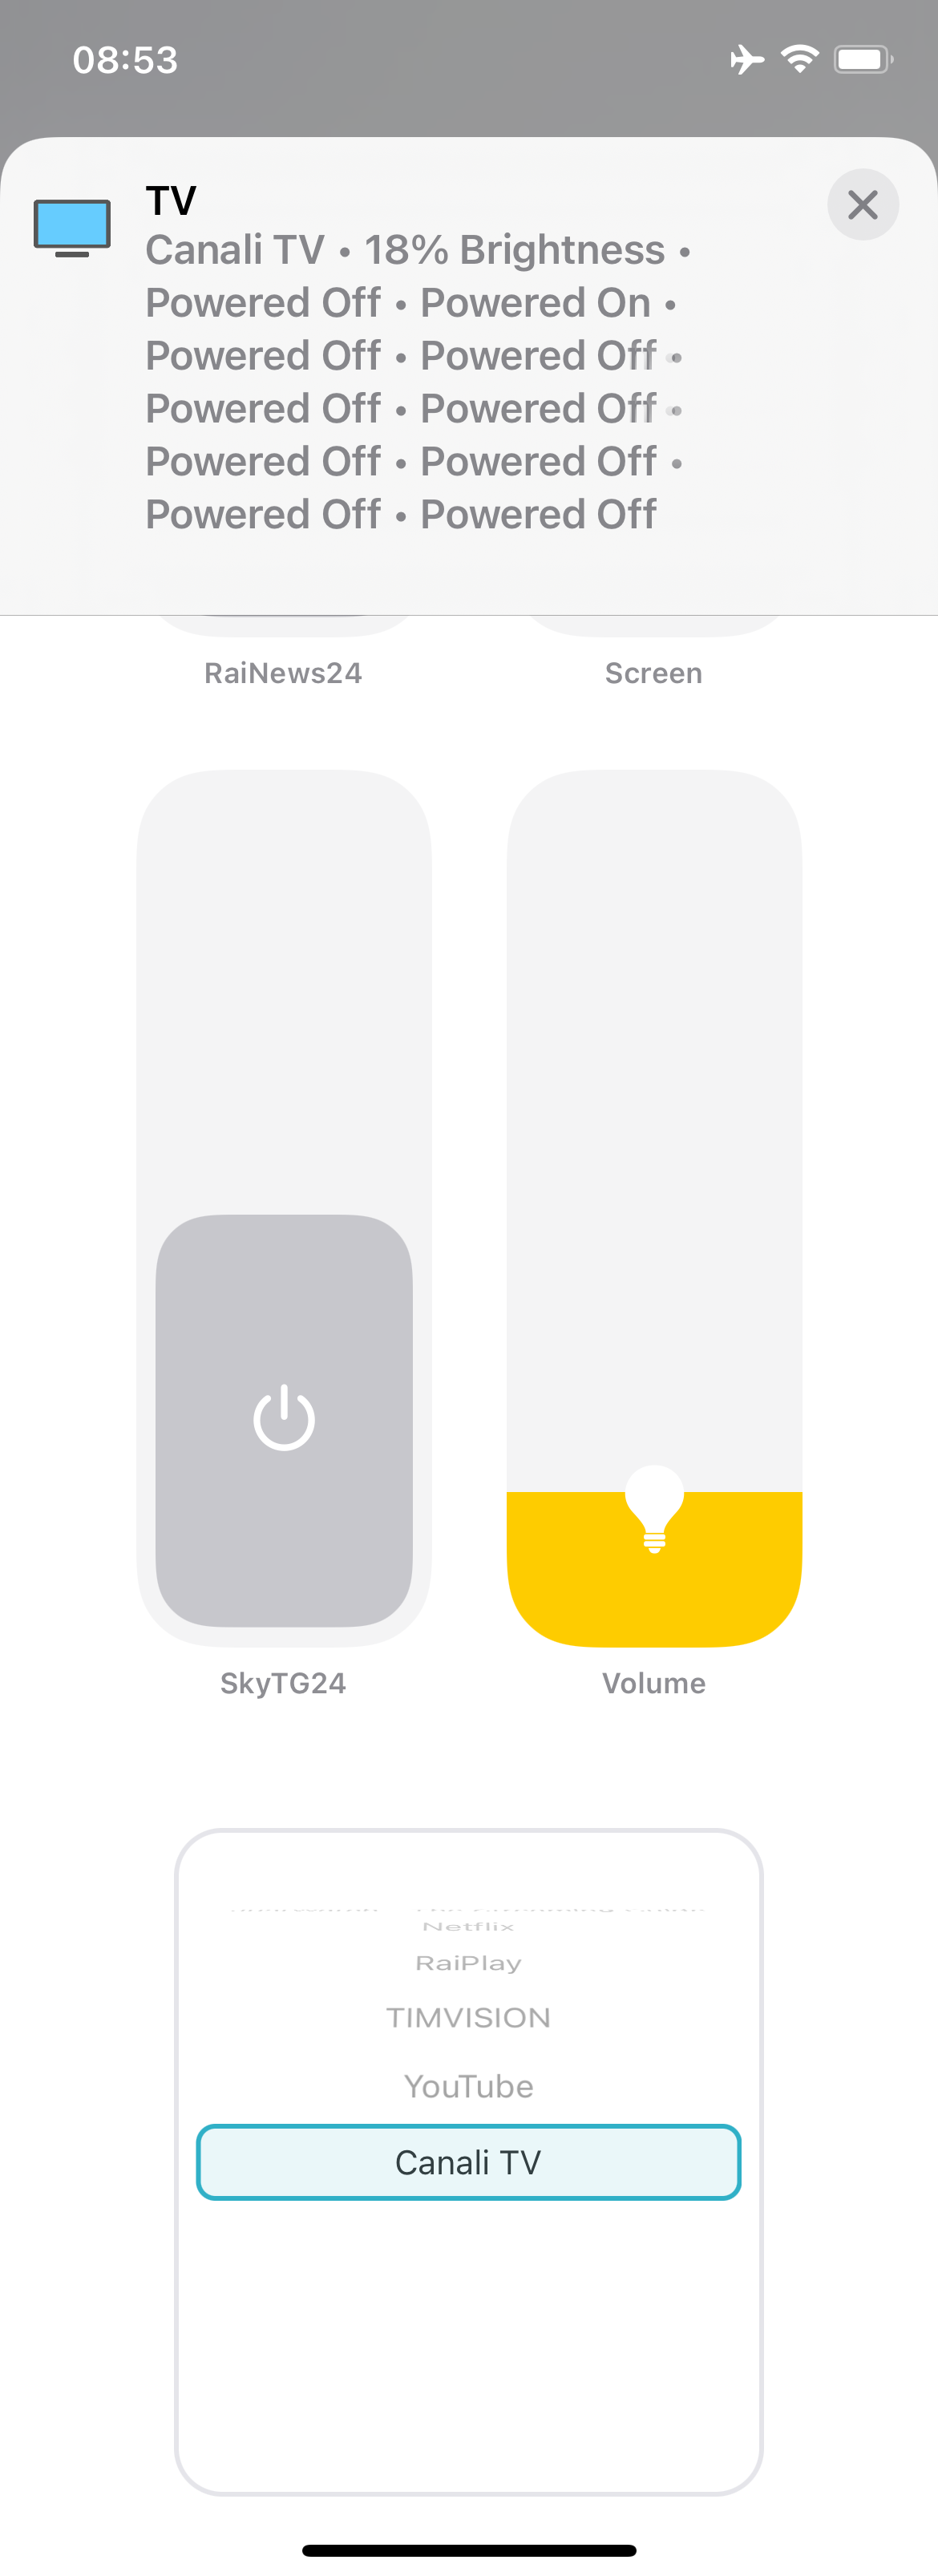
Another plug-in that I use a lot is the Homebridge LG webOS TV plug-in that extends the default LG television features. Just to explain how awful is the default HomeKit support: my LG tv (LG OLED55C14LB) has HomeKit native support, and what can I do with it? Well, turn on, and turn off the TV. Nothing else. Really, it’s useless. Instead with the webOS Homebridge plug-in I can turn it on/off, set some preset channels (they’re simulated as switch in Homebridge), or rise/lower the volume (this is simulated as lamp brightness in Homebridge), change the source, turn off the display but not the tv, and a lot of other features:
The Homebridge Messenger plugin is quite usefuel, because it allows me get push notification (from Pushover, again), when xyz happen at my home. For example I’m using it to send a messagge when the temperature inside the server cabinet is above 28°C, or the CO2 in my bedroom is above 1000ppm, etc…
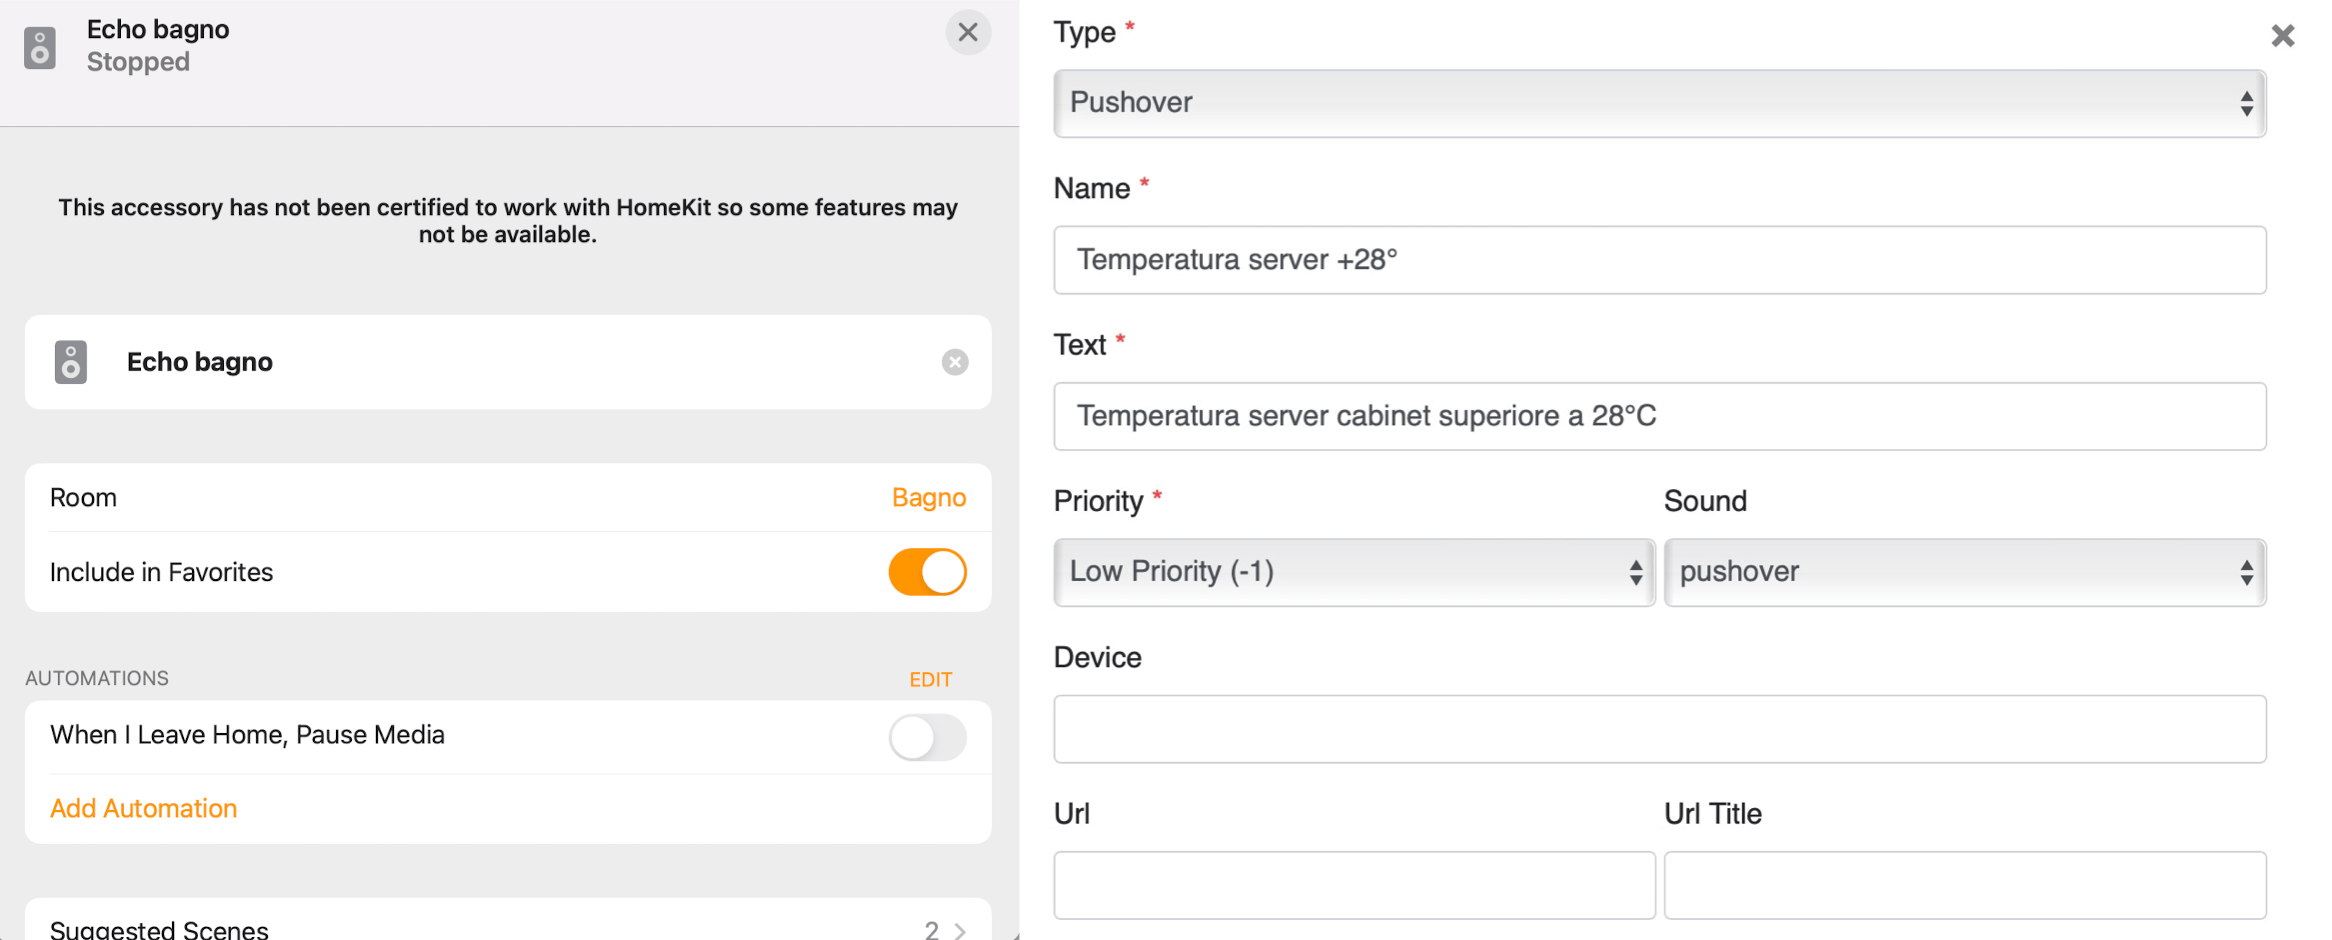
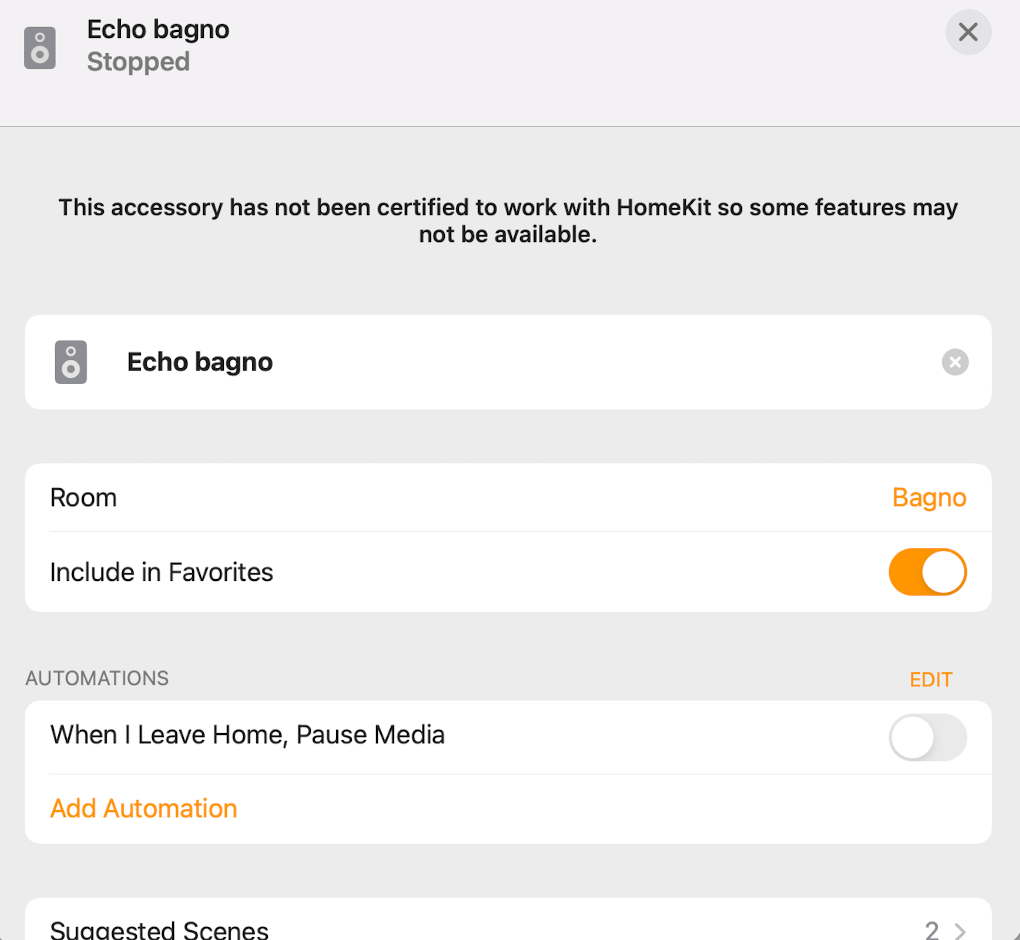
The Homebridge Alexa Player plug-in simulates an Echo device as a HomeKit speaker device, at the moment you can only play/pause the audio and nothing else. But it’s useful to have also my Echos in the Home app, because you can include them in some automations or stop the audio when you’re outside home:
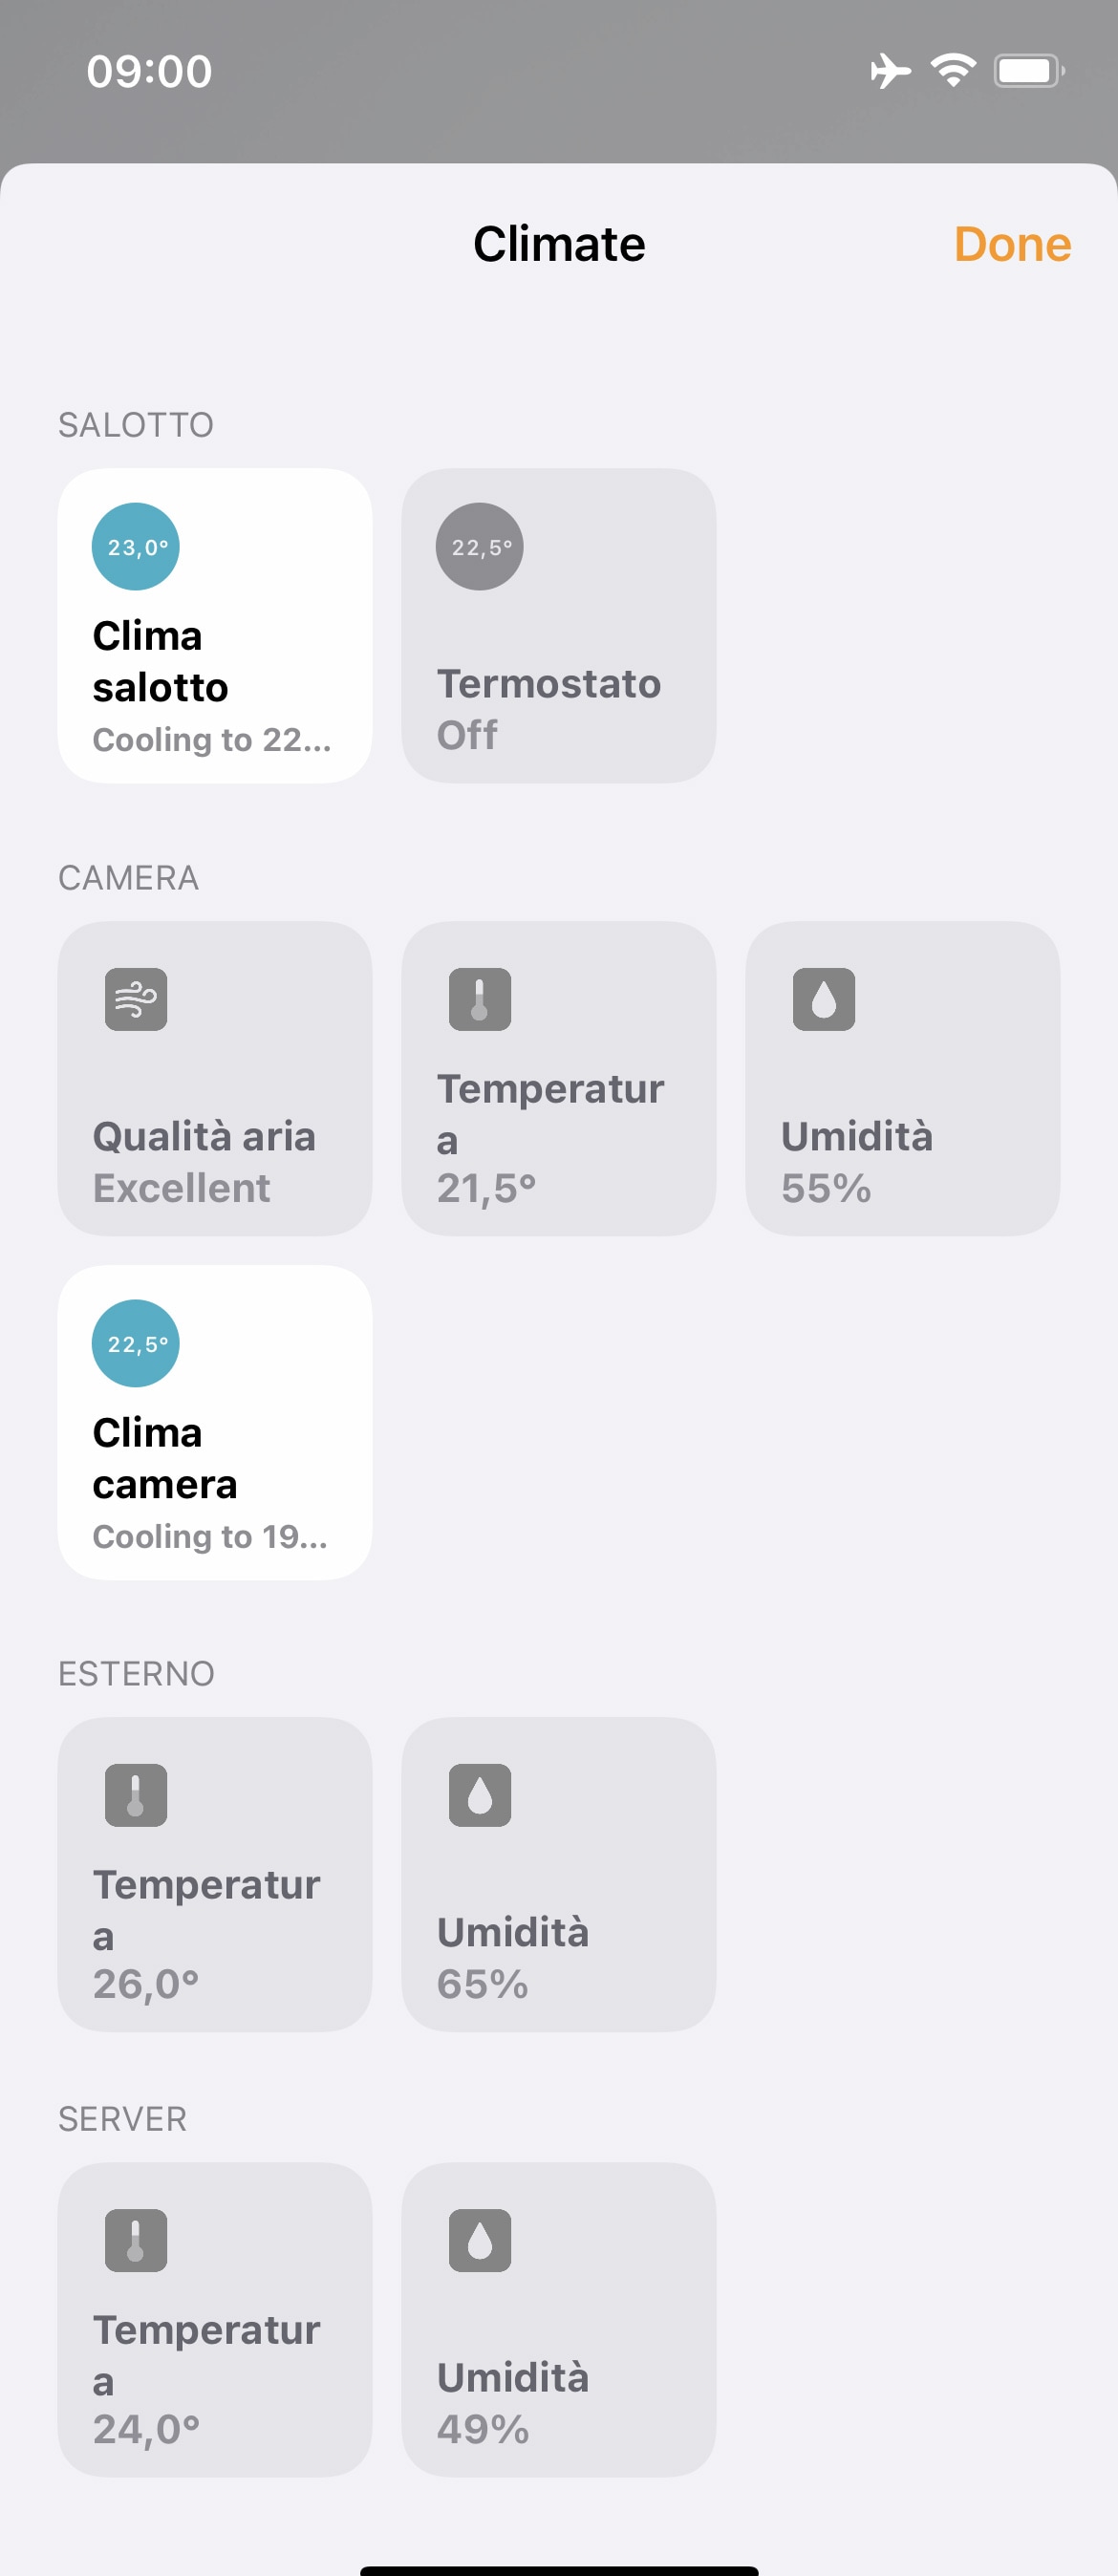
The last plug-in is the Homebridge plugin for the Xiaomi Mi Bluetooth Temperature and Humidity Sensor, that simply allows you to use a 3/4€ Xiaomi thermohygrometer as a HomeKit native accessory. I’ve put one inside my server cabinet and I monitor the temperature inside it for few euro.
But, since the default Xiaomi bluetooth signal is encrypted, you need to get the “Xiaomi bind key” using the great Telink Flasher for Mi Thermostat from GitHub ATC_MiThermometer.
iPad as hub
Recently I also added an old iPad Air 2 (bought for few dozens of euro) and I think it’s absolutely necessary.
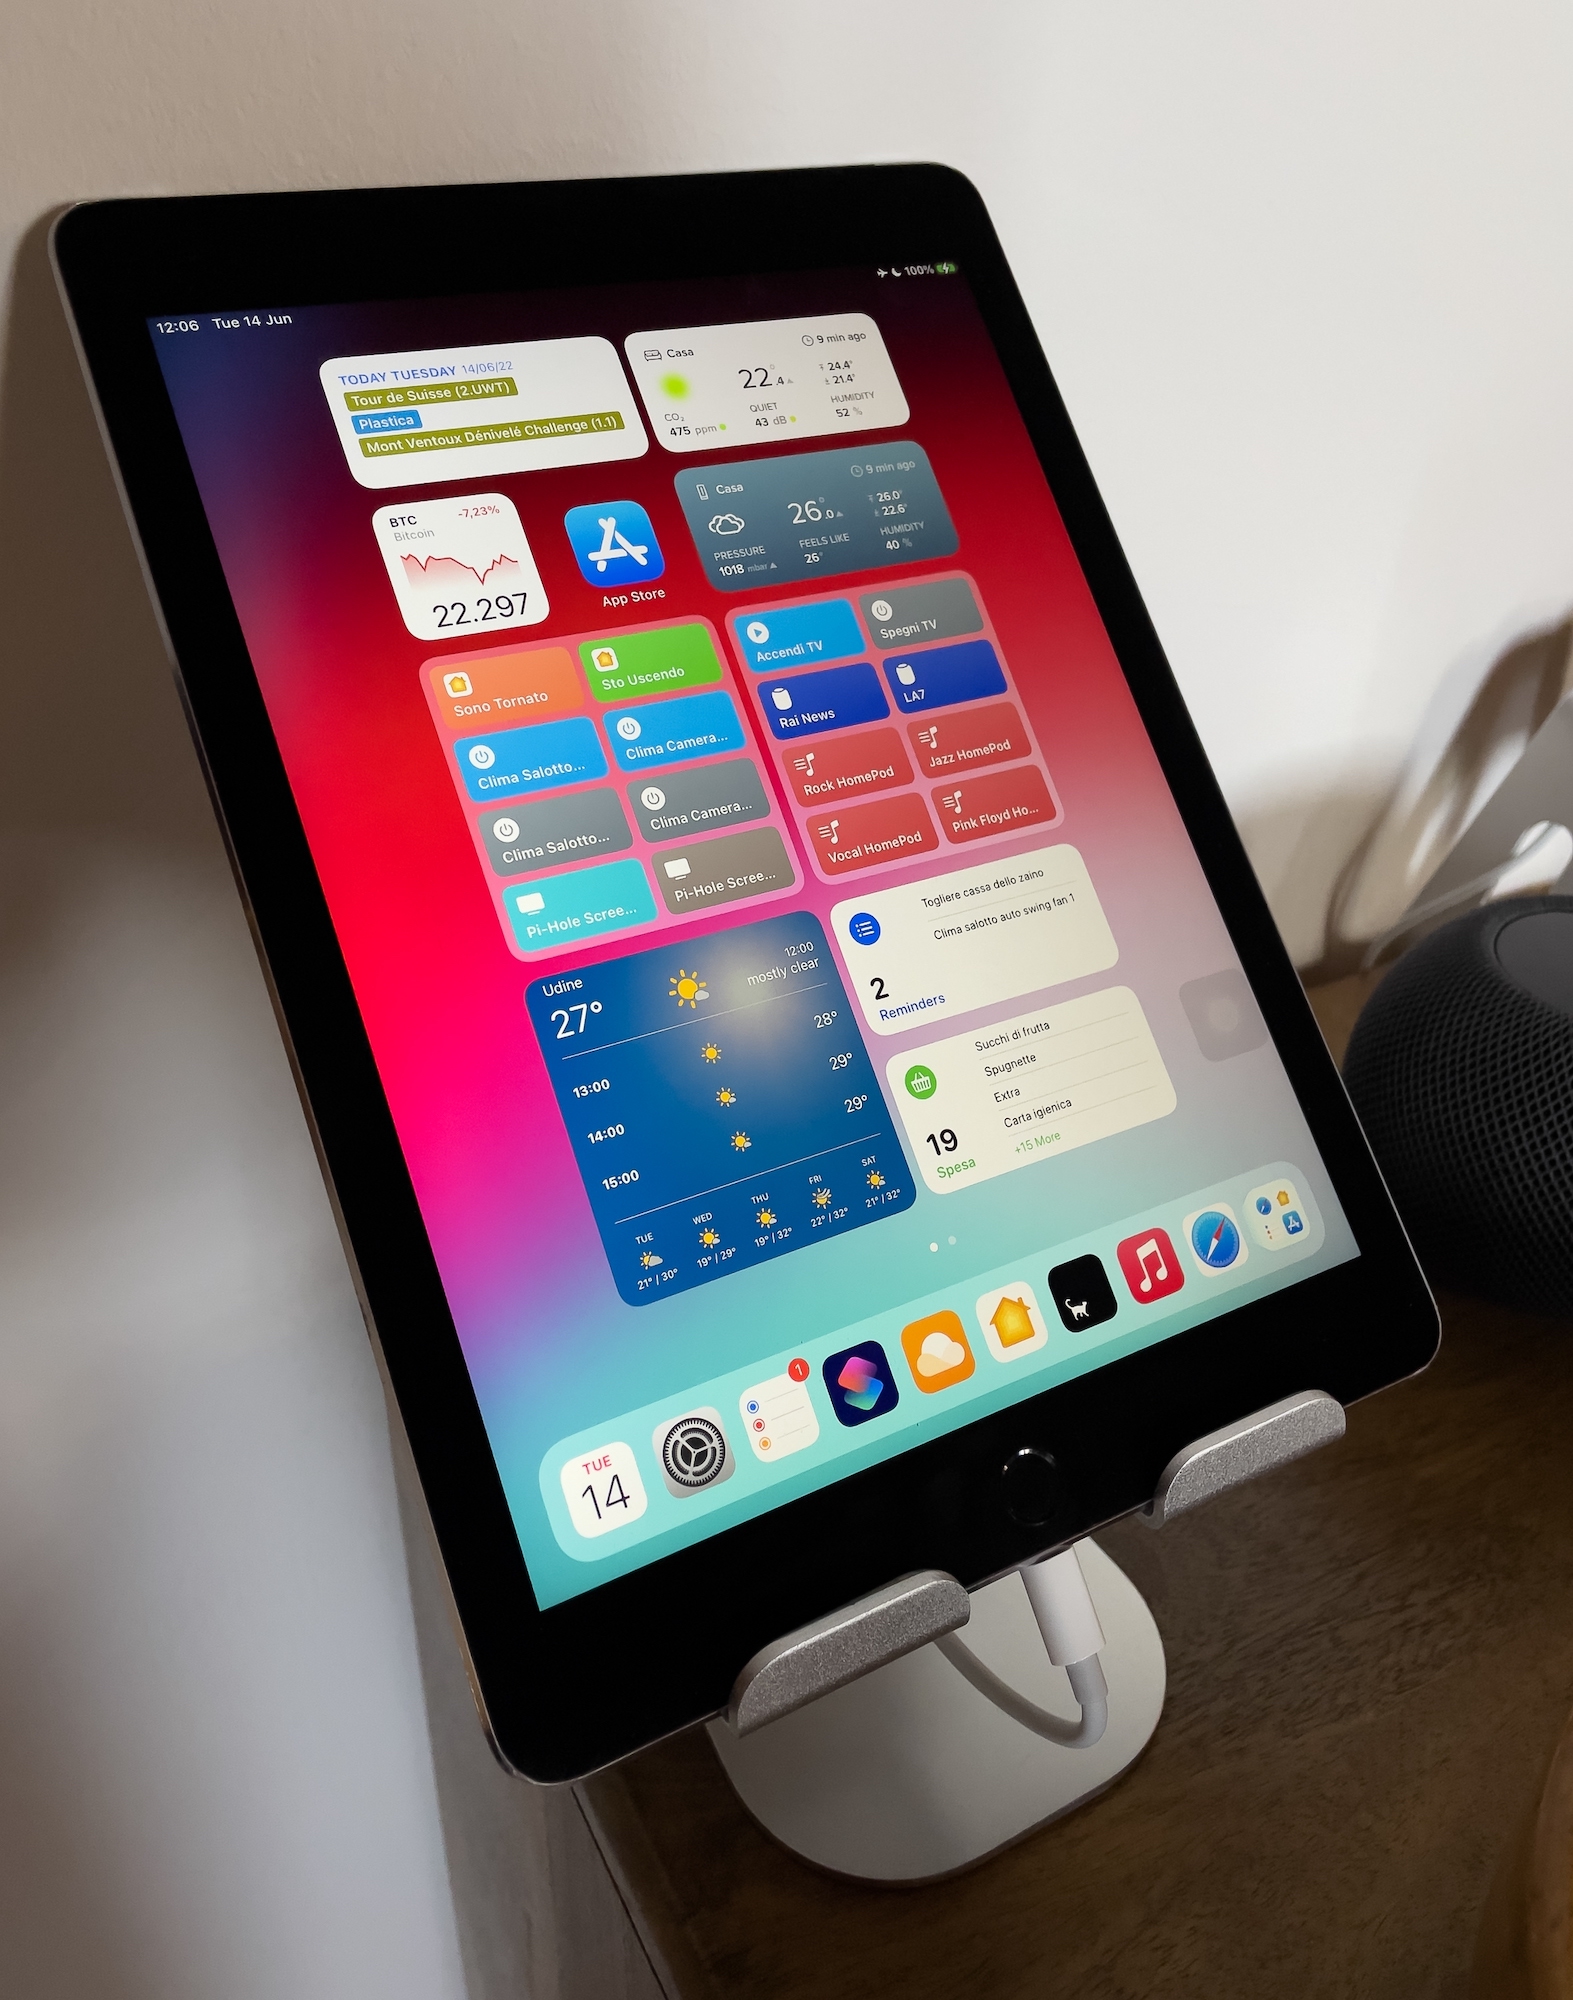
It’s always on and with an Ethernet-Lightning converter (plus charge port), so it can be an HomeKit hub plus an hub for everything.
For example I created some shortcuts that open my favorites playlists on the HomePod, or when I’m going out of home I simply press a shortcut to turn off all the lights, accessories,turns off the Pi-Hole screen etc… same for when I’m coming home.
Also it acts as kiosk for the Grafana stats, that usually I leave always active the screen and sometimes I check it.

A suggestion could be to use the “Assistive Touch” feature tu turn off the display (double tap), switch to another app or home screen. It’s easier than press the physical home button.
Conclusion
There are some questions that I need to explain:
-Why not use only one RaspberryPI for Grafana, Pi-Hole, Homebridge? Because if one thing fails or I need to update something, using 3 RaspberryPI I can upgrade or modify a service without stopping other services (like Homebridge that’s fundamental).
-What backup are you using? DietPI integrated tool to backup the microSD card to a USB3 connected drive. It does the backup daily via cron. Plus I manually backup (via SFTP, I’m using Cyberduck app) some files and folders.
-Is it complicated to set up? No it isn’t but it’s long and takes lots of time because you need to adjust all the softwares for your environment. You can’t think “okay, tomorrow I’ll do it”, no, because it won’t take one day, theoretically could, but practically something won’t work and you will need time to understand the issue and fix it. You don’t need complicated skills but you need a basic knowledge of lots of services and softwares, here I try to make a short list:
- Linux/Unix for the RaspberryPIs
- Bash to configure the RPi displays
- Some networking skills to setup OpenWRT and Pi-Hole
- A little knowledge of a database/queries to configure Grafana and Prometheus for the stats and notifications
-Is it expensive? Well, it’s complicated to say because I bought those things over 6/7 years or more, and not all together, so I have no idea of the actual prices. But it’s not very expensive, it should be about the price of a mini-pc, 800/1000€ (?).
Feel free to comment and ask info if you need to know something more.
P.S. English is not my first language, I’m italian (and I write quite bad also in italian) so I can have made some typo errors.